Rubella-Specific Neutralizing Antibody Titers
Nathaniel D. Lambert,aV. Shane Pankratz,bBeth R. Larrabee,bAdaeze Ogee-Nwankwo,cMin-hsin Chen,cJoseph P. Icenogle,c Gregory A. Polanda,d
Mayo Vaccine Research Group, Mayo Clinic, Rochester, Minnesota, USAa
; Division of Biostatistics, Mayo Clinic, Rochester, Minnesota, USAb
; National Center for Immunization and Respiratory Diseases, Centers for Disease Control and Prevention, Atlanta, Georgia, USAc
; Program in Translational Immunovirology and Biodefense, Mayo Clinic, Rochester, Minnesota, USAd
Rubella remains a social and economic burden due to the high incidence of congenital rubella syndrome (CRS) in some
coun-tries. For this reason, an accurate and efficient high-throughput measure of antibody response to vaccination is an important
tool. In order to measure rubella-specific neutralizing antibodies in a large cohort of vaccinated individuals, a high-throughput
immunocolorimetric system was developed. Statistical interpolation models were applied to the resulting titers to refine
quanti-tative estimates of neutralizing antibody titers relative to the assayed neutralizing antibody dilutions. This assay, including the
statistical methods developed, can be used to assess the neutralizing humoral immune response to rubella virus and may be
adaptable for assessing the response to other viral vaccines and infectious agents.
A
cute infection with rubella virus usually results in a mild fever
and rash. However, complications can arise when infection
occurs during pregnancy. In this case, rubella virus is able to
es-tablish infection in the fetus, where there is up to a 90% risk of
developing congenital rubella syndrome (CRS) if infection occurs
during the first trimester (
1
,
2
). Although vaccination programs
have decreased the number of rubella cases and CRS in most
countries, the burden of rubella and CRS is still high in many
developing countries. Improved surveillance is needed to evaluate
the progress of control programs (
3
).
Traditional assays, like enzyme immunoassays (EIA),
hemag-glutination inhibition assays (HAI), and neutralization assays,
have been successfully implemented for laboratory diagnostics
and screening techniques. However, issues such as false positives,
lack of sensitivity, standardization between platforms, and the
time and resources needed to efficiently measure responses in a
large number of samples still exist (
4–10
). Thus, a standard and
efficient method that resolves some or all of these issues is needed.
Our laboratories previously used a rubella virus-specific
chemilu-minescent immunoassay (Beckman Coulter Access, Brea, CA)
and in-house colorimetry- and fluorescence-based immunoassays
(Centers for Disease Control and Prevention [CDC]) to measure
antibody titers to rubella virus. The chemiluminescent
immuno-assay produced highly sensitive and reproducible antibody titer
data and revealed a large spectrum of antibody responses in
indi-viduals vaccinated against rubella virus (
11
,
12
). Although this
quantifies rubella virus antibodies, the focus of our current study
was to measure functional neutralizing antibodies against rubella
virus.
The first aim of this study was to adapt an immunocolorimetric
system for the large-scale, high-throughput quantitation of
ru-bella virus-neutralizing antibody in a cohort of 2,091 subjects and
to test the level of precision between repeated results. Next,
statis-tical approaches were used to interpolate these data into
quanti-tative estimates of individual subject titer values that can be used
as continuous measurements in subsequent analyses. Finally,
cor-relations between titers measured using a standardized, rubella
virus-specific IgG EIA and our functional neutralizing antibody
assay were investigated.
MATERIALS AND METHODS
Study participants.Blood samples from eligible subjects were collected
from healthy children, older adolescents, and adults (aged 11 to 40 years), consisting of Olmsted County residents (Rochester, MN, cohort) and armed forces personnel (San Diego, CA, cohort). The clinical details and demographic characteristics have been previously reported (13–15). The Rochester cohort consists of 1,092 individuals from three independent, age-stratified random cohorts of healthy schoolchildren and young adults from all socioeconomic strata in Rochester, MN. All participants had written records of having received two doses of measles-mumps-rubella vaccine (MMR II) (Merck). Of 1,092 subjects, 1,082 met our inclusion criteria.
In addition, we enrolled 1,076 healthy older adolescents and adults (18 to 40 years old) in the San Diego cohort. Subject enrollment for this study has been previously described in detail (14,15). As members of the U.S. military, these subjects represent a cross section of the U.S. population. Of 1,076 subjects, 1,009 met our inclusion criteria for this study. The Insti-tutional Review Boards of the Mayo Clinic and Naval Health Research Center (NHRC) approved the study, and written informed consent was obtained from each subject and/or from the parents of all children who participated, as well as written assent from age-appropriate participants. The measurement of neutralization antibodies was done at CDC anony-mously without personal identifiable information of the study subjects.
sICNA.A modified version of the indirect immunocolorimetric assay
(ICA)-based neutralization method described by Chen et al., i.e., a soluble immunocolorimetric neutralization assay (sICNA), was used in this study (16). Each 96-well test plate contained virus-infected control (VIC; 4 wells
Received23 October 2013Returned for modification27 November 2013 Accepted27 December 2013
Published ahead of print3 January 2014 Editor:D. L. Burns
Address correspondence to Gregory A. Poland, [email protected]. Copyright © 2014, American Society for Microbiology. All Rights Reserved.
doi:10.1128/CVI.00681-13
on August 17, 2020 by guest
http://cvi.asm.org/
with no serum), uninfected control (4 wells with no serum or virus), and two control sera: CDC anti-rubella human serum reference preparation (low positive) (IS2153) and a seronegative serum (SNS) collected from an individual prior to rubella vaccination (RP-011 panel member 1; Biomex GmbH, Heidelberg, Germany). The positive control was used undiluted, and the negative control was diluted 1:20 before testing. Both control sera had been extensively characterized and demonstrated reproducible re-sults (our unpublished data).
All sera were heat inactivated for 1 h at 56°C prior to testing. Sera were serially diluted in a 2-fold series beginning from 1:12.5 through 1:100 in 96-well plates using phosphate-buffered saline (PBS) supplemented with 1% fetal bovine serum (FBS) (diluent) to yield a final volume of 30l per dilution. Study sera were diluted in triplicate, and control sera were di-luted in duplicate. Rubella virus HPV-77, didi-luted to a final concentration of 1.2⫻103PFU/ml, was mixed with an equal volume of each diluted serum (or diluent as in the case of VIC), yielding a final serum dilution series of 1:25 through 1:200, after which the plate was incubated for 1.5 h at 37°C, 5% CO2. Fifty microliters of each mixture was used to inoculate confluent Vero cells cultured in 96-well plates and incubated for 1 h at 37°C, 5% CO2, 100% humidity. Note that the 1:25 dilution contained 2l of serum in the final inoculant and each infected well received approxi-mately 30 PFU of virus. Uninfected control wells received 50l of diluent. After the 1-h incubation, Dulbecco’s modified Eagle medium (DMEM) supplemented with 5% FBS and 50g/ml gentamicin (Life Technology, Grand Island, NY) was added to each well, and the plate was incubated for 3 days at 37°C, 5% CO2. To measure the amount of rubella virus used in each test run, a back titration of the diluted virus using Vero cells cultured in a 48-well plate was performed (in triplicate), as previously described (16).
At 3 days postinfection, plates were washed once with PBS, fixed with methanol, and blocked with Blotto (PBS supplemented with 5% skim milk [Becton, Dickinson and Company, Franklin Lakes, NJ] and 0.1% Tween 20). The procedure for primary and secondary antibody detection was as described earlier by Chen et al. (16) with minor modifications: an in-house rubella virus E1 mouse monoclonal antibody (5g/ml) was used as a primary antibody, followed by three washes using PBS supple-mented with 0.05% Tween 20 (PBS-T). Next, a goat anti-mouse horse-radish peroxidase (HRP)-conjugated antibody (0.5g/ml; Life Technol-ogies) in Blotto was used as a secondary antibody, followed by an identical washing step. A soluble TMB (3,3=,5,5=-tetramethylbenzidine) substrate (NeA-Blue TMB substrate; Clinical Science Products, Mansfield, MA) was added for 10 min, and then the reaction was stopped using 0.5 M sulfuric acid. Optical density (OD) values were determined by spectro-photometry (Eon Microplate; Biotek, Winooski, VT) using a measure-ment/reference wavelength pair of 450 nm/630 nm. Each plate was con-sidered a unit and was independently assessed. We concon-sidered a plate valid if (i) at least three of the four uninfected control wells fell within 2 stan-dard deviations of the mean and the OD of the mean was between 0 and 0.3; (ii) at least three of the four virus-infected control wells fell within 2 standard deviations of the mean and the OD of the mean was between 0.6 and 2; (iii) the in-plate positive control gave a positive neutralization result; and (iv) the in-plate negative control gave a negative neutralization result. The mean OD value of the uninfected control wells was subtracted before signals from replicates were averaged. The neutralization titer (NT50) was considered the highest dilution at which the input virus signal was reduced by at least 50%. Sera that exhibited a reduction of virus greater than 50% at the last dilution (i.e., 1:200) were retested using a higher dilution series. Following titration, the corresponding integer titer value was recorded as an initial estimate of the NT50for each assayed sample. For convenience in calculation, a value of 0 was assigned to all sera with NT50less than 1:25. To test for reproducibility, a total of 491 sera were retested on separate days from the original tests. These included the first 300 sera and 191 randomly selected sera from the remaining 1,791 sera.
High-throughput assay optimization.Conventional rubella
neutral-ization assays using a plaque reduction method require anywhere from 6 to 11 days to complete and are difficult to standardize (17–22). The sICNA allowed neutralizing antibodies to be detected in as few as 3 days and eliminated viewer subjectivity by employing automated data acquisition (enzyme-linked immunosorbent assay [ELISA] plate reader), and the de-tection portion of the assay (steps following the 3-day incubation) could be completed by anyone with an enzyme immunoassay skill set. Further-more, the microformat reduced the amount of serum and reagents re-quired compared to other neutralization formats.
To further enhance the assay, the detection portion was optimized to a high-throughput format using an EL406 combination microplate washer dispenser, an Eon microplate spectrophotometer, and two BioStack mi-croplate stackers (Biotek, Winooski, VT). This enhanced throughput by a factor of about 3 and reduced technician hands-on time by a factor of about 6.
Statistical analysis.The purpose of the statistical analyses was to
in-terpolate the observed titration values in order to estimate the magnitude of the NT50, which could be used as a quantitative outcome in future studies. We considered two different analytical approaches in our efforts to interpolate the assay results, seeking more accurate determinations of the rubella-specific antibody present in each sample. The first approach was to fit a logistic model to the assay results, and the second was to use loess, a statistical smoother.
The logistic model describes an s-shaped curve that exponentially in-creases as it deviates, with the growth of the curve slowing as it approaches an upper limit (u). The function can be written as: f(x)⫽u/{1⫹exp[(h⫺ x)/s]}, wheresis a scale parameter that reflects the rate of growth of the curve andhreflects the value ofxat which the value of the function is halfway between the minimum and maximum value. This model has the benefit of directly estimating the NT50from the observed data.
The loess approach is a robust statistical procedure that fits a line through pairs of data points (23). The method is insensitive to outlying values and creates a smooth curve along the range ofxvalues by combin-ing a series of locally linear line segments into a scombin-ingle curve. In order to use this approach to estimate the NT50values, we estimated a curve that predicted the observed assay results with the titer values that were as-sessed. We estimated the interpolated titer value by projecting down to the xaxis from the point where the fitted curve was midway between the minimum and maximum control values.
In order to utilize either of the two approaches, it is necessary to use the results from control values from the plate on which the sample was run. In order to make the estimation of the interpolated values possible, we used the results from the uninfected control to represent the background noise of the assay. We used the results from three different conditions to repre-sent the maximum expected value of the titration curve. These three con-ditions were as follows: (i) those obtained when assessing the maximum dilution assayed (MAX) for the specific sample; (ii) plate-specific values from VIC; and (iii) plate-specific values from SNS. Under a successful titration, the values from all three conditions should represent the maxi-mum expected value of the titration curve. However, there are often dif-ferences among them. In order to obtain interpolated estimates for a given sample, we used the values from each of these three conditions to repre-sent the true maximum value and estimated three different NT50values.
To obtain estimates from the logistic model, we first subtracted the median value from the uninfected control from all observed values and then estimated the parameters of the logistic model using nonlinear least squares, one of which is explicitly the value of the NT50.
To obtain estimates from the loess smoother, we set the uninfected control as a titration of 0 and fit the loess trend describing the relationship between the titration values and the observed assay results. In order to predict an NT50value in the first experimental condition, we identified the mean of the titration values, which resulted in loess-predicted assay results that were in a symmetric region around 0.5, after rescaling the data such that the uninfected control had a median of 0 and the median assay result
on August 17, 2020 by guest
http://cvi.asm.org/
at the maximum titration had a value of 1.0. Because the value at the maximum titration was not always equal to the SNS control or the virus-infected control states (virus-virus-infected control; maximum dilution), we produced two additional NT50estimates by rescaling this original esti-mate to correspond to an NT50value relative to the maximum assay re-sults from these two control conditions. The final estimate of the NT50was set as equal to the average of the interpolated values obtained when using the VIC and SNS estimates of the maximum absorbance. When possible, the NT50obtained using the MAX estimate of maximum absorbance was included in this average. For the MAX dilution assay result to accurately reflect the upper limit of the assay activity, the titration curve should be observed to approach an upper threshold. Therefore, in order to use the MAX value in the final estimation of the NT50, we tested for evidence of negative curvature across the observed titers using a quadratic contrast following an analysis of variance, with activity levels as the response vari-able and titration values as the categorical predictor varivari-able. For experi-ments with evidence that the observed titration approached a threshold for the absorbance values (Pvalue for negative curvature,⬍0.05), the MAX value was used in the computation of the NT50. For the remaining experiments, only estimates using the SNS and VIC controls were used.
We assessed the performance of these estimation techniques by sum-marizing their results within the categorical titration value estimated via laboratory observation and computing the percentage of variability in the interpolation estimates, which is explained by the categorical values ob-tained by laboratory observation. Additionally, we applied linear mixed-models approaches with per-subject random effects to the NT50values for those subjects who were assayed twice. This enabled additional assess-ments of the assay’s overall performance. These assessassess-ments include esti-mates of intraclass correlation coefficients to measure assay reproducibil-ity and model residuals that assess the degree by which the estimated NT50 values deviated from their expected values. All statistical analyses were performed using the R statistical software package version 2.15.0 (http: //cran.us.r-project.org/).
RESULTS
Characterization of neutralizing antibody titers.
This assay was
applied to data from two cohorts of individuals.
Table 1
illustrates
the demographic information of the subjects from whom the
ru-bella virus-neutralizing antibody data were obtained. A total of
2,091 subjects were assayed, and
Fig. 1
illustrates the initial NT
50estimates that were obtained by selecting the specific dilution that
best agreed with a reduction of 50% in viral activity levels.
Ap-proximately 20% of subjects were deemed to have NT
50estimates
of
⬍
25. The bulk of subjects had estimates of 25, 50, or 100 (22%,
32%, and 18%, respectively), and roughly 1% had NT
50values
greater than 400. Of the 491 subjects who were assayed twice, the
distribution was similar between the two repeated assessments
(
Table 2
). There was reasonably strong agreement between the
two measurements as measured by weighted kappa, which was
equal to 0.76 (95% confidence interval [CI], 0.69 to 0.82). Among
those who had repeat measurements, the initial values had a
me-dian of 50 and an interquartile range (IQR) ranging from 12.5 to
50. The repeat values had a median of 50 and an IQR ranging from
0 to 50.
Interpolation of neutralizing antibody titers.
Loess
interpo-lation was performed on all of the observed data as described
above to obtain three NT
50values that corresponded to the three
different reference conditions, the MAX, the VIC, and the SNS.
We chose to use averages of either 2 or 3 of these three values to
represent our best estimate of rubella virus-specific neutralizing
antibody titers. We estimated the intraclass correlation (ICC)
from the log-transformed estimates obtained from the 491
sub-jects with repeated measurements for the NT
50values in order to
measure the reproducibility of our interpolation approach when
applied to results from repeated assays. The ICC was equal to 0.89,
suggesting a high degree of reproducibility in the assay, as
mea-TABLE 1Demographics of study participantsaCharacteristic
Rochester (n⫽1,082)
San Diego (n⫽1,009)
Total (n⫽2,091)
Gender
Male 596 (55.1) 738 (73.1) 1,334 (63.8) Female 486 (44.9) 271 (26.9) 757 (36.2)
Age at enrollment (yr)
Median 15.0 24.0 18.0
Range 11.0–22.0 19.0–40.0 11.0–40.0
Race
American Indian, Alaska native
4 (0.4) 19 (1.9) 23 (1.1)
Asian, Hawaiian or Pacific Islander
27 (2.5) 49 (4.9) 76 (3.6)
Black or African American 86 (7.9) 169 (16.7) 255 (12.2) White 922 (85.2) 538 (53.3) 1,460 (69.8)
Multiple 29 (2.7) 86 (8.5) 115 (5.5)
Other 7 (0.6) 127 (12.6) 134 (6.4)
Unknown 7 (0.6) 21 (2.1) 28 (1.3)
Ethnicity
Not Hispanic 1,054 (97.4) 752 (74.5) 1,806 (86.4) Hispanic 21 (1.9) 215 (21.3) 236 (11.3) Do not know 7 (0.6) 42 (4.2) 49 (2.3) a
Except for age, values are numbers of individuals; values in parentheses are percentages.
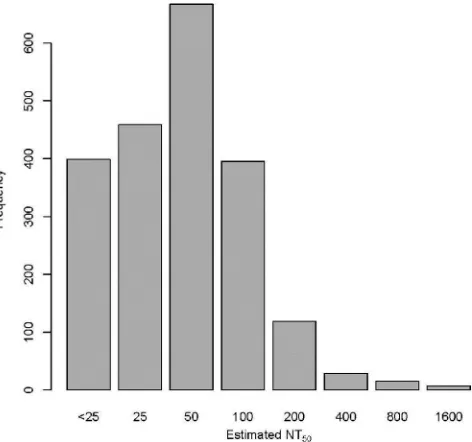
FIG 1Distribution of initial NT50values, estimated as the first dilution that
resulted in a 50% reduction in observed activity from the positive control. Rubella virus-specific neutralizing antibodies were measured in 2,091 vacci-nated subjects using a high-throughput ICA. The broad spectrum of observed NT50(0 to 1,600) demonstrates that there is a large range in the levels of
neutralizing antibodies in vaccinated cohorts.
on August 17, 2020 by guest
http://cvi.asm.org/
sured by our interpolated NT
50values.
Figure 2
illustrates the
distribution of these interpolated estimates. We compared these
interpolated values to the initial NT
50estimates, and the
relation-ship between these values suggests that the interpolated values are
broadly in agreement with the uninterpolated values.
Figure 3
illustrates the agreement of initial observed NT
50levels and those
calculated using the loess approach of interpolation. The most
visible discrepancy between the interpolated and uninterpolated
values is for those originally read as having a titer of 25. There are
outlying points where the interpolation procedure estimated a
value that was somewhat higher than typical. Upon inspection,
these differences tended to arise when a much lower absorbance
was observed in one or both of the SNS- or VIC-positive controls
than the absorbance observed at the maximum dilution of 1:200.
That our assessment of the reproducibility of rubella
virus-specific neutralizing antibodies resulted in an ICC of 0.89 suggests
that the loess-interpolated values are highly replicable and that the
approach is more than adequate for research purposes, although it
doesn’t quite meet the standard of 0.9 required for clinical use
(
24
). This compares favorably to the weighted kappa of 0.76 for
the categorical lab-based measurements, which suggests a
sub-stantial, but not outstanding, degree of reproducibility (
25
).
Im-portantly, when we compared the categorical titration values
esti-mated via laboratory observation to the interpolated NT
50values
using analysis of variance, nearly 90% of the variability in the
interpolated values was explained by the categorical lab-based
es-timates of rubella virus-specific antibody levels.
In certain cases, we had to apply omission thresholds and
cus-tom titer definitions in response to observed performance of the
interpolation approach. For example, if the data were consistent
with the neutralizing antibody titer being lower than the lowest
dilution (1:25), then the interpolation approach would typically
estimate the neutralizing titer to be just outside the range of
ob-served dilutions (e.g., 1:24 or 1:23). When we use these
interpo-TABLE 2Agreement between initial and repeated neutralizing antibody titers, evaluated without interpolationaInitial value
No. (%) of subjects with indicated NT50value
Repeat value
Total
0 25 50 100 200 400 800 1,600
0 123 (100.0) 0 (0.0) 0 (0.0) 0 (0.0) 0 (0.0) 0 (0.0) 0 (0.0) 0 (0.0) 123 (25.1)
25 1 (1.0) 60 (57.7) 42 (40.4) 1 (1.0) 0 (0.0) 0 (0.0) 0 (0.0) 0 (0.0) 104 (21.2)
50 0 (0.0) 42 (24.6) 94 (55.0) 35 (20.5) 0 (0.0) 0 (0.0) 0 (0.0) 0 (0.0) 171 (34.8) 100 0 (0.0) 1 (1.7) 25 (43.1) 27 (46.6) 5 (8.6) 0 (0.0) 0 (0.0) 0 (0.0) 58 (11.8) 200 0 (0.0) 0 (0.0) 0 (0.0) 7 (29.2) 14 (58.3) 3 (12.5) 0 (0.0) 0 (0.0) 24 (4.9)
400 0 (0.0) 0 (0.0) 0 (0.0) 0 (0.0) 2 (40.0) 1 (20.0) 2 (40.0) 0 (0.0) 5 (1.0)
800 0 (0.0) 0 (0.0) 0 (0.0) 0 (0.0) 0 (0.0) 0 (0.0) 4 (100.0) 0 (0.0) 4 (0.8)
1,600 0 (0.0) 0 (0.0) 0 (0.0) 0 (0.0) 0 (0.0) 0 (0.0) 1 (50.0) 1 (50.0) 2 (0.4)
Total 124 103 161 70 221 4 7 1 491
a
Values are shown asn(% of the row), with initial NT50estimates shown for rows and repeat NT50estimates shown for columns. Those subjects with an initial NT50of⬍1:25 were assigned a value of 0. A weighted kappa of 0.76 with a 95% confidence interval between 0.69 and 0.82 suggests that this assay produces reproducible data.
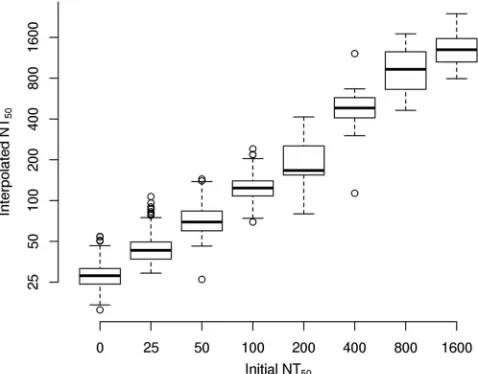
FIG 2Distribution of interpolated NT50values, estimated via the loess-based
interpolation approach. Rubella virus-specific neutralizing antibodies were interpolated for 2,090 vaccinated subjects, using a high-throughput ICA. This distribution agrees with that generated by the uninterpolated values, with the exception that fewer interpolated values were estimated to be less than a titer of 1:25.
FIG 3Box plots of NT50values, estimated via the loess-based interpolation
approach, within categories of initial NT50values, estimated without
interpo-lation. A high degree of agreement is reflected between the two methods, as the box plots of the interpolated values demonstrate tight distributions within uninterpolated NT50values and they increase in a regular pattern as a function
of the uninterpolated NT50values.
on August 17, 2020 by guest
http://cvi.asm.org/
lated values in analyses, we use the interpolated titer value.
How-ever, for descriptive purposes we define these subjects as having an
NT
50below minimum detection (1:25) and would consider them
“nonresponders.” This is in keeping with the manually estimated
values, where the observed value was recorded as 0 if the observed
NT
50was below a titer of 1:25. Other quality control thresholds
allow us to flag the assay results from subjects whose data do not
follow a traditional titration curve. Upon review of the data
flagged by these thresholds, we are able to assess whether the
in-terpolated value is likely to be an appropriate estimate of an
indi-vidual’s rubella virus-specific neutralizing antibody titers and
therefore to decide whether or not it is appropriate to include the
data in analyses.
We have previously reported rubella virus-specific IgG levels
using Beckman Coulter’s Access Rubella IgG assay (
12
,
26–30
).
This assay calculates anti-rubella virus (strain HPV-77) titers
based on a standard curve calibrated against the WHO 2nd
Inter-national Standard Preparation for Anti-Rubella Serum. In order
to demonstrate the accuracy of our interpolated values, we
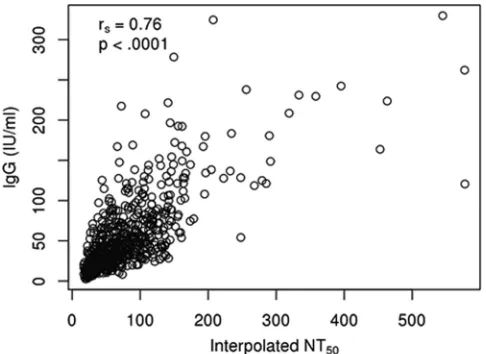
exam-ined the correlation between rubella virus-specific IgG levels and
NT
50values in 732 subjects with both assessments (
Fig. 4
). The
degree of agreement between the results of the two assays
de-creases for increasing estimates of antibody levels, and the rubella
virus-specific IgG levels have some ability to distinguish antibody
levels below the lower limit of detection in a neutralization assay.
However, the Spearman correlation coefficient between the two
measurements was 0.76, suggesting a strong, but not perfect,
as-sociation between the results of the two assays. Although the
ma-jor focus of this study was to test the precision of the sICNA
high-throughput assay and to develop a statistical interpolation
method, the strong association observed between NT
50and
ru-bella IgG EIA could be considered a step toward standardizing our
assay.
DISCUSSION
The high-throughput neutralizing antibody assay described here
was adapted from an indirect immunocolorimetric assay (ICA)
used for the detection and quantification of rubella virus (
16
). The
advantages of the first generation of the ICA are its low cost,
sen-sitivity of detection (as few as 10 PFU), adaptability to other virus
models, and the ability to measure neutralizing antibodies.
Be-cause the detection of virus-infected cells relies on the naked eye to
visualize results by ICA, it is not feasible to measure neutralizing
titers in a large number of sera. Our goal was to build upon the
ICA to develop an automated, high-throughput assay that would
eliminate human error in the quantification of neutralizing
anti-bodies in a large cohort of vaccinated subjects. This assay
mea-sures the total amount of virus in infected cells rather than the
number of individual foci of infection. Since foci of rubella
infec-tion can vary in size, this assay should be more reproducible than
counting individual foci visually. We successfully deployed this
approach to assess neutralizing antibody titers in a total of 2,091
subjects. The high-throughput format allowed testing for the
cur-rent study to be accomplished with
⬃
15 person months’ worth of
investment. After optimization of the statistical methods, the
NT
50interpolation is now automated and can be run over a very
short time.
The initial serum titers were reported as the value nearest to the
dilution that decreased rubella virus levels by 50% (NT
50). These
results were efficient enough to categorize the extremes of our
cohort, such as the highest and lowest responders (
Fig. 1
).
How-ever, our laboratory focuses on the influence of individual genetic
variants on immunity to rubella virus vaccine. We have previously
used statistical methods to estimate neutralizing antibodies to
vac-cinia virus in more than 3,000 samples from military personnel
vaccinated with ACAM2000 (Acambis) (
31
). Our first approach
was to fit the initial antibody titers to a logistic model. Although
this model was successful in interpolating values between titers
and has the advantage of directly modeling the NT
50value as one
of its parameters, it was successful for only 95% of samples. We
found that the logistic model failed either when there was no
evi-dence of a rubella virus antibody response or when there were
large differences between the measured absorbance at the
maxi-mum titration and the values observed for the positive virus
con-trols. As the data from the assay did not show issues with
mono-tonicity, we opted to use a different statistical estimation model in
order to obtain estimates of NT
50from such samples rather than
to repeat the assay in this high-throughput setting. The loess
ap-proach that we ultimately used successfully returned an
interpo-lated NT
50estimate for all subjects.
Traditionally, immunity to rubella is considered to occur when
antibody levels are at or above 10 IU/ml (
32
). It is unclear at
present how neutralizing antibody titers measured using this
method compare to established methodologies. The gold standard
to compare novel methods of rubella virus-specific antibody
quantification is the HAI test (
33
). By developing a standardized
and highly reproducible neutralization testing protocol, our work
has likely made statistically significant studies correlating
interna-tional units (IU/ml) with neutralization titers possible, as has been
done for measles virus (
34
).
In conclusion, we have described the adaption of an established
ICA to quantify the levels of neutralizing antibodies against
ru-bella virus in vaccinated individuals and used statistical methods
FIG 4Scatter plot demonstrating the association between IgG levelscalcu-lated using a rubella virus-specific EIA and the interpocalcu-lated values obtained from our high-throughput ICA for 732 participants with both measurements. Open circles represent the assay results from both assays, measured for each individual, andrsis the IgG/NT50Spearman rank correlation coefficient.
Al-though agreement between the two methods decreases with increasing anti-body levels and the interpolated NT50values have a somewhat higher lower
limit of detection, the correlation coefficient of 0.76 suggests a strong corre-spondence between results from the two assay methods.
on August 17, 2020 by guest
http://cvi.asm.org/
to interpolate titers. This assay is highly sensitive and exhibits
acceptable levels of variability between repeats. There is also a
positive correlation between this assay, which measures
func-tional, neutralizing antibody levels, and an accepted, standardized
assay for the measurement of all rubella virus-specific antibody
levels. The automation of a portion of the assay has decreased the
potential for human error and allows for rapid assessment of large
numbers of samples. It is substantially lower in cost than other
high-throughput systems and may be adaptable to other viral
dis-eases. Another great strength of the assay is the ability to quantify
the functional (neutralizing antibody) humoral response to
ru-bella vaccine.
The interpolation of rubella virus-specific neutralizing
anti-bodies produces results that are nearly equivalent to the
measure-ments obtained without interpolation. This finding, taken
to-gether with the high reproducibility of the assay, suggests that the
use of this interpolation approach produces estimates of
rubella-specific neutralizing antibody levels that appropriately estimate
the levels actually present in the serum samples. Although this
assay still needs to be standardized, its usefulness as a functional
measurement may be applied to investigating interindividual
dif-ferences in vaccine response or, perhaps, as a tool in clinical trials
of novel rubella vaccine candidates and in determining
postvacci-nation immunity in a population for rubella control and
elimina-tion activities.
ACKNOWLEDGMENTS
We thank Lijuan Hao and Adebola Adebayo of the Centers for Disease Control and Prevention (CDC) for their assistance with neutralization tests. We thank Caroline L. Vitse for her editorial assistance.
Research reported in this publication was supported by the National Institute of Allergy and Infectious Diseases of the National Institutes of Health under award number R37 AI048793-11(which recently received a MERIT award). The content is solely the responsibility of the authors and does not necessarily represent the official views of the National Institutes of Health.
Competing interests: G. A. Poland is the chair of a Safety Evaluation Committee for novel investigational vaccine trials being conducted by Merck Research Laboratories. G. A. Poland offers consultative advice on vaccine development to Merck & Co. Inc., CSL Biotherapies, Avianax, Sanofi Pasteur, Dynavax, Novartis Vaccines and Therapeutics, PAXVAX Inc., and Emergent Biosolutions. G. A. Poland holds two patents related to vaccinia peptide research. These activities have been reviewed by the Mayo Clinic Conflict of Interest Review Board and are conducted in com-pliance with Mayo Clinic Conflict of Interest policies. This research has been reviewed by the Mayo Clinic Conflict of Interest Review Board and was conducted in compliance with Mayo Clinic Conflict of Interest poli-cies.
The findings and conclusions in this report are those of the authors and do not necessarily represent the views of the U.S. Department of Health and Human Services.
REFERENCES
1.Katow S.1998. Rubella virus genome diagnosis during pregnancy and mechanism of congenital rubella. Intervirology41:163–169.http://dx.doi .org/10.1159/000024931.
2.Katow S.2004. Molecular epidemiology of rubella virus in Asia: utility for reduction in the burden of diseases due to congenital rubella syndrome. Pediatr. Int. 46:207–213. http://dx.doi.org/10.1046/j.1442-200x.2004 .01866.x.
3.Strebel PM, Gacic-Dobo M, Reef S, Cochi SL.2011. Global use of rubella vaccines, 1980 –2009. J. Infect. Dis.204(Suppl 2):S579 –S584.http://dx .doi.org/10.1093/infdis/jir447.
4.Dimech W, Arachchi N, Cai J, Sahin T, Wilson K.2013. Investigation
into low-level anti-rubella virus IgG results reported by commercial im-munoassays. Clin. Vaccine Immunol. 20:255–261.http://dx.doi.org/10 .1128/CVI.00603-12.
5.Castellano GA, Madden DL, Hazzard GT, Cleghorn CS, Vails DV, Ley AC, Tzan NR, Sever JL. 1981. Evaluation of commercially available diagnostic test kits for rubella. J. Infect. Dis.143:578 –584.http://dx.doi .org/10.1093/infdis/143.4.578.
6.Dimech W, Panagiotopoulos L, Francis B, Laven N, Marler J, Dickeson D, Panayotou T, Wilson K, Wootten R, Dax EM.2008. Evaluation of eight anti-rubella virus immunoglobulin g immunoassays that report re-sults in international units per milliliter. J. Clin. Microbiol.46:1955–1960.
http://dx.doi.org/10.1128/JCM.00231-08.
7.Meegan JM, Evans BK, Horstmann DM.1982. Comparison of the latex agglutination test with the hemagglutination inhibition test, enzyme-linked immunosorbent assay, and neutralization test for detection of an-tibodies to rubella virus. J. Clin. Microbiol.16:644 – 649.
8.Dimech W, Bettoli A, Eckert D, Francis B, Hamblin J, Kerr T, Ryan C, Skurrie I.1992. Multicenter evaluation of five commercial rubella virus immunoglobulin G kits which report in international units per milliliter. J. Clin. Microbiol.30:633– 641.
9.Truant AL, Barksdale BL, Huber TW, Elliott LB.1983. Comparison of an enzyme-linked immunosorbent assay with indirect hemagglutination and hemagglutination inhibition for determination of rubella virus anti-body: evaluation of immune status with commercial reagents in a clinical laboratory. J. Clin. Microbiol.17:106 –108.
10. Watson JC, Hadler SC, Dykewicz CA, Reef S, Phillips L.1998. Measles, mumps, and rubella—vaccine use and strategies for elimination of mea-sles, rubella, and congenital rubella syndrome and control of mumps: recommendations of the Advisory Committee on Immunization Practices (ACIP). MMWR Recommend. Rep.47:1–57.
11. Tosh PK, Kennedy RB, Vierkant RA, Jacobson RM, Poland GA.2009. Correlation between rubella antibody levels and cytokine measures of cell-mediated immunity. Viral Immunol.22:451– 456.http://dx.doi.org/10 .1089/vim.2009.0068.
12. Greenwood NP, Ovsyannikova IG, Vierkant RA, O’Byrne MM, Poland GA.2010. A qualitative and quantitative comparison of two rubella virus-specific IgG antibody immunoassays. Viral Immunol.23:353–357.http: //dx.doi.org/10.1089/vim.2010.0026.
13. Ovsyannikova IG, Dhiman N, Haralambieva IH, Vierkant RA, O’Byrne MM, Jacobson RM, Poland GA.2010. Rubella vaccine-induced cellular immunity: evidence of associations with polymorphisms in the Toll-like, vitamin A and D receptors, and innate immune response genes. Hum. Genet.127:207–221.http://dx.doi.org/10.1007/s00439-009-0763-1. 14. Kennedy RB, Ovsyannikova IG, Pankratz VS, Vierkant RA, Jacobson
RM, Ryan MA, Poland GA.2009. Gender effects on humoral immune responses to smallpox vaccine. Vaccine27:3319 –3323.http://dx.doi.org /10.1016/j.vaccine.2009.01.086.
15. Ovsyannikova IG, Vierkant RA, Pankratz VS, Jacobson RM, Poland GA.2011. Human leukocyte antigen genotypes in the genetic control of adaptive immune responses to smallpox vaccine. J. Infect. Dis.203:1546 – 1555.http://dx.doi.org/10.1093/infdis/jir167.
16. Chen MH, Zhu Z, Zhang Y, Favors S, Xu WB, Featherstone DA, Icenogle JP.2007. An indirect immunocolorimetric assay to detect rubella virus infected cells. J. Virol. Methods146:414 – 418.http://dx.doi.org/10 .1016/j.jviromet.2007.08.021.
17. Chen MH, Icenogle JP.2007. Molecular virology of rubella virus, p 1–18. InBanatvala J, Pekcham C (ed), Rubella viruses. Elsevier, Amsterdam, Netherlands.
18. Bellini WJ, Icenogle JP, Sever JL.2009. Measles, mumps, and rubella, p 562–577.InSpector S, Hodinka RL, Young SA, Wiedbrauk DL (ed), Clin-ical virology manual, 4th ed. ASM Press, Washington, DC.
19. Steece RS, Talley MS, Skeels MR, Lanier GA. 1985. Comparison of enzyme-linked immunosorbent assay, hemagglutination inhibition, and passive latex agglutination for determination of rubella immune status. J. Clin. Microbiol.21:140 –142.
20. Matsuno T.1984. A rapid simple indirect neutralization test for rubella antibody. Acta Virol.28:523.
21. Kobayashi N, Shibuta H, Matumoto M.1973. Agar-disc neutralization test for rubella virus. Jpn. J. Microbiol.17:313–316.http://dx.doi.org/10 .1111/j.1348-0421.1973.tb00778.x.
22. Rawls WE, Desmyter J, Melnick JL.1967. Rubella virus neutralization by plaque reduction. Proc. Soc. Exp. Biol. Med.124:167–172.http://dx.doi .org/10.3181/00379727-124-31692.
on August 17, 2020 by guest
http://cvi.asm.org/
23. Cleveland WS, Gross E, Shyu WM.1992. Local regression models, p 309 –376.InChambers JM, Hastie TJ (ed), Statistical models. Wadsworth & Brooks/Cole, Springer, Berlin, Germany.
24. Shoukri MM, Asyali MH, Donner A.2004. Sample size requirements for the design of reliability study: review and new results. Stat. Methods Med. Res.13:251–271.http://dx.doi.org/10.1191/0962280204sm365ra. 25. Landis JR, Koch GG.1977. The measurement of observer agreement for
categorical data. Biometrics 33:159 –174. http://dx.doi.org/10.2307 /2529310.
26. Ovsyannikova IG, Jacobson RM, Vierkant RA, O’Byrne MM, Poland GA.2009. Replication of rubella vaccine population genetic studies: vali-dation of HLA genotype and humoral response associations. Vaccine27: 6926 – 6931.http://dx.doi.org/10.1016/j.vaccine.2009.08.109.
27. Ovsyannikova IG, Haralambieva IH, Dhiman N, O’Byrne MM, Pank-ratz VS, Jacobson RM, Poland GA.2010. Polymorphisms in the vitamin A receptor and innate immunity genes influence the antibody response to rubella vaccination. J. Infect. Dis.201:207–213.http://dx.doi.org/10.1086 /649588.
28. Ovsyannikova IG, Vierkant RA, Pankratz VS, Jacobson RM, Poland GA.2010. Extended LTA, TNF, LST1 and HLA gene haplotypes and their association with rubella vaccine-induced immunity. PLoS One5:e11806.
http://dx.doi.org/10.1371/journal.pone.0011806.
29. Haralambieva IH, Dhiman N, Ovsyannikova IG, Vierkant RA, Pankratz
VS, Jacobson RM, Poland GA.2010. 2=-5=-Oligoadenylate synthetase single-nucleotide polymorphisms and haplotypes are associated with vari-ations in immune responses to rubella vaccine. Hum. Immunol.71:383– 391.http://dx.doi.org/10.1016/j.humimm.2010.01.004.
30. Dhiman N, Haralambieva IH, Kennedy RB, Vierkant RA, O’Byrne MM, Ovsyannikova IG, Jacobson RM, Poland GA.2010. SNP/haplotype associations in cytokine and cytokine receptor genes and immunity to rubella vaccine. Immunogenetics62:197–210.http://dx.doi.org/10.1007 /s00251-010-0423-6.
31. Kennedy R, Pankratz VS, Swanson E, Watson D, Golding H, Poland GA.2009. Statistical approach to estimate vaccinia-specific neutralizing antibody titers using a high-throughput assay. Clin. Vaccine Immunol. 16:1105–1112.http://dx.doi.org/10.1128/CVI.00109-09.
32. Skendzel LP.1996. Rubella immunity. Defining the level of protective antibody. Am. J. Clin. Pathol.106:170 –174.
33. Weber B.1997. Current developments in the laboratory diagnosis of rubella. Bull. Soc. Sci. Med. Grand Duche Luxemb.134:31– 41. (In Ger-man.)
34. Cohen BJ, Audet S, Andrews N, Beeler J.2007. Plaque reduction neu-tralization test for measles antibodies: description of a standardised labo-ratory method for use in immunogenicity studies of aerosol vaccination. Vaccine26:59 – 66.http://dx.doi.org/10.1016/j.vaccine.2007.10.046.