1556-6811/07/$08.00⫹0 doi:10.1128/CVI.00168-07
Copyright © 2007, American Society for Microbiology. All Rights Reserved.
Evaluation of a Single-Platform Technology for
Lymphocyte Immunophenotyping
䌤
Jeanette Higgins,
1* Valerie Hill,
1Karen Lau,
2Virginia Simpson,
1Jean Roayaei,
3Rick Klabansky,
3Randy A. Stevens,
1Julia A. Metcalf,
4and Michael Baseler
1AIDS Monitoring Laboratory, Clinical Services Program, SAIC-Frederick, Inc., NCI-Frederick, Frederick, Maryland 217021; Neutrophil Monitoring Laboratory, Clinical Services Program, SAIC-Frederick, Inc., NCI-Frederick, Frederick, Maryland 217022;
Data Management Services, Inc., NCI-Frederick, Frederick, Maryland3; and National Institute of Allergy and Infectious Diseases, National Institutes of Health, Bethesda, Maryland 208924
Received 19 April 2007/Returned for modification 25 May 2007/Accepted 19 August 2007
An accurate and reproducible CD4 count is a fundamental clinical tool for monitoring and treating human immunodeficiency virus infection and its complications. Two methods exist for calculating absolute CD4 counts: dual-platform technology (DPT) and single-platform technology (SPT). Numerous studies have doc-umented the unacceptably wide range of variation in absolute CD4 counts between laboratories. SPT was introduced in 1996 to reduce the interlaboratory variation in absolute CD4 counts. The aim of this study was to compare DPT with the BD Biosciences Trucount method (an SPT method). Both the percentages of CD4 (rⴝ
0.986;Pⴝ0.0541) and the absolute CD4 counts (rⴝ0.960;Pⴝ0.0001) had very good correlation between the two methods. However, poor correlation was observed for the CD8ⴙROⴚ(rⴝ0.314;Pⴝ0.0002), CD8ⴙDRⴙ (rⴝ0.666;Pⴝ0.0138), CD3ⴙCD38ⴙ(rⴝ0.8000;Pⴝ0.0004), CD3ⴙCD25ⴙ(rⴝ0.464;Pⴝ0.0082), and CD4ⴙCD38ⴙ(rⴝ0.357;Pⴝ0.0127) measurements.
The enumeration of CD4⫹T cells is an essential factor in the assessment of the immune systems of human immuno-deficiency virus (HIV)-infected individuals. The pathogenic process of AIDS is primarily a result of the depletion of CD4⫹ T cells. Opportunistic infections of every kind and malignant processes develop as CD4 cell levels drop. Case definitions of HIV infection are dependent on CD4 counts as well as on thresholds for the initiation of prophylactic regimens and antiretroviral therapy. The U.S. Public Health Service recommends that CD4⫹T-cell levels be monitored every 3 to 6 months in all HIV-infected persons (3, 4). This recommendation means that an accurate and reproducible CD4 count is a fundamental clinical tool for monitoring and treating HIV infection and its complications.
The most widely used (and still prevalent) method for CD4 enumeration in the past has been dual- or multiplat-form analysis. The total, or absolute, CD4 count is obtained from three clinical measurements, a white blood cell count, a lymphocyte percentage (differential), and CD4⫹ T-cell measurement using immunophenotyping by flow cytometry. The accuracy and reliability of all three measurements are dependent on the quality assurance procedures in place for the performance of clinical testing, the equipment used, the experience of the technical personnel performing the mea-surements, and the quality of the samples. In addition, all three measurements have a predictable range of variation. When all of these variables are considered and the three
measurements are multiplied together, any inaccuracies or errors are compounded.
Meetings between federal regulatory agencies, clinicians, and people working in the field of flow cytometry have resulted in guidelines that have been established and revised several times in the past 15 years to standardize CD4 testing procedures (8). Revisions have been published in response to new methods of testing and new technologies (2, 5). These steps resulted in widely improved performance of CD4 counts. Over the years, analysis has developed from single-color testing using peripheral blood mononuclear cells to multicolor testing using whole blood. Gating strat-egies have developed from forward-scatter (FSC) versus side-scatter (SSC) gating on lymphocytes to the use of the CD45 versus SSC gating for clear definition of lymphocyte populations.
In 2003, the CDC released the most recent revision spe-cifically to address the need to provide guidelines for the performance of single-platform absolute CD4⫹T-cell deter-minations (5). In 2000, two multicenter studies were pub-lished documenting the superior results obtained for CD4 counts in interlaboratory comparisons (9, 10). These results were superior in terms of their reproducibility, or precision. There is no true “gold standard” for the assessment of accuracy in CD4 determinations. It is important to realize that the difference between single- and multiplatform test-ing is not one of right answers versus wrong answers but of standardized answers. High precision is possible in single-platform testing because the results depend on only one measurement performed on a flow cytometer. There can be biological variations within an individual and variations re-lated to immunosuppressive therapy for individuals involved in long-term studies, necessitating a need for accuracy and reproducibility within an assay.
* Corresponding author. Mailing address: AIDS Monitoring Lab-oratory, Clinical Services program, SAIC-Frederick, Inc., NCI-Fre-derick, P.O. Box B, Bldg. 469-3 Room 9, FreNCI-Fre-derick, MD 21702. Phone: (301) 846-6267. Fax: (301) 846-5224. E-mail: jhiggins@mail .nih.gov.
䌤Published ahead of print on 29 August 2007.
1342
on August 17, 2020 by guest
http://cvi.asm.org/
MATERIALS AND METHODS
Immunophenotyping of peripheral blood drawn in EDTA was performed
4 h after blood was drawn from 25 HIV⫹patients according to manufacturer’s
instructions using a modification of CDC guidelines. The BD Trucount sin-gle-platform protocol (BD Trucount tubes; catalog no. 340334; BD Bio-sciences, San Jose, CA) and a standard, dual-platform, flow cytometry pro-tocol were compared. Samples from all patients were stained by both methods.
For the dual-platform protocol, whole-blood samples (100l per tube) were
stained with the recommended 20l of antibody cocktail (Table 1) according to
the manufacturer’s instructions using a modification of the CDC guidelines (2, 11). After staining, cells were lysed with Optilyse C (Beckman Coulter, Hialeah,
FL), washed twice, and resuspended in 500l of phosphate-buffered saline
(Quality Biological, Inc.). The samples were analyzed immediately on a BD FACSCanto flow cytometer (Becton Dickinson, CA).
For the single-platform protocol, whole-blood samples were stained in
dupli-cate (50l per tube) according to the manufacturer’s instructions for BD
Tru-count tubes (BD TruTru-count tubes; catalog no. 340334; BD Biosciences, San Jose, CA) (5). After staining, cells were lysed with BD FACSLyse (BD Biosciences, San Jose, CA) for 15 min in the dark at room temperature. No washes were required.
Flow cytometric analysis was performed on a BD FACSCanto (BD
Bio-sciences Immunocytometry Systems, San Jose, CA). The cytometer is equipped with solid-state 488-nm and HeNe 633-nm lasers.
For the flow cytometric analysis, four-color antibody crosses 1 to 3 (Table 1) were set on a dot plot for SSC versus CD45 peridinin chlorophyll protein (PerCP) gating on the lymphocytes (Fig. 1). Crosses 4 through 9 (refer to Table 1) were set on a dot plot for SSC versus CD3 PerCP gating on the CD3 population (Fig. 2). All values for four-color antibody crosses 5 through 9 are expressed as percentages of CD3, CD4, or CD8 cells expressing the respective markers.
To determine absolute counts using the dual-platform method, the white
blood count (103/l) is multiplied by 1,000 and multiplied by the percentage of
lymphocytes of the patient to obtain the absolute lymphocyte count. The abso-lute lymphocyte count is multiplied by the percentage of the subpopulation testing positive. The white blood cell count and the percentage of lymphocytes were obtained from an Abbott CELL-DYN 3500R (Abbott Park, IL). The same
FIG. 1. Four-color antibody crosses 1 to 3 for flow cytometric anal-ysis. Crosses 1 to 3 were set on a dot plot for SSC versus CD45 PerCP gating on the lymphocytes.
FIG. 2. Four-color antibody crosses 5 through 9 for flow cytometric analysis. Crosses 4 through 9 were set on a dot plot for SSC versus CD3 PerCP gating on the CD3 population.
FIG. 3. Four-color antibody crosses 1 to 3 for flow cytometric anal-ysis. Crosses 1 to 3 were set on a dot plot for SSC versus CD45 PerCP gating on the lymphocytes.
TABLE 1. Four-color antibodies by manufacturer
Four-color antibody Manufacturer
CD3 FITC/CD14 PE/CD45 PerCP/IgG1 APC ...BD Pharmingen Custom CD3 FITC/CD8 PE/CD45 PerCP/CD4 APC ...BD Multitest CD3 FITC/CD1656 PE/CD45 PerCP/CD19 APC ...BD Multitest IgG1 FITC/IgG2a PE/CD3 PerCP/IgG2a APC ...BD Pharmingen
Custom HLA-DR FITC/CD38 PE/CD3 PerCP/CD4 APC...BD Pharmingen
Custom HLA-DR FITC/CD38 PE/CD3 PerCP/CD8 APC...BD Pharmingen
Custom CD4 FITC/CD25 PE/CD3 PerCP/CD8 APC ...BD Pharmingen
Custom CD27 FITC/CD45RO PE/CD3 PerCP/CD4 APC...BD Pharmingen
Custom CD27 FITC/CD45RO PE/CD3 PerCP/CD8 APC...BD Pharmingen
Custom
on August 17, 2020 by guest
http://cvi.asm.org/
EDTA tube was used for both the hematology and the flow cytometric measure-ments.
For the single-platform analysis (Fig. 3), the absolute count was calculated
by the following formula: (number of events in region containing cell⫻
number of beads per test)/(number of events in absolute count bead region⫻
test volume). The number of beads per test was provided by the manufacturer
and might vary from lot to lot. The test volume was 50l, as indicated in the
procedure.
Statistical analysis was performed using GraphPad InStat (version 3.05),
GraphPad Prism (version 5), and Microsoft Excel 2000 software. The pairedt
test was analyzed using the InStat software to compare the mean subpopulation
percentages (n⫽25) of the dual platform and the single platform. Linear
regression was analyzed on the Excel software to measure the linear relationship between the means from the two methods. The Wilcoxon rank sum test (a nonparametric statistical test) was also used to compare the median differences from single versus dual platforms.
RESULTS
The results shown in Table 2 demonstrate very good corre-lation in the lymphosum crosses (CD3, CD4, CD8, CD19, and CD1656) (Fig. 4). However, in the activation markers, there is very poor correlation, as evidenced in the DR, CD25, and CD38 crosses (Fig. 5). Other lymphocyte subsets, such as CD45RO, also exhibit poor correlation between DPT and SPT. These differences may be attributed to the hematology analyzer, bead aggregation, and/or incomplete red blood cell lysis with the BD FACSLyse. Both bead aggregation and lysed red cells were observed on FSC-versus-SSC plots and on CD3-versus-SSC plots on the majority of the samples, with the
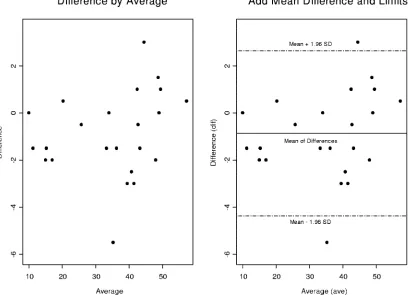
FIG. 4. Bland-Altman plots of CD4 percentages (biologically meaningful AIDS biomarker according to the CDC) for a dual platform versus a single platform. We constructed a detection outlier mechanism by drawing a 95% confidence interval above and below the mean differences, implying that 95% of the data points fall within this interval. However there are two heavy outliers that fall above or below 2 standard deviations. We will later demonstrate the impact of these outliers on our statistical significance and their precision.
TABLE 2. Results for dual- versus single-platform technology (n⫽25)
Lymphocyte subset parameter
Mean value for:
r Pvalue
DPT SPT Differencea
% CD3 79 79 0 0.989 0.1344
CD3 absolute count 967 784 ⫺183 0.988 ⬍0.0001
% CD4 35 34 ⫺1 0.986 0.0541
CD4 absolute count 708 578 ⫺130 0.96 0.0001
% CD8 43 43 0 0.989 0.8649
CD8 absolute count 967 784 ⫺183 0.978 0.0011
% CD19 11 11 0 0.991 0.6274
% CD1656 9 9 0 0.907 0.7971
% CD4⫹CD45RO⫺ 25 34 9 0.524 0.0016
% CD4⫹CD45RO⫹ 59 66 7 0.542 0.0396
% CD8⫹CD45RO⫺ 29 45 16 0.314 0.0002
% CD8⫹CD45RO⫹ 48 55 7 0.6222 0.0992
% CD3⫹CD38⫹HLA-DR⫹ 18 18 0 0.825 0.9828
% CD3⫹HLA-DR⫹ 24 20 ⫺4 0.921 0.001
% CD3⫹CD38⫹ 57 48 ⫺9 0.8 0.0004
% CD4⫹CD38⫹HLA-DR⫹ 12 13 1 0.459 0.5614
% CD4⫹HLA-DR⫹ 10 16 6 0.441 0.0026
% CD4⫹CD38⫹ 47 59 12 0.357 0.0127
% CD8⫹CD38⫹HLA-DR⫹ 24 21 ⫺3 0.811 0.1481
% CD8⫹HLA-DR⫹ 28 21 ⫺7 0.666 0.0138
% CD8⫹CD38⫹ 44 45 1 0.757 0.7843
% CD3⫹CD25⫹ 23 16 ⫺7 0.464 0.0082
% CD4⫹CD25⫹ 33 35 2 0.232 0.7033
% CD8⫹CD25⫹ 7 11 4 0.465 0.0921
% CD4⫹naı¨ve 27 30 3 0.759 0.0369
% CD4⫹memory 73 70 ⫺3 0.749 0.0369
% CD8⫹naı¨ve 25 25 0 0.979 0.7603
% CD8⫹memory 76 75 ⫺1 0.974 0.29
aThe SPT value⫺the DPT value.
on August 17, 2020 by guest
http://cvi.asm.org/
exception being the lymphosum crosses (CD3 fluorescein iso-thiocyanate [FITC]/CD14 phycoerythrin [PE]/CD45 PerCP/ immunoglobulin G1 [IgG1] allophycocyanin [APC], CD3 FITC/CD8 PE/CD45 PerCP/CD4 APC, and CD3 FITC/ CD1656 PE/CD45 PerCP/CD19 APC). Additionally, for the DPT method, washing may have contributed to selective loss of certain cell populations in the activation markers.
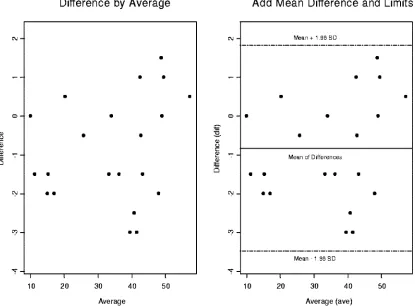
Bland-Altman plots were used to compare the two platforms (1). CD4 and CD8 percentages were compared by using Bland-Altman plots in Fig. 4 through 7. In these plots, the averages of CD4 and CD8 percentages are shown against the differences between them. Most of the data points fall within 2 standard deviations of the mean. In Fig. 4, there are two heavy outliers above the mean plus 2 standard deviations. When these outliers are removed (Fig. 5), the rest of the CD4 per-centages are within 2 standard deviations of the mean. The 95% confidence interval in Fig. 5 is very narrow, indicating that all statistical inferences made regarding CD4 percentages on a single platform are very reliable.
We performed a linear mixed-effects model to analyze inter- and intravariations of the two assays, dual versus single platform, for the 25 patients whose HIV⫹biomarkers are investigated on a single-platform technology for lympho-cyte immunophenotyping. The biostatistical technique is a lin-ear mixed-effects model fitted by the restricted maximum like-lihood estimators using S-Plus 2000 to conduct the appropriate analyses (7).
The null hypothesis indicates that the log likelihood function has the smallest value compared to the Akaki information criterion and the Bayesian information criterion. The standard error of estimate for the dual platform is very small (0.0376), meaning that reliable and accurate confidence intervals can be constructed. The t statistic for the DPT CD4 percentage is 27.234. Its corresponding P value is less than 0.0001, which means that the dual-platform coefficient is highly statistically significant and a very meaningful HIV⫹biomarker in this re-search study.
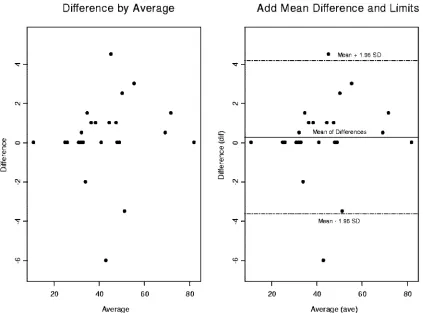
In Fig. 6, two side-by-side Bland-Altman plots are depicted for the CD8 percentages comparing DPT and SPT. On the right side of the graph is the 95% confidence interval. Two outliers fall outside 2 standard deviations above and below the mean. Figure 7 shows the CD8 percentages with the outliers removed to access the impact on the precision and the accu-racy of the statistical inferences drawn from our statistical analyses.
We used a linear mixed-effects biostatistical model to ana-lyze the CD8 HIV⫹biomarker patient population data set. To be more specific, a restricted maximum likelihood estimation technique is used to find the best statistical fit. Assuming that the null hypothesis is not rejected, the log likelihood func-tion provides the best fit among the Akaki informafunc-tion cri-terion, the Bayesian information cricri-terion, and the log like-lihood function. The log likelike-lihood has the smallest value (⫺41.64567).
FIG. 5. Two side-by-side Bland-Altman plots for CD4 percentages comparing dual versus single platforms. We have removed two outliers above and below 2 standard deviations from the mean. We have explained the statistical significance of this in the text.
on August 17, 2020 by guest
http://cvi.asm.org/
This represents the best statistical fit for the CD8 patient population (n ⫽ 25) data set. The tstatistic associated with CD8 is 42.20383. This result is highly statistically significant with aPvalue of⬍0.0001.
CD4 activation markers (CD4⫹HLA-DR⫹, CD4⫹CD25⫹, and CD4⫹ CD38⫹) were compared by both methods. The statistical inferences made from the CD4⫹HLA-DR⫹markers on a single platform are less reliable, and the variance (dis-crepancy,⫺12.90) associated with it is substantially larger than that associated with the CD4⫹HLA-DR⫹markers on a dual platform (discrepancy, ⫺6.90). The discrepancy for CD4⫹ CD25⫹percentages on a dual platform (discrepancy,⫺26.90) is statistically significantly smaller than the variance for CD4⫹ CD25⫹percentages on a single platform (discrepancy,⫺31.90) at an␣level of 0.10 significance using the two-sampletstatistic and the Wilcoxon rank sum test.
For the CD4⫹CD38⫹markers, the 50th percentile of CD4⫹ CD38⫹percentages on a dual platform (median, 42) is statis-tically significantly different at an␣level of 0.10 than the 50th percentile of CD4⫹CD38⫹percentages on a single platform (median, 60).
The comparison of the CD4-naı¨ve cells (CD4⫹CD45RO⫺ CD27⫹) is not statistically significantly different between the two methods. The CD4 memory cells (CD4⫹ CD45RO⫹ CD27⫺) on the DPT (median ⫽74) are not statistically
sig-nificantly different from the CD4 memory cells from the SPT (median⫽73).
Regression statistics reported in Table 3 indicate that the results for the percentages of the CD4⫹, CD4-naı¨ve, and CD4 memory cells are substantially equivalent between the 25 sam-ples stained in duplicate for the SPT assay. However, the re-sults for CD4⫹HLA-DR⫹, CD4⫹CD25⫹, CD4⫹CD38⫹, and CD4⫹CD38⫹HLA-DR⫹cells are not equal.
Poor resolution for the gating for CD3 versus SSC made gating a challenge. This challenge may be attributed to the patients being on immunosuppressive therapy (6). The within-sample reproducibility values among the 25 within-samples stained in duplicate for the SPT are shown in Table 4. The means and the standard deviations for the subset percentages for the CD4⫹ cells are included in the table. The mean absolute CD4⫹cell count between the duplicates of the SPT was 576. The percent coefficient of variation was 9.1%.
DISCUSSION
SPT precision can be achieved, however, only within the strict limitations of the procedure. Samples must be well mixed, and sample pipetting must be very precise, requiring the use of automated reverse pipetting devices. Because of the presence of a measured number of beads in each tube,
FIG. 6. Two side-by-side Bland-Altman graphs for the CD8 percentages comparing dual versus single platforms. We have constructed a 95% confidence interval on the right-hand graph. There are two observations that fall outside 2 standard deviations above and below the mean. We will remove them to access their impact on the precision and accuracy of statistical inferences that are drawn from our statistical analyses.
on August 17, 2020 by guest
http://cvi.asm.org/
the samples cannot be washed after staining and lysis. Wash-ing would result in a loss of beads and a possible loss of certain cell populations. These losses would not be uniform across all of the tubes. The resulting debris can interfere with flow anal-ysis. This could be resolved by selecting a brighter fluoro-chrome than CD3 PerCP. Interfering substances in plasma are also present in certain samples. In DPT, sample volume is not a critical measurement, and the plasma can be removed by washing the samples before staining. Since this cannot be car-ried out using SPT, there will be samples that will not yield to analysis and reanalysis using DPT will become necessary.
The results of this study of the two methods showed very good correlation for CD4 and CD8 measurements. However,
poor correlation for the activation markers and other lympho-cyte subsets was observed. This result could be attributed to the poor resolution observed in the CD3 versus SSC popula-tions for some of the patients. The fact that these HIV⫹ pa-tients were on immunosuppressive therapy would account for the lack of correlation in the activation markers. It has been documented in the literature that whole-blood samples from patients on immunosuppressive drugs can yield poor resolution (6). Therefore, there would be no overall advan-tage to switching to SPT, unless a need to analyze EDTA samples that are more than 30 h old is required. For acti-vation markers of HIV⫹ patients on immunosuppressive therapy, we would prefer DPT over SPT to eliminate the
FIG. 7. Two side-by-side Bland-Altman graphs for CD8 percentages comparing the dual versus single platforms. We have removed two outliers that have fallen outside the 95% confidence interval depicted by dashed lines above and below the mean of differences. We investigated the impact of outlier removal on the precision and reliability of statistical inferences drawn from the CD8 patient population data set.
TABLE 3. Regression analysisa
Lymphocyte subset
parameter R Slope Intercept Range
% CD4 0.9849 0.9848 0.09078 10–58
% CD4⫹HLA-DR⫹ 0.6627 0.8522 3.593 7–46 % CD4⫹CD25⫹ 0.1075 0.3356 27.92 10–77 % CD4⫹CD38⫹ 0.3995 0.8659 9.949 25–86 % CD4⫹CD38⫹
HLA-DR⫹
0.6587 0.8782 1.372 3–38
% CD4 naı¨ve 0.812 1.008 ⫺1.628 8–45
% CD4 memory 0.8564 1.033 ⫺1.359 55–92
anwas 25 samples for the SPT (samples were stained in duplicate).
TABLE 4. Within-specimen reproducibility of subset percentagesa
Lymphocyte subset
parameter Mean SD
% CD4 35 13.6
% CD4⫹HLA-DR⫹ 17 8.7
% CD4⫹CD25⫹ 37 9.1
% CD4⫹CD38⫹ 61 13.3
% CD4⫹CD38⫹ HLA-DR⫹
37 4.02
% CD4 naı¨ve 29 10.6
% CD4 memory 70 9.9
anwas 22 samples for the SPT (samples were stained in duplicate).
on August 17, 2020 by guest
http://cvi.asm.org/
poor resolution and the interfering immunoglobulins found in the plasma.
ACKNOWLEDGMENTS
This project has been funded in whole or in part with federal funds from the National Cancer Institute, National Institutes of Health, under contract no. NO1-CO-12400.
The content of this publication does not necessarily reflect the views or policies of the Department of Health and Human Services, nor does mention of trade names, commercial products, or organization imply endorsement by the U.S. government.
REFERENCES
1.Altman, D. G., and J. M. Bland.1983. Measurement in medicine: the analysis
of method comparison studies. Statistician32:307–317.
2.CDC.1997. 1997 Revised guidelines for the performance of CD4⫹T-cell
determination in persons with human immunodeficiency (HIV) infection.
Morb. Mortal. Wkly. Rep.46:1–29.
3.CDC.2002. Guidelines for the preventing opportunistic infections among
HIV-infected persons—2002. Morb. Mortal. Wkly. Rep.51:1–46.
4.CDC.2002. Guidelines for using antiretroviral agents among HIV-infected
adults and adolescents, 2002. Morb. Mortal. Wkly. Rep.51:1–71.
5.CDC.2003. Guidelines for performing single-platform CD4⫹T-cell
deter-minations with CD45 gating for persons infected with human
immunodefi-ciency (HIV) infection, 2003. Morb. Mortal. Wkly. Rep.52:1–13.
6.Giorgi, J. V.1986. Lymphocyte subset measurements: significance in clinical
medicine, p. 236–246.InN. R. Rose, H. Friedman, and J. L. Fahey (ed.),
Manual of clinical laboratory immunology, 3rd ed. American Society for Microbiology Washington, DC.
7.Hollander, M., and D. A. Wolfe.1999. Nonparametric statistical methods, 2nd ed. Wiley series in probability and statistics. John Wiley & Sons, New York, NY.
8.National Committee for Clinical Laboratory Standards.1989. Clinical applications for flow cytometry: quality assurance and immunophenotyp-ing of peripheral blood lymphocytes. Proposed guideline. NCCLS docu-ment H42-P. National Committee for Clinical Laboratory Standards, Villanova, PA.
9.Reimann, K. A., M. R. G. O’Gorman, J. Spritzler, C. L. Wilkening, D. E. Sabath, K. Helm, D. E. Campbell, and the NIAID DAIDS New Technologies Evaluation Group.2000. Multisite comparison of CD4 and CD8 T-lympho-cyte counting by single- versus multiple-platform methodologies: evaluation of Beckman Coulter Flow-Count fluorospheres and the tetraONE system.
Clin. Diagn. Lab. Immunol.7:344–351.
10.Schnizlein-Bick, C. T., J. Spritzler, C. L. Wilkening, J. K. A. Nicholson, M. R. G. O’Gorman, Site Investigators, and the NIAID DAIDS New Technologies Evaluation Group.2000. Evaluation of TruCount absolute-count tubes for determining CD4 and CD8 cell numbers in human
im-munodeficiency virus-positive adults. Clin. Diagn. Lab. Immunol.7:336–
343.
11.Stevens, R. A., R. A. Lempicki, V. Natarajan, J. Higgins, J. W. Adelsberger, and J. A. Metcalf.2006. General immunologic evaluation of patients with
human immunodeficiency virus infection, p. 847–861.InB. R. Detrick, G.
Hamilton, and J. D. Folds (ed.), Manual of molecular and clinical laboratory immunology, 7th ed. ASM Press, Washington, DC.