COMPARISONS OF AD LZBZTUM AND RESTRICTED FEEDING OF MICE SELECTED AND UNSELECTED FOR POSTWEANING
GAIN. 11. CARCASS COMPOSITION AND ENERGETIC EFFICIENCY’
V. M. TIMON2, E. J. EISEN AND J. M. LEATHERWOOD
Animal Science Department, North Carolina State University, Raleigh
Received July 14, 1969
FFECTIVE selection for increased weight gain inevitably results in a
E
genetically controlled change in deposition rate for some or all of the body components, principally protein, ether extract, water and ash. Pertinent to a n understanding of the genetics of growth is the effect selection for growth rate has on tissue composition. FOWLER (1958) found that selection for increased six-week body weight in mice increased rate of fat deposition, whereas selection for low six-week weight reduced the proportion of fat in the carcass. On the other hand, LANG and LEGATES (1969) found no changes in percentage body composition in lines of mice selected for high and low six-week weight. The size of changes in carcass composition found by FOWLER (1958) depended on the stage of growth at which carcasses were analyzed and the origin o l the selected stocks. This latter point is supported by BIONDINI, SUTHERLAND and HAVERLAND (1968), who noted different changes in carcass composition among three lines selected for postwean- ing gain.The present study was designed to measure correlated genetic changes in car- cass composition resulting from selection of mice for increased postweaning weight gain. Particular emphasis is given to percentage changes in body compo- sition of the fat-free carcass and to the effects of ad libitum versus restricted feed- ing on the expression of genetic line differences in body composition. Also in- cluded is a comparison of “energetic efficiency” between the selected and control lines. A previous report (TIMON and EISEN 1970) presented comparisons of feed consumption, weight gain and feed efficiency between the lines.
MATERIALS A N D METHODS
Progeny were from a line selected for nine generations for high postweaning weight gain from 21 to 42 days of age and a random control line originating from the same base population. Selected and unselected lines, hereafter referred to as High and Control, respectively, were fed either ad libitum or restricted from weaning (21 days) to 57 days of age. The litters were paired within sex on the basis of body weight at weaning to form 27 blocks, each block consisting of 2
1Paptr No. 2923 of the Journal series of the North Carolina State University Agricultural Experimental Station, Raleigh, North Carolina. This research was supported in part by Public Health Service Research Grant GM 11546. Computing services were supported by NIH Grant FR-oOOt 1 .
2 Present address: The Agricultural Institute, Dunsinea, Castleknock, Dublin, Ireland.
146 V. M . TIMON, E. J . EISEN AND J . M. LEATHERWOOD
TABLE 1
Number of mice in each subclass
Feeding regime
Sex Line Ad libitum Restricted
Males High
Females High
Control
Control
25 18
29 21
26 25
27 25
High ad libitum, 2 High restricted, 2 Control ad libitum and 2 Control restricted mice. The High
restricted mice were limited to a feed intake based on (body weight) 314 equivalent to that con- sumed by the paired Control ad Zibilum mice. Feed intake per unit body weight for a Control restricted mouse was calculated as CA (HR/HA4), where CA, H, and HA represent the feed intake per gram (body weight)3/4 for the Control ad libitum, High restricted and High ad libitum
mice, respectively, within each block. A detailed description of the expeltimental proceduw was presented by TIMON and EISEN (1970).
Carcass preparation and chemical analysis: Each mouse was killed by ether when 57 days old; head, feet and tail were removed and the body was skinned and eviscerated. Each carcass, after weighing, was stored in individual polyethylene bags at -18°C. The frozen carcass was dried by lyophilizing for 70 hours. Percentage moisture was calculated from fresh and dry carcass weights. The dry carcass was ground with four grams of ashed Celite 545 (John Mansville, New York) in a mechanical mortar (The Torsion Balance Company, Clifton, New Jersey). Total nitro- gen was determined by the Kjeldahl procedure on one gram of ground sample. Protein was esti- mated as the total nitrogen times 6.25. Ether extract was determined for one gram of ground sample by means of'kxtraction with anhydrous diethyl ether on a Pickel Extractor for 16 hours. Ash weight was determined as the difference between the tissue portion of the sample before and after ashing at 450°C for 15 hours and at 600°C for two hours.
Statistical analysis: The distribution of the data by line-sex-treatment subclasses is shown in
TABLE 2
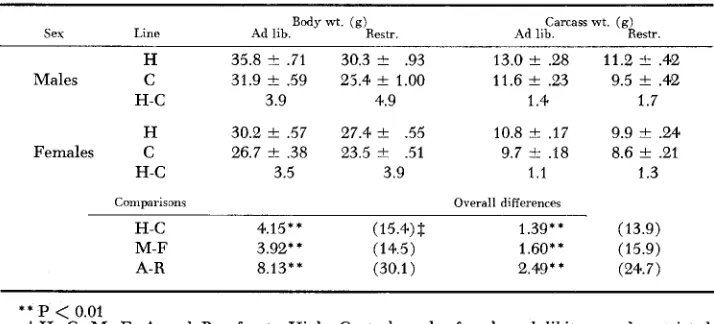
Means and differences between lines (H-C), sexes (M-F) and feeding regimes ( A - R )
in body weight and carcass weight+
Body wt. ( 9 ) Carcass wt. (9)
Sex Line Ad lib. Restr. Ad lib. Restr.
H 35.8 f .71 30.3
*
.93 13.0 rt .28 11.2*
.42 Males C 31.9 2 .59 25.4 f 1.00 11.6 f .23 9.5 rt .42H-C 3.9 4.9 1.4 1.7
H 30.2 & .57 27.4 rt .55 10.8 f .I7 9.9 f .24 Females C 26.7 rt .38 23.5 f .51 9.7 i. .I8 8.6 f .2l
H-C 3.5 3.9 1.1 1.3
Comparisons Overall differences
H-C 4.15** (15.4)$ 1.39** (13.9)
M-F 3.92** (14.5) 1.60** (15.9)
A-R 8.13"' (30.1) 2.49* * (24.7)
* * P
<
0.01j-H, C, M, F, A and R refer to High, Control, male, female, ad libitum and restricted,
EFFICIENCY O F SELECTED MICE 147 Table 1. Because of the nonorthogonality in the data all analyses were computed by a general least-squares procedure (HARVEY 1960). The linear model fitted to the overall data was:
Y i j k i r n = ~ + B i + L j $ S , + T ~ + ( B L ) i j + (BS)i,+ ( W i z
+
W)j,+
(LT)j,+
(ST),,+
eij,zrn 7where Y i j k z r n = an observation on the mth mouse in the i j k l t h subclass, p =population mean, Bi = fixed effect of the i t h block (i = 1 , .
.
. , 27), Lj = fixed effect of the jth line (i = 1,2), S, = fixed effect of the k t h sex (k == 1,2), T , = fixed effect of the I t h feeding regime (I = 1,2), (BL)ii, (BS)+,, (BT)i,, ( L S ) i k , (LT)iz, (ST),, =respective two-way interaction effects andeijlczm = random error assumed N (0,aZ).
RESULTS
Tissue weights: The means and comparisons of protein, ether extract, water, ash, carcass and body weights are summarized in Tables 2 and 3. On the average, the High line was significantly
(P
<
0.01 ) larger than Controls i n body weight, carcass weight and its measured components. These line differences were more pronounced in the restricted-fed group for protein and water weight. Weights of protein, ether extract and water were significantly (P<
0.01) greater in malesthan in females. Although male mice had a greater absolute ash weight than females, the difference was not statistically significant. The effect of feed restric- tion was to reduce the absolute weights of all components of the carcass.
The analyses of variance revealed some significant interactions in the com- ponents of carcass weights which also are apparent from the subclass means pre- sented in Table 3. For example, the High minus Control difference in ether ex- tract weight was larger in males than females, whick resulted in a significant
(P
<
0.05) line by sex interaction. However, interactions involving absolute tis-sue weights are not very meaningful because of the large differences in body weight between lines, sexes and feeding regimes and the high positive correlation between body weight and carcass tissue weights. When the tissue data were re- analyzed using body weight as a covariate, some of the differences observed in main effects and interactions were no longer significant. The subsequent analyses of the carcass components on a percentage basis concur with this result.
148 V. M . TIMON, E. J . EISEN A N D J. M. LEATHERWOOD
h
v M
.U 3
5
n M v U $4 U 33
n M v U U 3s
!$5
U $4 W n M v U 3 E d U 0 PI m +I CO 0 9 ? 4 +I N 0 9s
0 m +I CO m w In +I CO I-1
0: In +I CO W 0 9 W +I CO F- 0 9 CO +I N CO rl 9 U +I W N 9 1 U In 0 9 F- 0 9 m d 9 In W 0 CO N 0 rl 0 ? m N 0 m N 0 U::
rl +I m 0 9 ? d +I W 0 9 ? U-l +I m w1
Q! rl +I CO I-1
N W +I CO F- 0 9 U +I F- 0 9 m In +I W rl 9 "0. 9 +I 0 N 9 X 4 +I In m 0 9 d +I rl 0 9 ? In +I U In 1 "9 m +I N W Wfl
m +I m U-l 0 9 N +I 9 ? m 0*
+I U W rl 9 U +I U 4 9 m U m CO 0 9 In 0 9*
I-O W 0 '9 m -? 0 0 N 0 N N 0 W 0
1
U i n*
4 '9 v*
W 0 9 n W rl rl v*
*
F- 0 m n m W m v*
*
F- N 0*
n m N d v*
*
m N 0 U&
n nU rl 0
w v
9 Q :
*
*
N I n
0 0
9 9
n n
I n I n
? N
S C :
U *
*
*
U t 44 4
9 ' 1
n n
U - l m
C O N
N N
v v
. .
*
*
r l I -*
N r l
0
. .
0n n
m w
I n d
. .
3 s
*
*
U*
N U
0 0
m r l
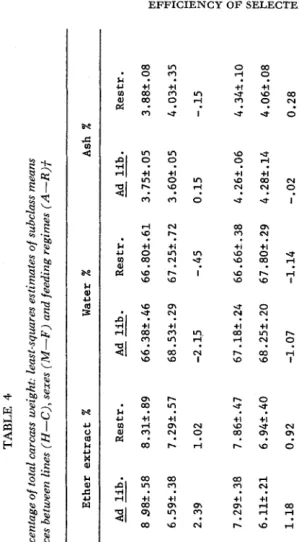
TABLE 4 Carcass components as a percentage of total carcass weight: least-squares estimates of subclass means and of the overall diflerences between lines (H-C), sexes (M-F) and feeding regimes (A-R)f Protein % Ether extract X Water X ~~ Sex Line Restr. Ad lib. Restr. Ad lib. Restr. Restr. Ad lib. Ad lib.
--
I---
--
M v
H 18.47T.23 18.89t.27 8 98t.58 8.31t.89 66.38t.46 66.802.61 3.75t.05 3.88t.08 Males C 18.61t.25 19.10t.26 6.59t.38 7.29k.57 68.532.29 67.25k.72 3.60t.05 4.03k.35
2
il
3
H-C -.A4 -.21 2.39 1.02 -2.15 -.45 0.15 -.15
rc 0
H 18.48t.19 18.82t.19 7.29t.38 7.862.47 67.18t.24 66.662.38 4.262.06 4.345.10
r
2
1.18 0.92 -1.07 -1.14 -.02 0.28
F1
l+ M n U
150 V. M . TIMON, E. J. EISEN AND J. M. LEATHERWOOD t f
z
P4 P4 1 n W !& 0 0 rl V n al a, ry U m W x V2
n al $4 ry I U m W w & U Vs
n a & ry I U m 'U w I2 d U 0 PI v $4 U md
a<I
& U md
5<I
U U md
a<I
& U 10d
a<I
al d 4 X v1 m rl +Ifl
'9 m rl rl U F- +I 0 0 rl '9 m +I m m U 9 W +I U N U 9 CO +I 00 U F-fl
"! rl ri +I N U F- 0: CO rl +I CO rl N 9 0 ri +I U CO 0 N La U F- +I In m rl 9 N +I m m rl "!fl
0 +I U Wv
m +I W m 9 m rl W +I \f m e r . rl N +I m In F- "! U N +I 0 N rl N m ri +I 0 m 0 N U m a N rlv
m "! N rl m I m N 0 U N 0 rl W I N Ifl
e m
0 U
A
m "! +I N rl N rl 0 +I 0 N rl "! 9 rl +I m Ufl
m.
r- +I U b e 9 0 N +I N N*
F- m rl +I rl r. U F- In rl +I rT) 0 N m W +I In ulfl
::
X PI "! +I 00 r- m rl r . +I W U rl N. 9 m +I W U 9 9 In +I r- W*
fl
m N +I F- In U r- m rl +I CO In e r- U N +I W m 0 N N rl +I.PI !-I 0
N
U
m
3
Er,W W rl W W rl r- 0 ? F- 0 9 In m I m 0
fl
rl I 9 0 N I UA
m a,B
0 W w d a rl rl $40 !?
m
g
Y
rl a E U n h) m rl V -x rl F- rl n U 9 v r- 0fl
h m 0 v rl N I+l- n
N
0
v
EFFICIENCY O F SELECTED MICE 151
than their female counterparts. The lower percent ash in male mice is perhaps a reflection of the stage of physiological maturity of males relative to females.
No
significant sex differences were observed for either percent protein or percent water. There were no significant differences between the restricted- and ad Zibitum-fed mice in percent composition of any of the carcass components meas- ured.
Composition of the fat-free carcass: The percent chemical composition of the carcass was calculated on a fat-free basis to remove the variation in fat percentage on the remaining carcass components. The analyses of the chemical components of the fat-free carcass are summarized in Table 5. There was no difference be- tween the High and Control lines in any of the components of the fat-free carcass. The differences between male and female mice were also small for all of the fat- free components except percent ash which was significantly (P
<
0.01) lower in males than in females.Also included in Table 5 are the means of a composite trait, the difference in the weights of protein and ether extract as a percentage of fat-free carcass weight
[ 100 (P
-
E)/FFCW]. This trait is included as an index of stage of physiological maturity. The patterns of tissue growth in mammals as elucidated byHAMMOND
(1932) suggest that the more mature animals will have lower values of this index. Based on this interpretation the results in Table 5 suggest that, on the average, mice of the High line were 13.2% more mature at 57 days of age than the Con- trols. Males were significantly more mature than females at 57 days, whereas the difference between ad Libitum and restricted mice was not statistically significant. Comparison of the “energetic eficiency” of High and Control mice: An earlier study (TIMON and EISEN 1970) showed that mice from the High line were more efficient than Controls, as measured by unit of weight gain per unit of feed con- sumed. Line comparisons in feed efficiency defined in this way are not very mean- ingful in terms of utilization of energy when differences in body composition exist between lines. Line differences in average body weight and the resulting differ- ences in maintenance requirements also prohibit any interpretation of gross ef- ficiency (gain/feed) in terms of net efkiency of tissue growth. To evaluate dif- ferences in efficiency of tissue growth. the gains in body weight accounted for by protein and ether extract were transformed to an energy basis. Energy intake also was computed on the basis of the chemical analysis of the ration. In these conversions, it was assumed that the combustible energy values of carbohydrates, proteins and fats were 4.00, 5.65 and 9.45 kcal/g, respectively (WIDDOWSON
152 V. M. TIMON, E. J. EISEN A N D J. M. LEATHERWOOD
1962). Efficiency of protein and ether extract gains were then defined as weight
of tissue/energy available for growth. These traits were studied only in the ad
libitum group since some mice in the restricted group lost weight over different age intervals.
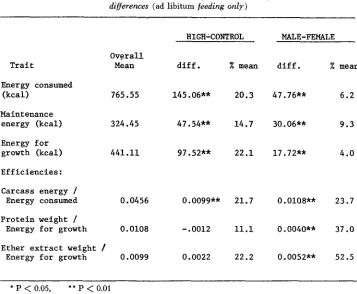
The differences in total energy consumed between the High and Control lines and between males and females shown in Table 6 reflect the results for average daily feed consumption (TIMON and EISEN 1970). However, the differences in maintenance energy and energy available for growth need to be considered in that they contrast with the nature of the differences in feed consumption between lines and sexes. Approximately 63% of the feed consumption of the male mice that was greater than the feed consumption of the female mice can be attributed to maintenance. I n contrast, only 33% of the feed consumption of the High line that was greater than the feed consumption of the Control line can be attributed to maintenance. Therefore, a relatively greater amount of energy was available for growth. These calculations further show that selection has increased feed con- sumption above that expected from the associated increase in body weight.
The differences in efficiency presented in Table 6 depend on the particular index studied. “Energetic efficiency” (carcass energy/energy consumed) was
TABLE 6
Energy consumption and utilizatiom least-squares estimates of line and sex differences (ad libitum feeding only)
HIGH-CONTROL MALE-FEMALE
Trait
Overall
Mean
a m .
X mean d i f f .Energy consumed
(kcal) 765.55 145.06** 20.3 47.76**
Maintenance
energy (kcal) 324.45 47.54** 14.7 30.06**
Energy f o r
growth (kcal) 441.11 97.52** 22.1 17.72**
E f f i c i e n c i e s :
Carcass energy I
Energy consumed 0.0456 0.0099** 21.7 0.0108**
Protein weight 1
Energy f o r growth 0.0108
-
.0012 11.1 0.0040**Ether extract weight /
Energy for growth 0.0099 0.0022 22.2 0.0052**
% mean
6.2
9.3
4.0
23.7
37 .o
52.5
EFFICIENCY O F SELECTED MICE 153 markedly greater in the High line relative to Controls
(P
<
0.01) and greater in males than in females (P<
0.01). These differences in efficiency were more pronounced than the earlier results have indicated ( TIMON and EISEN 1970) and are a reflection of the increased ether extract fraction in the High line. However, when adjustment for maintenance differences is considered (i.e., efficiencies based on energy available for growth), the results suggest that there is no significant(P
>
0.05) difference between High and Control mice either in the efficiency ofprotein or ether extract deposition. I n contrast to the line comparison, males were
37% more efficient than females in protein growth (P
<
0.01) and 52% more efficient in deposition of ether extract ( P < 0.01).DISCUSSION
The results of this study indicate that selection for increased postweaning weight gain from 21 to 42 days of age in mice lead to a positive correlated change in the absolute weights of all measured carcass components (protein, ether ex- tract, ash and water). When tissue weights were expressed as a percent of carcass weight, percent ether extract was shown to increase in the High line compared to the Control. Percent water was decreased in the High line to approximately the same extent as percent ether extract was increased. This result is similar to the report of FOWLER (1 962), but LANG and LEGATES (1 969) reported that selec- tion for high six-week weight caused little change in percent ether extract. Strain differences in correlated responses in body tissue growth were evident in the study of BIONDINI, SUTHERLAND and HAVERLAND (1968), since two of the lines of mice selected for increased growth rate showed a marked increase in fat deposition and a third line showed no difference compared to the control.
Despite the difference in percent fat between the High and Control lines, there was no difference between lines in percent protein or percent ash. When the tissue components were expressed as a percent of the fat-free carcass, there were no differences in any of the components of the carcass.
A similar result can be seen in FOWLER’S (1958) data, though the author did not express the results on a fat-free carcass basis. These results emphasize the importance of considering fat deposition when interpreting proportionate changes in tissue growth. If, as in this study and in FOWLER’S (1958) comparisons, the relative growth rate in one tissue only (e.g., fat) is altered, this will automatically change the relative proportions of the remaining carcass tissues.
The effect of increased fat deposition on percent protein is noted in a study of body composition of rats selected for high efficiency of food utilization (PALMER
154 V. M. TIMON, E. J. EISEN A N D J. M. LEATHERWOOD
(TIMON 1968) ; ithe heritability of percent protein on a whole carcass basis was
0.51, whereas on a fat-free carcass basis this estimate was essentially zero. These results suggest that it may be very difficult to change the chemical composition of the fat-free carcass.
The marked difference between the fat (ether extract) and nonfat components (protein, water and ash) i n the response to level of feeding is interesting. The High-Control differences in the nonfat components were more fully expressed under restricted feeding, whereas the opposite was true of the ether extract com- ponent. These observations are almost certainly associated with appetite. I n an earlier paper (TIMON and EISEN 1970), it was concluded that a major correlated response of selection for postweaning weight gain i n the High line was increased appetite. Since the effect of appetite can only be expressed under ad libitum f e d - ing, it may be suggested that the increased fat content of the High line is a conse- quence of its increased food consumption capacity. This interpretation, however. does not explain why the differences between lines in the weights of protein, water and ash were more fully expressed under restricted feeding.
The “energetic efficiencies” in Table 6 support the view expressed in the pre- vious paper ( TIMON and EISEN 1970) that both maintenance requirement and composition of weight gain can markedly influence comparisons based on gross efficiency. The most striking result of these comparisons was the lack of any sig- nificant difference in the efficiency of protein or ether extract deposition when these tissues were expressed on an energy available for growth basis.
S U M M A R Y
Carcass composition of mice selected for nine generations for rapid postweaning gain (High line) were compared with randombred mice (Control line) under both ad libitum and restricted feed intake. The data, based on 196 mice, consisted of water, protein, ether extract and ash determinations on the skinned and evis- cerated carcasses at 57 days of age.-Weights of water, protein, ether extract and ash increased as a result of selection and also were greater in males than in fe- males. When weights of the components were expressed as a percentage of total carcass weight, the only differences between the two lines were that the ether extract increased and water decreased in the High line as compared to the Control line.-Feed efficiency, estimated on the basis of carcass energy, was significantly greater for the High line than for the Control mice. Tentative evidence is pre- sented to show that this difference is more a function of food consumption (ap- petite) than of any change in net efficiency of growth or maintenance.
LITERATURE CITED
BIONDINI, P. E., T. M. SUTHERLAND and L. H. HAVF.RLAND, 1968
FOWLER, R. E., 1958
Body composition of mice selected for rapid growth rate. J. Animal Sci. 27: 5-12.
The growth and carcass composition of strains of mice selected for large
and small body size. J. Agric. Sci. 51: 137-148. The efficiency of food utili-
zalion, digestibility of foodstuffs and energy expenditure of mice selected for large and small body size. Genet. Res. 3: 51-68.
EFFICIENCY O F SELECTED MICE
155
HAMMOND, J., 1932 Growth and Development of Mutton Qualities in the Sheep. Oliver and
HARVEY, W. R., 1960 Least Square Analysis of Daia. U.S.D.A. Pub. No. ARS-20-8.
KLEIBER, M., 1961 The Fire of Life: An Introduction io Animal Energetics. Wiley, New York. LANG, B. J. and J. E. LEGATES, 1969 Rate, composition and efficiency of growth in mice selected
for large and small body weight. Theoret. Appl. Genet. 39: 306314.
MITCHELL, H. H., 1962 Comparative Nutrition of Man and Domestic Animals, Vol. 1. Academic Press, New York.
PALMER, L. S., C. KENNEDY, C. E. CALVERLEY, C. Z ~ H N and P. H. WESTWIG, 1946 Genetic dif- ferences in the biochemistry and physiology influencing food utilization for growth in rats. Tech. Bull. No. 176, Univ. Minnesota Agric. Exp. Sta.
Genetic studies of growth and carcass composition in sheep. I n Growth and Development of Mammals. Edited by G . A. LODGE and G. E. LAMMING. Butterworths, Lon- don.
Comparisons of ad libitum and restricted feeding of mice selected and unselected for postweaning daily gain. I. Growth, feed consumption and feed efficiency. Genetics 64 : 41-57.
Assessment of energy value of human foods. Proc. Nutrit. Soc. 14:
142-1 54.
Boyd, Edinburgh.
TIMON, V. M., 1968
TIMON, V. M. and E. J. EISEN, 1970