20th International Conference on Structural Mechanics in Reactor Technology (SMiRT 20) Espoo, Finland, August 9-14, 2009 SMiRT 20-Division II, Paper 1831
Three Dimensional Damage Mechanics Analysis of Real Life Reactor Piping
Components under Various Loading Conditions
P.V. Durgaprasad
a, M.K. Sahu
a, and B.K. Dutta
aa
Reactor Safety Division, Bhabha Atomic Research Centre, Mumbai, INDIA. e-mail: [email protected]
Keywords: GTN model, damage mechanics, HPC, structural integrity.
1
ABSTRACT
In order to maintain the structural integrity of safety related components, it is required to determine the fracture behaviour of materials at component level at different operating conditions. J-resistance curves are conventionally used for characterizing the elasto-plastic fracture behaviour of metallic components. They are usually derived from ASTM standard specimens. However, there is a problem in transferring the specimen J-resistance curves to the components because of the existence of stress triaxiality. The micro-mechanical models are used to overcome this problem and these models help in predicting the fracture behaviour of any component with any geometry and loading conditions. In this work, the Gurson-Tvergaard-Needleman (GTN) damage mechanics model is used for the crack growth analysis of real life reactor piping components. The paper also addresses the challenges involved in such analyses. In the present work, some of the selected components have been analyzed numerically by using parallel in-house finite element code ‘MADAM’ with GTN constitutive model. The strength of the micro mechanical models has been demonstrated by comparing the numerical results like load v/s. load-line displacements, J-R curves with the experimental data.
2
INTRODUCTION
Structural integrity assessment of safety related components involves determination of fracture behaviour of various components at different operating conditions. In the conventional elastic-plastic fracture mechanics analysis, the applied J-integral is compared with that material J-resistance (J-R) curve obtained from laboratory fracture specimens to characterize the fracture behaviour of components. However, testing of different types of specimens and loading conditions revealed considerable differences in the J-R curves, especially in the slopes. This raises the question on transferring the fracture parameters from specimens to the component level.
Micro-mechanical damage models have become very popular in recent years for the reason that they can resolve the issue of transferability in the conventional elastic-plastic fracture mechanics analysis. This becomes possible because these models incorporate the physical damage mechanisms into the constitutive models. The plastic or ductile rupture follows the nucleation, growth, and coalescence of micro-voids with significant plastic deformation. This strain-controlled process of ductile rupture consumes much more energy due to plastic deformation. Crack grows stably and growth stops in case the load is not increased further (neglecting creep effects). Failure criteria are generally based on two independent assessment methodologies. The model of Rice & Tracey (1969) for ductile crack initiation is based on a critical void fraction. This is calculated by a subsequent evaluation of stress and strain fields obtained from a conventional elastic-plastic finite element analysis. On the other hand, the "coupled" constitutive models of Gurson (1977) and Rousselier require specific material subroutines for performing the FE analysis. In these cases the evolution of damage affects the yield behavior.
with the identification of these parameters. Parameters for SA333GR6 have been determined from notched tensile tests reported by Samal et.al (2001). These parameters have been used to simulate different specimens as well as components.
In the present paper, the GTN model is used to analyze fracture behaviour of real life piping components used in nuclear reactors. The organization of the remaining paper is as follows: Section 3 briefly describes the GTN model. Section 4 describes the detailed analysis of the components analyzed using GTN model. In section 5 some computational aspects of such analyses are presented. Section 6 gives comparison between numerical and experimental results.
3
GURSON TVERGAARD AND NEEDLEMAN (GTN) MODEL
In this section, the micro-mechanical model using Gurson Tvergaard Needleman (GTN) model has been described briefly. Gurson (1977) derived a constitutive model 'φ ' for materials containing either cylindrical or spherical voids.
(
)
2{
( )
}
2
* 2 *
1 3
2
, , 2. . cosh 1 0
2 k eq ij k M M M q
f ! f q ! q f
" ! !
! !
= + $& %'# + =
( ) (1) Here 1 2 3 . . 2 eq s sij ij
! ="$ #%
& ' is the macroscopic effective stress,
1 3 ij ij kk ij
s =! # ! " represents the stress deviator
and σM is the flow stress of the matrix material. The above yield function reduces to Von-Mises yield criterion for f* equals to zero. f* is defined as the ratio of the volume of voids to that of a unit cell. The increase in void volume fraction consists of two terms, i.e. void fraction increase due to nucleation of new voids and due to growth of existing voids. Tvergaard and Needleman (1984) introduced the parameters q1, q2 and q3 in order to bring the predictions of Gurson model closer to the experimental values. The function f*(f) was also introduced by Tvergaard and Needleman to model more rapid loss of material stress carrying capacity after the occurrence of voids coalescence. This function is expressed as follows.
(
)
* * u c c c f cf f for f fc
f f
f f f for f fc
f f
= <
!
= + ! "
!
(2)
The function becomes more predominant once void volume fraction 'f' exceeds a critical value 'fc'. The complete loss of load carrying capacity occurs at f=ff, the ultimate void volume fraction. In that condition is fu
*
= f*(ff) = 1/q1. The increase in void volume fraction consists of two terms i.e., i) nucleation of new voids and ii) growth of existing voids. So, Δf = Δfnucleation + Δfgrowth . The expression for the increase in void
fraction due to growth of voids can be derived from plastic incompressibility condition of the matrix material. It is given by Δfgrowth=(1-f) δij ηij
p
. Here δij is the kronecker delta function and ηij
p
is the plastic strain tensor.
4
FRACTURE ANALYSIS OF REAL LIFE PIPING COMPONETNTS
The fracture analysis of following real life components used in Indian PHWR’s has been carried out using the GTN model: a) 8-inch flawed straight pipe and b) 8-inch flawed elbow. Different loading conditions like bending moment (B), internal pressure (P) at different temperatures (T) are considered for the analysis. Material of the both components is SA333Gr6 steel. The mechanical properties of this material at room temperature (T=280C) are Young’s modulus E=203 GPa, Poisson’s ratio, ν=0.3, Yield stress= 285 Mpa. At temperature T=3000C), the properties are Young’s modulus E=183 GPa, Poisson’s ratio, ν=0.3 and Yield stress= 220 Mpa. The stress-strain data used for the analysis is presented in Fig. 1 in the form of True stress vs. plastic strain. The GTN damage parameters are given in Table. 1
Table 1. Damage parameters used in GTN model
0.0001 0.05 0.505 0.3 0.1 1.5 1.0 2.25 0.005 0.1mm
0.00 0.05 0.10 0.15 0.20 0.25 0.30 0.35 0.40
100 200 300 400 500 600 700
T
ru
e
s
tr
e
s
s
(
M
P
a
)
Plastic strain 300 oC
28 oC
Figure 1. Stress-strain data for SA333Gr6 material.
OS
IS
D0
LOAD
t
2
θ
OS
IS
D0
LOAD
t
2
θ
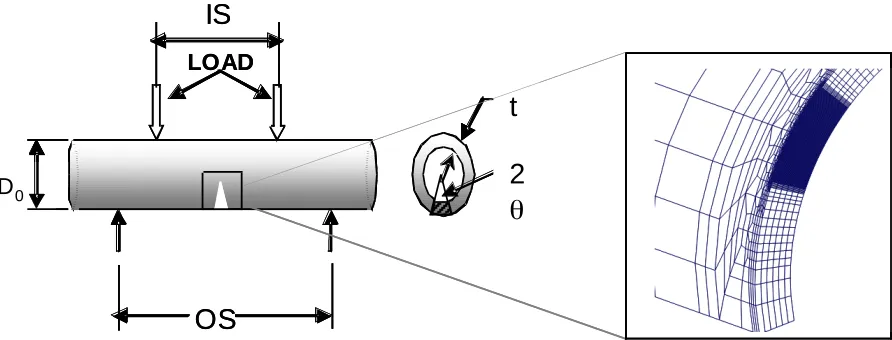
Figure 2. Schematic of the pipe analyzed. In the inset, the FE mesh near the crack is shown.
4.1 Analysis of the flawed straight pipe
An 8-inch flawed straight pipe with 65.60 through wall circumferential crack is considered. The schematic of the flawed straight pipe is shown in Fig. 2. The finite element mesh near the crack-tip is also shown in the inset. The outer diameter of the pipe is 219 mm with thickness t=15.15 mm. Damage analysis of the pipe under different loading conditions of Bending moment, pressure and temperature is carried out.
The pipe is subjected to four point bending as shown in Fig. 2. The outer span (OS) = 4000 mm and the inner span (IS) = 740 mm. Only one-fourth symmetric model is considered for the analysis. The bending load is applied in a displacement control manner. The finite element mesh consists of 12600 elements (20-node brick) and a total of 58500 (20-nodes. Different cases studied for the straight pipe are summarized below:
i) straight pipe under four point bending moment at room temperature (B at T=28)
iii) straight pipe under four point bending moment at 300 0C temperature (B at T=300)
iv) straight pipe under four point bending moment plus internal pressure of 10 MPa (B+P at T=300)
0 40 80 120 160
0 50 100 150 200 250
L
o
a
d
(
K
N
)
Load line displacement (mm) B (T=28) B+P (T=28) B (T=300) B+P (T=300)
Figure 3. Load vs. Load line displacement for the straight pipe. B=Bending moment, B+P=Bending moment plus internal pressure. T in brackets indicates the temperature at which analysis is carried out
0 3 6 9 12 15 18
150 175 200 225 250
L
o
a
d
(
K
N
)
Crack growth (mm)
B (T=28) B+P (T=28) B (T=300) B+P (T=300)
Figure 4. Load vs. Crack growth for the straight pipe.
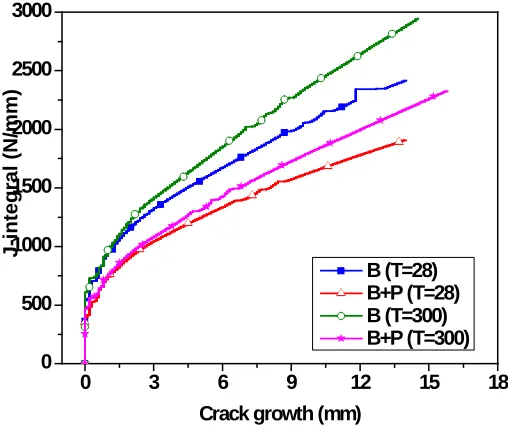
0 3 6 9 12 15 18 0
500 1000 1500 2000 2500 3000
J-integral
(N/mm)
Crack growth (mm)
B (T=28) B+P (T=28) B (T=300) B+P (T=300)
Figure 5. J-R curve for the straight pipe.
825.7mm
ϕ=900
Rb=207 mm 825.7mm
ϕ=900
Rb=207 mm
Figure 6. Schematic of the flawed elbow and FE mesh near the crack face in the inset.
4.2 Analysis of the flawed elbow
Here an 8-inch elbow with 98.240 through wall crack at extrados is considered. The material of elbow is same as that of straight pipe. The mechanical properties and GTN damage parameters are also same as that for the straight pipe. Schematic of the elbow is shown in Fig. 6. One-fourth symmetric model is considered for the analysis. The finite element mesh consists of 9000 elements (20-node brick) and 41000 nodes. The loading cases considered for the elbow are:
i) elbow under closing mode at room temperature (B at T=28)
ii) elbow under closing mode at 300 0C temperature (B at T=300)
0 50 100 150 0
25 50 75 100 125 150
L
o
a
d
(
K
N
)
Load line displacement (mm)
B (T=28) B (T=300)
Figure 7. Load vs. Load line displacement for the flawed elbow
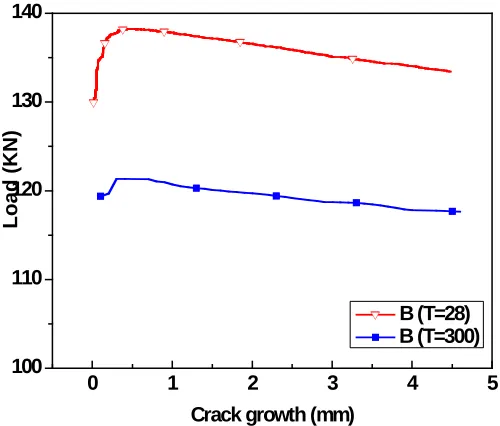
0 1 2 3 4 5
100 110 120 130 140
L
o
a
d
(
K
N
)
Crack growth (mm)
B (T=28) B (T=300)
Figure 8. Load vs. Crack growth for the flawed elbow
5
COMPUTATIONAL ASPECTS
The main advantage of the micro-mechanical based fracture analysis over the conventional elastic-plastic fracture mechanics (EPFM) analysis is that the problem of transferability issue from specimen to component can be resolved. We can directly get the crack-growth as a function of applied load which is not possible in EPFM. Also the ultimate load carrying capacity or the maximum allowed crack growth can be directly used for any design/analysis purposes. However, there are few drawbacks of these models: i) these models are mesh dependent in the sense that we need to have very fine mesh of the order of characteristic length (lc)
6
EXPERIMENTAL VALIDATION
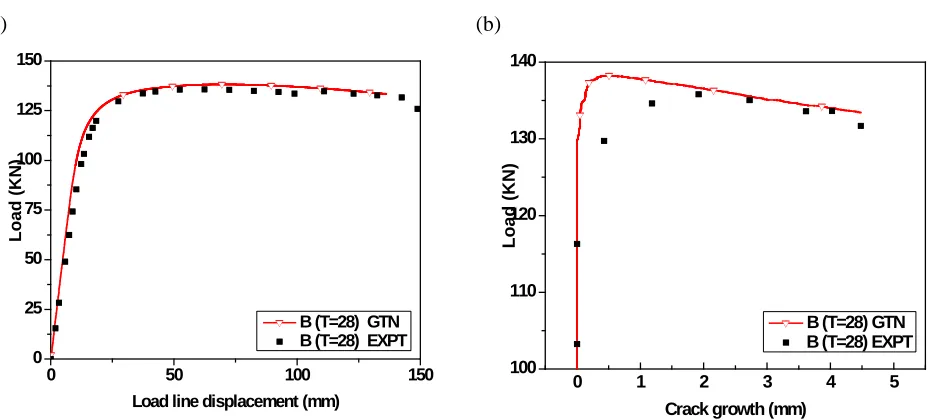
As a part of comprehensive structural integrity assessment program, many real life piping components for various geometries (pipes, elbows of different diameter) with different sizes of flaws(crack angle, through-wall, part-through cracks etc.) under different loading conditions have been tested experimentally. Out of these, here we present comparison of numerical results with that of experiments for 8-inch pipe and 8-inch elbow under bending moment at room temperature (B at T=28). Fig.10 gives the comparison of numerical and experimental results for load vs. load line displacement and load vs. crack growth for 8-inch pipe. The same data for the elbow are shown in Fig. 11. From the results, it can be seen that results of GTN model are in very good agreement with the experimental results.
(a)
0 20 40 60 80 100
0 50 100 150 200 250 300 L o a d ( K N )
Load line displacement (mm) B (T=28) GTN
B (T=28) EXPT
(b)
0 5 10 15
150 175 200 225 250 275 300 L o a d ( K N )
Crack growth (mm) B (T=28) GTN
B (T=28) EXPT
Figure 10. Comparison of GTN model and experimental results a) Load vs. Load line displacement and b) Load vs. crack growth for the straight pipe.
(a)
0 50 100 150
0 25 50 75 100 125 150 L o a d ( K N )
Load line displacement (mm) B (T=28) GTN B (T=28) EXPT
(b)
0 1 2 3 4 5
100 110 120 130 140 L o a d ( K N )
Crack growth (mm)
B (T=28) GTN B (T=28) EXPT
7
CONCLUSION
Three dimensional damage mechanics analysis of flawed straight pipe and elbows has been carried out using the GTN micro-mechanical model. Different loading combinations like 4-point bending, internal pressure and temperature are considered for the analysis. The ultimate load carrying capacity of the flawed straight pipe is not changed much when the bending moment is combined with internal pressure. The effect of high temperature is that the ultimate load carrying capacity is reduced but the crack growth occurs very slowly as compared to bending at room temperature. In case of flawed elbow, unstable collapse occurs very fast without much crack growth in both the cases considered. It has been demonstrated that micro-mechanical models are useful to limit the total number of experiments to be carried out in future on real life components under any loading conditions.
REFERENCES
Dutta, B. K., Samal, M. K., Sahu, M. K., and Kushwaha, H.S. 2004. Analytical determination of material JR and fracture toughness transition curves using micro-mechanical modeling. ASME Pressure and piping components conference dated 29/07/04, San Diego, California.
Gurson, A.L. 1977. Continuum theory of ductile rupture by void nucleation and growth: Part-I yield criteria and flow rules for porous ductile media. Journal of Engineering Material Technology, Trans. of ASME, 9: P. 2-15.
Rice, J. R., and Tracey, D. M. 1969. On the ductile enlargement of voids in triaxial stress fields. Journal of Mech. Phys. Solids. Vol. 17: P. 201-217.
Samal, M. K., Dutta, B. K., Kushwaha, H. S. 2001. Three-dimensional analysis of piping components using damage mechanics code 'MADAM'. BARC Mumbai, technical report.