Report No. 381
THE NEUSE RIVER BASIN AGRICULTURAL NITROGEN REDUCTION STRATEGY: A PROGRAMMATIC ANALYSIS
By
Alyssa A. Wittenborn and David H. Moreau
Department of City and Regional Planning University of North Carolina at Chapel Hill Chapel Hill, NC 27599
UNC-WRRI-381
THE NEUSE RIVER BASIN AGRICULTURAL NITROGEN REDUCTION STRATEGY: A PROGRAMMATIC ANALYSIS
Alyssa A. Wittenborn and David H. Moreau
Department of City and Regional Planning University of North Carolina at Chapel Hill
Chapel Hill, NC 27599
The research on which this report is based was supported by funds provided by the Water Resources Research Institute of The University of North Carolina (WRRI). Contents of the publication do not necessarily reflect the views and policies of the WRRI, nor does mention of trade names of commercial products constitute their endorsement by the WRRI or the State of North Carolina.
This report fulfills the requirements for a project completion report of the Water Resources Research Institute of The University of North Carolina. The authors are solely responsible for the content and completeness of the report.
ACKNOWLEDGEMENTS
ABSTRACT
In 1997, North Carolina adopted the Neuse River Basin Nutrient Sensitive Waters Management Strategy to cut nitrogen inputs to the Neuse by 30%. The strategy includes two rules targeting agricultural producers. The agricultural rule is an innovative pollution control approach that allows farmers to work collaboratively to achieve nitrogen reductions through use of nutrient management and targeted installation of BMPs. The nutrient management rule requires certain producers to develop nutrient management plans or participate in training. This project employs quantitative and qualitative research methods to investigate the implementation and impact of these rules. It uses information from published reports and program staff to assess whether the agricultural rule is a more flexible and cost-effective approach than a standard regulatory requirement. It uses data from a telephone survey of farmers in the basin to describe their knowledge of the agricultural rules, attitudes toward the strategy, and management behaviors. Available data about the agricultural rule indicate that the collaborative approach is more flexible than a standard regulatory requirement, but do not allow a thorough evaluation of
cost-effectiveness. The survey results indicate that most farmers have adopted nutrient management practices and that the Neuse Strategy is likely responsible for some of this behavior. In addition, farmers generally support the strategy’s agricultural requirements, though most lack
understanding of their details. Cost-share funding has encouraged adoption of nutrient
TABLE OF CONTENTS
ACKNOWLEDGEMENTS... ii
ABSTRACT ... iii
TABLE OF CONTENTS ... iv
LIST OF FIGURES ... viii
LIST OF TABLES ... viii
SUMMARY AND CONCLUSIONS ... xi
RECOMMENDATIONS ... xviii
1. INTRODUCTION... 1
1.1 Problem Definition ... 1
1.2 Research Objectives ... 3
1.3 Organization of the Report ... 3
2. BACKGROUND INFORMATION ... 4
2.1 The Neuse River Basin Nutrient Sensitive Waters Management Strategy ... 4
2.1.1 Agricultural Nitrogen Reduction Strategy Rule ... 4
2.1.1.A Program Design ... 4
2.1.1.B Operation of the Local Advisory Committees ... 5
2.1.1.C Role of the Basin Oversight Committee ... 5
2.1.1.D Similarity to the Wastewater Discharge Rule ... 5
2.1.1.E The Aggregate Nitrogen Loss Estimation Worksheet ... 6
2.1.1.F Estimation of County-level Data for Input into NLEW ... 7
2.1.1.G NLEW-Approved Best Management Practices ... 8
2.2 Supporting Cost Share Programs ... 10
2.2.1 North Carolina Agricultural Cost Share Program ... 10
2.2.2 Conservation Reserve and Enhancement Program ... 11
3. LITERATURE REVIEW ... 13
3.1 Policy Instruments Related to Agricultural Nonpoint Source Pollution ... 13
3.1.1 The Policy Challenge of Nonpoint Source Water Pollution ... 13
3.1.2 Command and Control Environmental Policy Instruments ... 14
3.1.3 Nonpoint Source Pollution Trading Instruments ... 15
3.1.4 Financial Incentive Instruments ... 17
3.1.5 Empirical Findings Related to Policy Instrument Efficacy and Efficiency in the Context of Agricultural Water Pollution ... 19
3.1.6 Collaborative Processes ... 21
3.2 The Role of Farm and Farmer Characteristics in the Adoption of Best Management Practices ... 22
4. METHODOLOGY ... 24
4.1 Research Objective 1 – How Successful has the Neuse Agricultural Strategy been in Achieving its Goals? ... 24
4.2 Research Objective 2 – How are Farmers Responding to the Neuse Agricultural and Nutrient Management Rules? ... 25
5. RESULTS AND DISCUSSION – RESEARCH OBJECTIVE 1 ... 27
5.1 Results: Nitrogen Application Rates, Best Management Practice Implementation, and Nitrogen Runoff Reductions ... 27
5.1.1 Piedmont Region ... 27
5.1.2 Upper and Middle Coastal Plain Region ... 29
5.1.4 Neuse River Basin ... 33
5.2 Discussion: Nitrogen Application Rates, Best Management Practice Implementation, and Nitrogen Runoff Reductions ... 35
5.2.1 Sources of Reported Nitrogen Loss Reductions ... 35
5.2.2 Issues with the Available Data ... 36
5.3 Results and Discussion: Rule Flexibility and Efficiency ... 37
5.3.1 Flexibility of the Agricultural Rule ... 37
5.3.2 Cost-Effectiveness of the Agricultural Rule ... 38
5.4 Discussion: Changes in Ambient Water Quality ... 41
6. RESULTS AND DISCUSSION – RESEARCH OBJECTIVE 2 ... 44
6.1 Group A Models: Nutrient Management Practice Adoption ... 44
6.1.1 Dependent Variables ... 45
6.1.2 Independent Variables ... 46
6.1.3 Model Results and Discussion ... 47
6.2 Group B Models: Knowledge of the Neuse Rules ... 51
6.2.1 Dependent Variables ... 51
6.2.2 Model Results and Discussion ... 53
6.3 Group C Models: Attitudes Toward the Neuse Rules... 54
6.3.1 Dependent Variables ... 55
6.3.2 Independent Variables ... 56
6.3.3 Model Results and Discussion ... 56
6.4 Group D Models: Nutrient Management Plans and Training ... 58
6.4.1 Dependent Variables ... 59
6.4.3 Model Results and Discussion ... 60
6.5 Group E Models: Attitudes and Experiences Regarding Farm Inspections and Penalties... 62
6.5.1 Dependent Variables ... 63
6.5.2 Independent Variables ... 64
6.5.3 Model Results and Discussion ... 64
6.6 Discussion: Changes in Ambient Water Quality ... 66
7. REFERENCES... 70 8. APPENDICES
8.1 Appendix A. 2005 Farmers’ Nutrient Management Practices and Compliance Motivations Survey
LIST OF FIGURES
Figure 1. Neuse River Basin………2
LIST OF TABLES Table 1. Average Nitrogen Removal Efficiencies for BMPs in the Neuse Basin………8
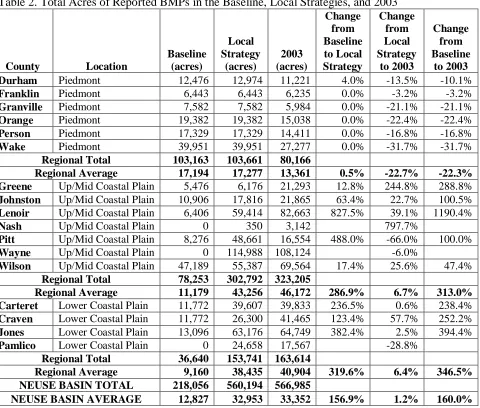
Table 2. Total Acres of Reported BMPs in the Baseline, Local Strategies, and 2003…………..29
Table 3. Changes in Active Cropland from the Baseline to 2003……….31
Table 4. Percentage of Cropland Covered by BMPs………33
Table 5. Changes in Average Nitrogen Application Rates from the Baseline to 2003………….34
Table 6. Group A Models – Nutrient Management Practice Adoption………45
Table 7. Percentage of Farmers Using Nutrient Management Practices………...45
Table 8. Number of Nutrient Management Practices Adopted……….46
Table 9. Descriptive Statistics for Farm and Farmer Characteristic Variables……….46
Table 10. Receipt of Government Support or Cost Share Funds………..47
Table 11. Group A Multivariate Model Results………48
Table 12. Likelihood the Respondent Would Use the Same Nutrient Management Practices if the Neuse Rules had not Passed………...51
Table 13. Group B Models – Knowledge of the Neuse Rules………. 51
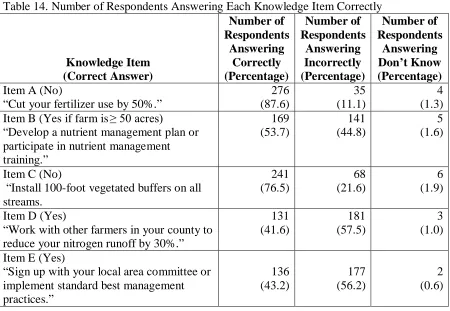
Table 14. Number of Respondents Answering Each Knowledge Item Correctly………52
Table 15. Number of Knowledge Items Answered Correctly………...52
Table 16. Group B Multivariate Model Results………53
Table 17. Group C Models – Attitudes Toward the Neuse Rules……….55
Table 18. Agreement with statement: “Current regulations to protect water quality in the Neuse River are reasonable.”………55
Table 19. Agreement with statement: “Regulators are unfairly targeting agriculture when other groups that pollute the Neuse River are not being held accountable.”………..56
Table 20. Agreement with statement: “The regulations targeting farmers in the Neuse River Basin are improving water quality.”………..56
Table 21. Group C Multivariate Model Results………57
Table 22. Group D Models - Nutrient Management Plans and Training………..59
Table 23. Nutrient Management Activities Undertaken by Farms of Different Sizes…………..60
Table 24. How Much Farmers Rely on their Nutrient Management Plans when Making Nutrient Application Decisions………60
Table 25. Group D Multivariate Model Results………61
Table 26. Group E Models – Attitudes and Experiences Regarding Farm Inspections and Penalties……….63
Table 27. Agreement with statement: “The government is not very likely to inspect my nutrient management practices.”……….63
Table 28. Agreement with statement: “If I do not comply with nutrient management rules, I expect to be penalized.”……….64
Table B.1.1. Pamlico County: Acres of Reported Baseline, Planned, and Implemented BMPs Table B.1.2. Pamlico County: Cropland Loss’
Table B.1.3. Pamlico County: Cropland Acreage and Fertilization Table B.1.4. Pamlico County: Total BMP Acreage
Table B.1.5. Pamlico County: Reported Nitrogen Load Reduction Progress
Table B.2.1. Jones County: Acres of Reported Baseline, Planned, and Implemented BMPs Table B.2.2. Jones County: Cropland Loss’
Table B.2.3. Jones County: Cropland Acreage and Fertilization Table B.2.4. Jones County: Total BMP Acreage
Table B.2.5. Jones County: Reported Nitrogen Load Reduction Progress
Table B.3.1. Craven County: Acres of Reported Baseline, Planned, and Implemented BMPs Table B.3.2. Craven County: Cropland Loss’
Table B.3.3. Craven County: Cropland Acreage and Fertilization Table B.3.4. Craven County: Total BMP Acreage
Table B.3.5. Craven County: Reported Nitrogen Load Reduction Progress
Table B.4.1. Carteret County: Acres of Reported Baseline, Planned, and Implemented BMPs Table B.4.2. Carteret County: Cropland Loss’
Table B.4.3. Carteret County: Cropland Acreage and Fertilization Table B.4.4. Carteret County: Total BMP Acreage
Table B.4.5. Carteret County: Reported Nitrogen Load Reduction Progress
Table B.5.1. Wayne County: Acres of Reported Baseline, Planned, and Implemented BMPs Table B.5.2. Wayne County: Cropland Loss’
Table B.5.3. Wayne County: Cropland Acreage and Fertilization Table B.5.4. Wayne County: Total BMP Acreage
Table B.5.5. Wayne County: Reported Nitrogen Load Reduction Progress
Table B.6.1. Wilson County: Acres of Reported Baseline, Planned, and Implemented BMPs Table B.6.2. Wilson County: Cropland Loss’
Table B.6.3. Wilson County: Cropland Acreage and Fertilization Table B.6.4. Wilson County: Total BMP Acreage
Table B.6.5. Wilson County: Reported Nitrogen Load Reduction Progress
Table B.7.1. Lenoir County: Acres of Reported Baseline, Planned, and Implemented BMPs Table B.7.2. Lenoir County: Cropland Loss’
Table B.7.3. Lenoir County: Cropland Acreage and Fertilization Table B.7.4. Lenoir County: Total BMP Acreage
Table B.7.5. Lenoir County: Reported Nitrogen Load Reduction Progress
Table B.8.1. Johnston County: Acres of Reported Baseline, Planned, and Implemented BMPs Table B.8.2. Johnston County: Cropland Loss’
Table B.8.3. Johnston County: Cropland Acreage and Fertilization Table B.8.4. Johnston County: Total BMP Acreage
Table B.8.5. Johnston County: Reported Nitrogen Load Reduction Progress
Table B.9.1. Greene County: Acres of Reported Baseline, Planned, and Implemented BMPs Table B.9.2. Greene County: Cropland Loss’
Table B.9.3. Greene County: Cropland Acreage and Fertilization Table B.9.4. Greene County: Total BMP Acreage
Table B.9.5. Greene: Reported Nitrogen Load Reduction Progress
Table B.10.2. Pitt County: Cropland Loss’
Table B.10.3. Pitt County: Cropland Acreage and Fertilization Table B.10.4. Pitt County: Total BMP Acreage
Table B.10.5. Pitt County: Reported Nitrogen Load Reduction Progress
Table B.11.1. Nash County: Acres of Reported Baseline, Planned, and Implemented BMPs Table B.11.2. Nash County: Cropland Loss’
Table B.11.3. Nash County: Cropland Acreage and Fertilization Table B.11.4. Nash County: Total BMP Acreage
Table B.11.5. Nash County: Reported Nitrogen Load Reduction Progress
Table B.12.1. Granville County: Acres of Reported Baseline, Planned, and Implemented BMPs Table B.12.2. Granville County: Cropland Loss’
Table B.12.3. Granville County: Cropland Acreage and Fertilization Table B.12.4. Granville County: Total BMP Acreage
Table B.12.5. Granville County: Reported Nitrogen Load Reduction Progress
Table B.13.1. Franklin County: Acres of Reported Baseline, Planned, and Implemented BMPs Table B.13.2. Franklin County: Cropland Loss’
Table B.13.3. Franklin County: Cropland Acreage and Fertilization Table B.13.4. Franklin County: Total BMP Acreage
Table B.13.5. Franklin County: Reported Nitrogen Load Reduction Progress
Table B.14.1. Person County: Acres of Reported Baseline, Planned, and Implemented BMPs Table B.14.2. Person County: Cropland Loss’
Table B.14.3. Person County: Cropland Acreage and Fertilization Table B.14.4. Person County: Total BMP Acreage
Table B.14.5. Person: Reported Nitrogen Load Reduction Progress
Table B.15.1. Durham County: Acres of Reported Baseline, Planned, and Implemented BMPs Table B.15.2. Durham County: Cropland Loss’
Table B.15.3. Durham County: Cropland Acreage and Fertilization Table B.15.4. Durham County: Total BMP Acreage
Table B.15.5. Durham County: Reported Nitrogen Load Reduction Progress
Table B.16.1. Orange County: Acres of Reported Baseline, Planned, and Implemented BMPs Table B.16.2. Orange County: Cropland Loss’
Table B.16.3. Orange County: Cropland Acreage and Fertilization Table B.16.4. Orange County: Total BMP Acreage
Table B.16.5. Orange County: Reported Nitrogen Load Reduction Progress
Table B.17.1. Wake County: Acres of Reported Baseline, Planned, and Implemented BMPs Table B.17.2. Wake County: Cropland Loss’
Table B.17.3. Wake County: Cropland Acreage and Fertilization Table B.17.4. Wake County: Total BMP Acreage
SUMMARY AND CONCLUSIONS
In this study, we investigate the implementation of the agricultural requirements of the Neuse River Basin Nutrient Sensitive Waters Management Strategy. We evaluate the success of the Neuse Strategy’s agricultural rule in achieving its goal of a 30% nitrogen loss reduction in a manner that is more flexible and cost-effective than a one-size-fits-all requirement for best management practice (“BMP”) implementation. We also explore how agricultural producers in the Neuse Basin have responded to the Neuse Strategy’s agricultural rule and nutrient
management rule in terms of their attitudes, knowledge, and management behaviors. To answer these questions, we analyzed both quantitative and qualitative data that have been reported about the rules concerning the installation of BMPs, changes in average nitrogen application rates, attenuation of cropland, reductions in nitrogen losses from cropland, and implementation of the rules on the ground. We also analyzed data from a telephone survey of 315 farmers in the basin.
RESEARCH OBJECTIVE 1 – HOW SUCCESSFUL HAS THE NEUSE AGRICULTURAL STRATEGY BEEN IN ACHIEVING ITS GOALS?
Sources of Nitrogen Loss Reductions
As measured by Nitrogen Loss Estimation Worksheet (“NLEW”), the agricultural requirements of the Neuse Strategy have been very successful in achieving the 30% nitrogen loss reduction goal for agricultural lands in the Neuse Basin. In 2003, the year the agricultural rule was to have been fully implemented, the Neuse Basin Oversight Committee (“BOC”) reported that the counties in the basin had achieved a nitrogen loss reduction of 42% compared to the baseline years of 1991 to 1995. Though all counties in the basin reportedly met their nitrogen loss reduction targets, the means they used to do so varied significantly across the three geographical regions of the basin and to some extent among the counties within each region.
In the Piedmont region, all six counties lost BMPs between the baseline years and 2003, but still reduced their nitrogen losses by an average of 39.5%. Significant cropland attenuation and reduced nitrogen application rates overcame the BMP losses. All six counties experienced relatively rapid growth and population increases during the implementation period, which are expected to continue into the future. Thus, continued loss of active cropland in this region is likely to occur.
two actually added small amounts. Thus, the success of this region in achieving its nitrogen loss reduction goal appears to be attributable to a mix of new BMPs, reductions in nitrogen
application rates, and loss of active cropland.
The four counties in the Lower Coastal Plain region reported an average nitrogen loss reduction of 44.5%, the highest average reduction in the basin. This reduction is attributable primarily to the implementation of two types of BMPs: water control structures and nutrient management. Nutrient management appears to have been very successful in this region as its counties reported the most significant average nitrogen application rate reductions in the basin. Cropland loss played a much smaller role in this region’s success than in the Piedmont or in the Upper and Middle Coastal Plain areas.
According to the BOC, cropland attenuation accounted for almost a third of the nitrogen loss reductions achieved by agricultural producers in the basin in 2003 and exactly one-third came from reduced nitrogen application rates. It is important to note that neither of these sources of nitrogen loss reduction is necessarily permanent. The majority of land taken out of production by 2003 was simply left idle or planted with grass or trees, either of which could be reversed in future years. In addition, nitrogen application rates depend on numerous factors including the price of fertilizer and the types of crops grown, both of which can fluctuate greatly over time and are beyond the control of the Neuse Strategy. Therefore, two of the primary sources of nitrogen loss reduction for agricultural lands in the basin may not be dependable in the long run. Another important issue that the Neuse Strategy needs to address in future years is how to account for land that moves from one category of the strategy to another. For example, land that is taken out of agricultural production for development purposes represents a nitrogen loss reduction for agriculture. If the development occurs in specific geographic locations targeted by the Neuse stormwater rule, it should be picked up as a new source of nitrogen losses in that category. However, if the development occurs outside of those designated areas, it will become a source of nitrogen loss that is no longer accounted for by the strategy. In any pollution control effort that strives to control all key sources, it is important to avoid potential holes like this that can frustrate achievement of the overall policy goal – improving water quality.
One of the most significant challenges facing the Neuse Strategy agricultural rule is its reliance on potentially unreliable data for measuring success. For state policy makers, the success of the agricultural rule is tied to a specific number that is calculated from NLEW: the total nitrogen loss reduction achieved by agricultural lands in the basin. However, since many of the key values that NLEW uses to calculate this number are based on aggregated estimates and professional judgments, it is not clear how accurate the reported nitrogen loss reductions actually are. While some cost-share records related to BMP installation in the basin do exist, even these records are unlikely to accurately capture the full extent of BMP use. This is because some farmers install BMPs without financial assistance and records of federally-supported BMPs have become more difficult to obtain. The nitrogen application rate data are even more likely to be problematic because farmers are not required to keep records on fertilizer use. In addition, the estimates that go into NLEW have to be aggregated across entire counties for each crop type. Though
strategy option of the agricultural rule to submit some basic data on their practices in exchange for the flexibility granted by this option.
A final issue related to the success of the agricultural rule in achieving the required nitrogen loss reduction goal concerns those who did not sign up for the local strategy option of the rule, and thus opted into the standard BMP option by default. Reportedly, 11% of agricultural land in the basin was not enrolled in the local strategy option, and yet no information was found about what has happened with this land. It appears that the county nitrogen loss estimates include all
cropland in the county, not just the land enrolled in the local strategy option. It seems likely that those who did not sign up for this option have been ignored in the program’s implementation because the counties have successfully met their goals. If this is true, it is important to consider the effect this will have on future policies that include a choice of compliance options. For example, it would seem that allowing some producers to act as “free-riders” would serve as a disincentive for others to actively participate in future efforts. While it is possible that those who opted for the standard BMP option already were in compliance with those requirements, without public information about these farmers and their practices, there is no way to confirm that. Rule Flexibility and Efficiency
In order to try to increase the flexibility and cost-effectiveness of achieving the 30% nitrogen loss reduction, the agricultural rule was designed to give farmers a choice in how to comply with the law and to allow local committees of farmers and agricultural officials to collaboratively determine what BMPs should be used and where they should be targeted.
After examining the rule’s language, the NLEW tracking tool, and other information about how the rule has been implemented, it is clear that the agricultural rule is more flexible than a
requirement for all farmers to implement standard BMPs. By including the local strategy option and allowing decisions about how to achieve nitrogen reductions to be made by collaborative bodies at the county level, the rule allows both differential levels of action by participating farmers and the selection of BMPs that are more tailored to local conditions. It also gives nitrogen reducing credit to two BMPs that are not included in the standard BMP packages, expanding the number BMPs from which participating farmers can choose. Finally, because 89% of cropland in the basin was voluntarily enrolled in this option, it is apparent that farmers generally preferred the local strategy option, which indicates that most farmers perceived it to be the more flexible option.
Drawing conclusions about the rule’s cost-effectiveness is more difficult. We assume that targeting BMPs to the areas where they are likely to achieve the largest nitrogen reductions is the best indicator of whether or not those implementing the rule considered cost-effectiveness in their decisions. Such areas would include the counties closest to the Neuse Estuary and
Based on existing data about the rule, we cannot determine whether the inclusion of the local strategy option led to higher levels of cost-effectiveness within the counties, however. It is not clear if the county Local Advisory Committee’s (“LACs”) considered cost-effectiveness in their decisions about where BMPs should be located because they do not report information about where BMPs were targeted or where they were implemented.
Based on what we have learned about the implementation of the agricultural rule, we do not believe that cost-effectiveness factored into the decision-making processes of the LACs to a significant extent. We draw this conclusion based largely on the fact that the LACs were not given clear incentives to pursue this as a goal in their decisions nor were they given technical tools to enable them to do so.
Ambient Water Quality Changes
Existing studies of changes in nitrogen concentrations and loadings to the Neuse Estuary identify some reductions in various nitrogen measures over the past decade or two. However, the
findings of these studies are not entirely consistent and in some cases can easily be explained by climatic events or the timeframes selected by the studies. Even if the nitrogen reductions they find are accurate, these studies are not able to attribute the reductions to management actions taken by agricultural producers in the basin. Therefore, these studies are not able to validate the cropland-based nitrogen loss reductions reported by the BOC for the counties in the Neuse Basin.
RESEARCH OBJECTIVE 2 – HOW ARE FARMERS RESPONDING TO THE NEUSE AGRICULTURAL AND NUTRIENT MANAGEMENT RULES?
The survey of farmers in three Neuse Basin counties analyzed in this study focuses on five issues: (1) the extent of nutrient management practice adoption, (2) knowledge of the Neuse rules, (3) attitudes toward the Neuse rules, (4) development of nutrient management plans and participation in training, and (5) attitudes and experience regarding farm inspections and penalties.
Nutrient Management Practice Adoption
According to the survey results, nutrient management practices including soil testing, fertilizer equipment calibration, cover crop planting, and nutrient management planning are widely used in the counties covered by the survey. The majority of farmers reported using three or four
practices and only 4% reported using none.
financial benefits for the producers: development of nutrient management plans and planting of cover crops. Though nutrient management plans are meant to result in more judicious and appropriate use of fertilizer, their impact may appear less direct than some of the other practices. The benefits of planting cover crops are likely even less clear to producers. Cover crops may help reduce soil erosion, but their nitrogen reduction benefits do not accrue to the farmer and the farmer does not harvest the crop. Because the payoffs from these practices may be indirect or may not accrue to the farmer at all, financial incentives were the key factor in encouraging their use.
It appears that the Neuse Strategy’s agricultural requirements are encouraging the use of nutrient management practices since only 4.4% of the sample reported not using any of the identified practices. However, since some of these practices have obvious financial benefits for producers and some of them are qualified to receive cost-share funds, it is not clear how much these practices would have been used in the absence of the Neuse requirements. In order to try to answer that question, the survey asked respondents how likely they would be to use the same nutrient management practices if the Neuse nitrogen regulations had not been passed. The majority of respondents reported that they would be somewhat likely (35%) or very likely (51%) to use the same practices without the rules in place. However, given the fact that 49% of those surveyed said something other than “very likely,” it appears that the Neuse rules are actually encouraging some adoption of nutrient management practices. There is the potential that these responses are somewhat biased since the respondents may not want to appear to support regulations that affect them. However, if such a bias does exist in the responses, it would dampen the apparent impact of the rules, not exaggerate it.
Knowledge of the Neuse Rules
Findings that large proportions of the survey respondents answered the three knowledge questions concerning the Neuse agricultural rule and nutrient management rule incorrectly indicate the need for more education of farmers about the Neuse Strategy and its pertinent requirements. The statistical models tested for the knowledge items identify several important factors that were predictive of a respondent’s level of knowledge. Farm size, receipt of cost share, and education were all positively associated with a respondents overall level of knowledge about the rules. These results suggest that future educational efforts should specifically target smaller farms, farmers who are not already participating in cost share programs, and those with lower levels of education. Also, it is possible that the direction of influence between cost share and knowledge runs the other way, with knowledge about the collective 30% nitrogen reduction requirement encouraging farmers to obtain cost share funds, rather than the other way around. If true, this would indicate another way in which the agricultural rule is positively impacting BMP adoption.
Attitudes Toward the Neuse Rules
reasonable and are improving water quality. However, most respondents also feel that
agriculture is being unfairly targeted. In testing factors that may influence the level of agreement with these three items, none were found to be significant for the first two items. For the third item, higher levels of income and nutrient management practice adoption increased the
likelihood that a respondent agreed strongly that agriculture was being unfairly targeted. Receipt of cost share funds decreased the likelihood that a respondent strongly agreed with the statement. It appears from these results that some of the farmers who have adopted multiple nutrient
management practices feel overburdened. It may be that cooperative farmers are being asked to do too much, which is creating resentment toward the rules. If true, this could hamper future efforts to improve environmental practices in the basin. It is clear that providing cost share funds to farmers significantly reduces their feelings of resentment toward the rules.
Nutrient Management Plans and Training
The survey results were also analyzed to determine roughly how many farmers are in compliance with the Neuse Strategy nutrient management rule. This rule requires that those who apply fertilizers to 50 acres of land or more complete nutrient management training or develop a nutrient management plan. Thus, farmers with operations that are 50 acres or larger who have completed one or more of these activities are considered to be in compliance. According to the survey results, three-quarters of regulated farmers are in compliance or in “over-compliance,” meaning that they completed both activities. Approximately one-quarter of regulated farmers seem to be out of compliance with the nutrient management rule.
In general, it appears that the nutrient management rule has had a positive impact on the completion of these two nutrient management-related activities. However, the relatively high rate of completion of these activities also found among farms smaller than 50 acres (56.1%) suggests that the rule is not fully responsible.
In the statistical models, several factors were found to have a significant influence over the compliance status of farms. For farms of 50 acres or more, older farmers were less likely to be in compliance and those with higher levels of knowledge about the agricultural rules and higher incomes were more likely to be in compliance. Income appears to play the most significant role in determining whether an unregulated farm has undertaken either activity. While those
implementing the Neuse Strategy have no influence over age or income, they can work to improve knowledge about the Neuse Strategy and its requirements, which may increase compliance levels among regulated farmers.
Of the respondents who reported having nutrient management plans, 61.8% claim to always rely on their plans when making nutrient application decisions. Only 3% reported never using their plans. This indicates that developing a nutrient management plan is not just a paper exercise for farmers in the basin. If those implementing the agricultural rules can encourage more farmers to develop nutrient management plans, those plans are likely to have a significant impact on the farmers’ fertilizer application decisions.
less education were more likely to rely on their plans for making nutrient application decisions than those with higher levels of education. When combined with the finding that those who have completed only high school or less education are less likely to have a nutrient management plan in place, this result is informative. Basically, farmers with only a high school education or less are less likely to have a nutrient management plan in the first place, but those who do have them rely on them heavily when making fertilizer application decisions. Clearly, focusing more attention on helping less educated farmers develop nutrient management plans would pay off in terms of influencing their fertilizer application decision-making. This finding is particularly important because more than 42% of the farmers in the survey fall into this education level. Attitudes and Experience Regarding Farm Inspections and Penalties
According to the survey results, most farmers have a high level of concern about the likelihood of inspections and penalties under the Neuse agricultural rules. These findings suggest that the rules are having a deterrent effect and are likely encouraging compliance among farmers. In testing factors that may influence respondents’ fears of inspections and penalties, only one factor was found to have an influence. Not surprisingly, those who had experienced a farm inspection in the past were more apt to believe that the government is likely to inspect their nutrient management practices.
About half of the respondents reported that their farm was inspected between 2000 and 2005. In testing factors that might be predictive of which respondents were most likely to have
experienced a farm inspection, two interesting results emerged. First, whether a farm is regulated under the nutrient management rule did not influence whether a farm had been inspected. Second, higher levels of practice adoption make a farm more likely to be inspected even when controlling for the receipt of cost share funds. These findings may indicate that farm inspections are not being targeted effectively. Inspections appear to be targeted at the farms that are already adopting practices, not those that should be but may not be in compliance.
RECOMMENDATIONS
Based on our findings, we offer a number of recommendations for both the Neuse Strategy and for other similar agricultural nonpoint source pollution control efforts. These recommendations fall into four categories: (1) tracking and reporting programmatic data, (2) encouraging cost-effective solutions, (3) improving knowledge and understanding of the Neuse Strategy, and (4) encouraging cooperation and compliance.
Tracking and Reporting Programmatic Data
• The quality of the data reported by the counties and put into NLEW that are used to track compliance with the 30% nitrogen loss reduction goal should be improved so that they are more reliable and verifiable. One way to improve the data would be to require farmers who have signed up for the local strategy option to report the crops they use, their fertilization rates, and the BMPs they install. Random field surveys could also help validate the reports. • In their local strategies and annual reports, the LACs should report which farmers have
agreed to implement BMPs, what types and quantities of BMPs they have agreed to implement, and where they are located.
• The LACs should also report any information that is available about the costs of
implementing the BMPs and they should report their BMPs in terms of acres installed, not just acres of cropland treated.
• Even though the counties in the basin have reportedly exceeded their nitrogen loss reduction goals to date, they should continue to track changes in cropland use, fertilization application rates and BMPs installation and maintenance into the future to ensure there is no backsliding. Encouraging Cost-Effective Solutions
• To encourage the LACs to consider cost-effectiveness in their decision-making, they must be provided with both incentives and user-friendly technical tools to do so.
• Those implementing the agricultural rule may also want to consider developing a mechanism that allows farmers to compensate each other for BMP installation so the burden is more evenly distributed. A formal trading program within each county is probably too
complicated, but ideas such as requiring each farmer in the LAC to pay into a fund based on the relative proportion of nitrogen their farm contributes and then using that money to fund BMP installation should be investigated.
Improving Knowledge and Understanding of the Neuse Strategy
• Farmers in the basin appear to need more education regarding the requirements of the agricultural rule and the nutrient management rule. Improving understanding of these rules should encourage more participation and higher levels of compliance. Based on our findings, educational efforts should specifically target farmers who are not already receiving cost share funds, those who have lower levels of education, and those who have smaller farms.
are covered by the rules, not just agriculture. This may reduce feelings of resentment and encourage farmers to be more cooperative.
Encouraging Cooperation and Compliance
• Cost-share funds make a clear and significant impact on the development of nutrient
management plans and most respondents with nutrient management plans rely on those plans frequently or all of the time when they make fertilizer application decisions. Since nutrient management is one of the key sources of nitrogen runoff reductions in the basin, more funding should be allocated to encourage this practice.
• Program staff should also offer farmers in the basin additional technical assistance with nutrient management plan development. In particular, they should target these opportunities to less-educated farmers, who are least likely to have plans, but most likely to make use of their plans when making fertilizer application decisions.
• State and county agricultural officials should investigate the apparent high levels of noncompliance with the nutrient management rule found in this study. They should specifically target some inspections to farms that are not receiving cost share funds and are not already known to be using nutrient management practices.
1. INTRODUCTION
1.1 PROBLEM DEFINITION
Nonpoint source water pollution is an increasingly important issue across much of the United States. In many areas, such as coastal North Carolina, nutrient-rich runoff has caused
considerable eutrophication of aquatic systems, generating significant ecological, aesthetic, and economic damage.
According to the North Carolina Department of Environment and Natural Resources (“N.C. DENR”) Division of Water Quality (“DWQ”), nonpoint source pollution is the primary cause of degradation of freshwater rivers and streams in the state. Agriculture alone is responsible for more than half of nonpoint source-related water quality impairments, contributing both nutrients and sediment to the state’s waters. Concern over excessive nutrient inputs has been particularly acute in the Neuse River Basin, where numerous algal blooms in the 1970s led to studies that identified nitrogen and phosphorus as the main problems.
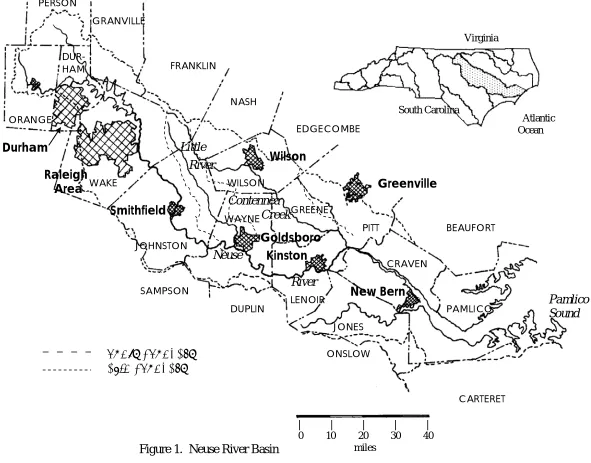
The Neuse River Basin, shown in Figure 1, is the third largest in North Carolina, encompassing 6,192 square miles in 19 counties (N.C. DWQ “Basinwide” 2006). In 1988, the North Carolina Environmental Management Commission (“EMC”) classified the entire Neuse Basin as
“Nutrient Sensitive Waters,” and targeted early regulatory efforts on major sources of nutrient inputs, such as phosphate detergents and wastewater treatment plants. Despite these efforts, major fish kills in the Neuse River in 1995 showed that more needed to be done, particularly with regard to nitrogen.
In December 1997, the state responded by establishing a goal of a 30% nitrogen input reduction from all major sources in the basin. Agricultural sources were targeted specifically through two rules supporting the state’s Neuse River Basin Nutrient Sensitive Waters Management Strategy: the “Agricultural Nitrogen Reduction Strategy Rule” and the “Nutrient Management Rule.” The first of these two rules lays out a general agricultural strategy and the second focuses specifically on nutrient management planning and training. This report investigates the implementation and efficacy of these rules. It also addresses issues related to policy design.
Figure 1. Neuse River Basin
| | | | | 0 10 20 30 40
miles
PERSON
WAYNE
JOHNSTON
WILSON
GREENE
LENOIR
PITT
JONES
CRAVEN
PAMLICO DUR-
HAM
GRANVILLE
ORANGE
WAKE
BEAUFORT EDGECOMBE
NASH FRANKLIN
DUPLIN SAMPSON
ONSLOW
CARTERET
Pamlico Sound Durham
Kinston
New Bern Goldsboro
Smithfield
Greenville Raleigh
Area
Wilson Little
Neuse
River River
Contennea Creek
County boundary Basin boundary
Virginia
South Carolina
As detailed in this report, the portions of the Neuse River Basin Nutrient Sensitive Waters Management Strategy (“Neuse Strategy”) that affect agriculture differ from both traditional voluntary approaches and strict regulatory approaches to pollution control. By writing nutrient reduction requirements into law, the Neuse Strategy is intended to achieve a higher level of pollution abatement than a voluntary approach likely would achieve. At the same time, by providing farmers with some choices in how to comply with the reduction requirements, the Neuse Strategy is intended to be more flexible than a strict regulatory approach, improving both the efficacy and efficiency of the requirements. Though this novel approach has technically met the required 30% nitrogen runoff reduction, little has been reported about how the portions of the Neuse Strategy that affect agriculture have operated and whether they have lived up to the goals of increased flexibility and cost-effectiveness. In addition, little is known about how agricultural operators are responding to these rules in terms of their attitudes toward and understanding of the rules as well as their management behaviors.
This study investigates the implementation of the agricultural requirements of the Neuse Strategy in order determine how successful this approach has been in achieving its stated goals and how the agricultural producers targeted by the rules are responding to them. This study provides important information for practical efforts to design and implement management schemes that effectively control agricultural nonpoint source pollution. The information provided in this report should benefit not only North Carolina environmental and agricultural officials concerned with the success of the Neuse Strategy, but also those working to reduce agricultural nonpoint source pollution in other areas of the state and nation.
1.2 RESEARCH OBJECTIVES
This study pursues two primary research objectives. The first objective is to evaluate the success of the Neuse Strategy in achieving its stated goals of reducing nitrogen losses from agricultural operations in the Neuse Basin by 30% and achieving this goal in a way that is more flexible and cost-effective than a strict regulatory requirement. The second objective is to describe how farmers in three Neuse River Basin counties have responded to the Neuse Strategy in terms of their knowledge of the strategy’s agricultural requirements, their attitudes concerning the strategy and its impacts, and their reported management behaviors. Discussions related to these two research objectives also identify key issues that have arisen during implementation of the agricultural portions of the Neuse Strategy and, where possible, offer suggestions for addressing these issues.
1.3 ORGANIZATION OF THE REPORT
2. BACKGROUND INFORMATION
2.1 THE NEUSE RIVER BASIN NUTRIENT SENSITIVE WATERS MANAGEMENT STRATEGY
The Neuse River Basin Nutrient Sensitive Waters Management Strategy is comprised of several components targeting both point and nonpoint sources of nutrient pollution in the Neuse Basin. The point sources are targeted by a wastewater discharge rule and nonpoint sources are covered by rules addressing urban stormwater management, riparian buffer protection, agricultural runoff reduction, and nutrient management. Agricultural sources of nutrient pollution are primarily targeted by these last two components: the “Agricultural Nitrogen Reduction Strategy Rule” and the “Nutrient Management Rule.”
More detailed information on the structure of these rules, their requirements, and some of the programs that support their implementation follows.
2.1.1 Agricultural Nitrogen Reduction Strategy Rule
2.1.1.A Program Design. The North Carolina EMC put the Agricultural Nitrogen Reduction Strategy Rule (15A NCAC 2B .0238)(“agricultural rule”) into effect on August 1, 1998. The rule affects “all persons engaging in agricultural operations” in the Neuse River Basin and required a mandatory 30% reduction in total nitrogen loading from a baseline calculated as the average annual load from 1991 to 1995. This reduction was to be achieved within five years of the effective date of the rule, or by August 1, 2003.
The agricultural rule provides farmers with two options for reaching the reduction goal. The first option is to follow the default “Standard Best Management Practice Strategy,” in which farmers must individually implement prescribed combinations of riparian area protection, water control structures, and nutrient management plans. This option is equivalent to a regulatory requirement for farmers. The second option is for farmers to participate in a “Local Nitrogen Reduction Strategy” that allows a group of farmers to achieve the required reduction collectively. In this option, a Local Advisory Committee (“LAC”) that includes local farmers and governmental representatives develops collective strategies to meet the local area’s reduction goal.
2.1.1.B Establishment and Operation of the Local Advisory Committees. During
implementation of the agricultural rule, one LAC formed in each affected county. Each LAC is required to include at least two local farmers in its membership along with representatives of the DWQ, the county Soil and Water Conservation District (“SWCD”), the Natural Resources Conservation Service (“NRCS”), the N.C. Department of Agriculture and Consumer Services, and the N.C. DENR Division of Soil and Water Conservation (“DSWC”). According to Natalie Jones (CREP Manager, N.C. DENR, pers. com. 2006), who has worked closely with the
program, potential farmer members were identified by the directors of the county SWCDs and members were officially appointed by these directors and the N.C. DWQ. The farmer members are not compensated for their participation.
Each LAC’s initial responsibilities included conducting the sign-up process for farmers who wanted to participate in this option of the rule and developing the “Local Nitrogen Reduction Strategies” to meet the nitrogen runoff reduction goal. The LACs are also charged with
submitting annual progress reports to the Basin Oversight Committee, which they continue to do. According to Natalie Jones (pers. com. 2006), the LACs met regularly when first established, but they operated primarily as feedback mechanisms rather than the primary planning and decision-making bodies. Typically, the program’s field staff, called “Neuse Technicians” would develop estimates for nitrogen application rates, best management practice use, and cropland acres and the LAC would provide feedback on those numbers. Over time, however, as the LACs have officially met their nitrogen reduction goals, participation by the farmer members has
diminished. Though the LACs still meet, current meetings are generally only attended by the agency representatives. The farmer members are sent the annual progress reports for review by mail, and if they do not respond within two weeks, they are assumed to concur.
2.1.1.C Role of the Basin Oversight Committee. The agricultural rule also established a Basin Oversight Committee (“BOC”) comprised of representatives from the DWQ, the agricultural community, the environmental community, the scientific community, the DSWC, the NRCS, the N.C. Department of Agriculture and Consumer Services, and the N.C. Cooperative Extension Service. Over the course of implementing the agricultural rule, key responsibilities of the BOC have included: developing a method for tracking nitrogen loadings and reductions from farms, allocating nitrogen reduction goals for each county in the basin, reviewing and approving county nitrogen reduction strategies, and presenting this information to the EMC.
association was established in 2002 and has a single, collective discharge permit for nitrogen based on the sum of the members’ individual nitrogen allocations (Breetz et al. 2004). The members of the association are allowed to trade nitrogen allocations with each other or with non-member dischargers in order to remain under the total nitrogen discharge cap.
The wastewater discharge rule also requires dischargers with permitted flows of less than 0.5 MGD to meet their collective 30% reduction target. These dischargers are allowed to join the compliance association, but they do not have nitrogen limits written into their discharge permits. The wastewater discharge rule also includes a program of offset payments to compensate for any exceedances of the collective limit and to allow for new or expanding dischargers who are not able to obtain nitrogen allocations from existing dischargers. These offset payments go to the Wetland Restoration Fund to pay for nonpoint source controls (N.C. DENR “Wastewater Rule”). However, no offset payments have been made to date because the compliance association has easily met its 30% reduction target on its own (Breetz et al. 2004).
Allowing for large wastewater dischargers in the Neuse River Basin to collectively meet the required nitrogen discharge reductions through participation in the compliance association was meant to improve the acceptability, flexibility, and efficiency of the discharge rule. This idea was carried over into the design the agricultural rule. Though not explicitly stated as a goal of the Neuse Strategy, having comparable rules targeting point sources and agricultural nonpoint sources in the Neuse Strategy may enhance how fair and equitable the program is perceived to be by those covered by the rules.
2.1.1.E The Aggregate Nitrogen Loss Estimation Worksheet. The agricultural rule required the BOC to develop a scientifically valid tracking and accountability methodology to estimate total nitrogen loading from agricultural operations in the Neuse Basin and to track progress in implementing best management practices (“BMPs”) and achieving the required total nitrogen loading reduction. In response to this requirement, a multi-agency task force developed the Aggregate Nitrogen Loss Estimation Worksheet (“NLEW”).
According to Osmond et al. (2004), NLEW has three key objectives: to estimate a baseline nitrogen loading for agriculture for the baseline years of 1991-1995, to allocate nitrogen reduction goals to the counties in the basin, and to assist the county LACs in determining the distribution of BMPs in their area. NLEW was approved by the EMC in 2000 (N.C. DWQ “Neuse River” 2002).
NLEW makes several important simplifying assumptions. It assumes that most of the nitrogen lost from cropland moves as soluble nitrogen and that most of the available nitrogen in the soil system is either used by crops or moved through the soil into shallow groundwater. NLEW does not account for all nitrogen sources, nor does it account for nitrogen cycling such as net
mineralization and denitrification (Osmond et al. 2004).
parameters are specified for each county, NLEW reports several numbers for each crop in the county, including:
the total nitrogen needed by the crop based on realistic yield expectations (lbs.);
the total nitrogen applied to the crop (lbs.);
the amount of excess nitrogen, if more is applied than needed;
the portion of the excess nitrogen that is lost from the soil surface (set at 5%);
the portion of the excess nitrogen that is in the subsurface soil (set at 95%);
the amount of subsurface nitrogen not removed by the crop (lbs.);
the total amount of subsurface nitrogen, including that not removed by the crop and the portion of the excess nitrogen in the subsurface;
the amount of nitrogen transformed or intercepted by cover crops or BMPs (lbs.);
the amount of subsurface nitrogen that is lost from the targeted area (lbs.); and
the total estimated amount of nitrogen leaving the targeted area, which includes the amount of subsurface nitrogen that is lost plus the excess surface nitrogen.
In the aggregate version of NLEW, the targeted area is the entire county’s cropping system. 2.1.1.F Estimation of County-Level Data for Input into NLEW. NLEW was used to determine each county’s baseline nitrogen loss, the yardstick against which the 30% required nitrogen loss reduction is measured. It has also been used to track compliance with the 30% nitrogen loss reduction requirements in each county. However, much of the data that goes into NLEW to calculate these figures consists of estimates developed by program staff.
For the baseline data, county agency staff had to estimate the baseline nitrogen fertilization rates for different crops using their best professional judgment (Osmond et al. 2003). County staff also had to estimate the amounts and types of BMPs that existed in the baseline, due to a general lack of records. Crop acres were determined from Farm Service Agency records, however (Osmond et al. 2003).
As the agricultural rule has been implemented, estimates of BMPs have improved due to the use of cost share program records. However, according to Natalie Jones (CREP Manager, N.C. DENR, pers. com. 2006) information on farmer participation in federal programs became more difficult to obtain following passage of the 2002 Farm Bill, which contains a privacy provision. According to the U.S. Department of Agriculture (“USDA”) Economic Research Service, this provision states that:
Information provided to the Secretary for the purpose of providing technical or financial assistance to a producer through a natural resources conservation program cannot be considered public information and cannot be disclosed to any person or entity outside of USDA, except to the Attorney General for the purpose of enforcing natural resources conservation programs. (USDA “Farm Bill”).
information for counties or watersheds when there are at least four cost share recipients in the same area. Though this privacy provision makes it difficult for state agency staff to obtain information about the use of federally-cost shared BMPs through formal channels, because federal USDA employees often share local offices with county SWCD staff, some of this information is still shared informally (Natalie Jones, pers. com. 2006).
2.1.1.G NLEW-Approved Best Management Practices. In calculating nitrogen loss reductions, NLEW gives nitrogen reduction credits only to select BMPs. Though numerous other BMPs have positive impacts on water quality through reduction of sediment in agricultural runoff, because NLEW assumes that most of the nitrogen lost in the Neuse Basin is coming from shallow groundwater, these BMPs do not receive credit for nitrogen reductions. In general, four categories of BMPs have been shown to reduce nitrogen losses from cropland in all or parts of the Neuse River Basin: riparian buffers, controlled drainage, nutrient management, and
conservation tillage. Within each category, particular BMP designs can receive NLEW credit. The types of BMPs receiving credit in NLEW and the average nitrogen removal efficiencies of each type are detailed in Table 1.
Table 1. Average Nitrogen Removal Efficiencies for BMPs in the Neuse Basin
Best Management Practices Average Nitrogen Removal Efficiency
20' Vegetated (grass) buffer 40%
30' Vegetated (grass) buffer 65%
20' Forested or shrub buffer 75%
50' Riparian buffer 85%
Water control structure 40%
Nutrient management Highly variable
Cover crops Depending on crop type, 5-15%
Riparian buffers:
Riparian buffers consist of land that is located between cropland and a surface water body such as a stream or river. A properly functioning riparian buffer can trap sediment, pesticides, organic matter, and nutrients before they can enter the water body. Particularly relevant to the Neuse agricultural strategy, riparian buffers are also effective in denitrifying nitrate as it passes through the buffer in shallow groundwater.
consisting only of grass. In addition, wider buffers are generally more effective than narrower ones.
The following types of buffers receive nitrogen reduction credit in NLEW:
- 20-foot grass buffers, which are also called filter strips. These buffers are generally only considered effective if the slope of the land being drained is between 1 and 10% and they are planted with permanent herbaceous vegetation such as grass or legumes.
- 30-foot grass buffers
- 20-foot forested or shrub buffers
- 50-foot riparian buffers, which consist of 30 feet of trees and/or shrubs adjacent to the stream and 20 feet of grass adjacent to the trees
Controlled drainage:
Used in areas with flat slopes and where drainage ditches are found, controlled drainage reduces nitrogen losses from cropland by managing the water table. This BMP uses water control structures consisting of a flashboard riser installed in the drainage ditch outlet. These flashboard risers are raised or lowered to control the water table in the fields above the ditch outlet. When the water table in the field is kept relatively high compared to natural conditions, less nitrogen is transported out of the field due to increased crop uptake and increased denitrification. This BMP is most appropriate in the lower portions of the Neuse Basin (Gilliam, Osmond, and Evans 1997).
Nutrient management:
Nutrient management seeks to properly balance nutrient applications with crop needs in order to reduce the runoff of nutrients from cropland. Information about soil type, realistic yield
expectations for the crops, and nutrient availability in the soil guides farmers in applying the correct types and amounts of nutrients. Nitrogen reductions from nutrient management practices vary widely. NLEW accounts for these reductions in the estimated fertilizer application rates.
Conservation tillage:
Conservation tillage leaves at least 30% of the soil surface covered with plant residue at all times and generally includes the use of a fall cover crop that is not harvested, such as wheat, triticale, barley, rye, or oats. After the cover crop is killed off, the farmer uses either a no-till or strip-till crop production system. No-till production leaves the field essentially undisturbed. Strip-till disturbs only narrow strips of the field where seeds are planted. The primary benefit of conservation tillage is a reduction in soil erosion, which can reduce the amount of nutrients in runoff when the nutrients are bound to soil particles. However, no-till and strip-till practices have less impact in the Neuse River Basin because most of the nitrogen of concern is found in the shallow groundwater, not bound up in sediments.
account for this, NLEW assumes that no-till corn in the Piedmont has a higher nitrogen use efficiency than in the Coastal Plain. Cover crops are given credit in NLEW with the nitrogen reduction efficiency varying by crop type (Osmond et al. 2004).
Cropland loss:
In addition to these BMPs, NLEW includes the loss of active cropland as a nitrogen reducing measure. Some of the cropland that is “lost” each year is permanently taken out of production, such as for development. Some of it is merely idle and may be put back into production in the future.
2.1.2 Nutrient Management Rule
In addition to the agricultural rule, a second major Neuse Strategy rule affects agricultural producers in the Neuse Basin. The “Nutrient Management Rule” (15A NCAC 2B .0239) also went into effect on August 1, 1998. It targets anyone who applies fertilizer to or manages 50 acres or more of cropland in the Neuse Basin, unless the cropland is covered by a certified
animal waste management plan (N.C. DWQ “Nonpoint” 2002). Farmers affected by this rule are required either to complete training and continuing education in nutrient management or to develop a written nutrient management plan for all property where nutrients are applied in a calendar year. Farmers who intended to complete nutrient management training were required to sign up for training within one year of the effective date of the rule, and to complete the training within five years. Those who did not sign up for the training were required to develop a nutrient management plan. These plans could be written by the farmer or a consultant and were required to meet particular federal or state standards. The plans are kept on site with the farmer, but upon request by the N.C. DWQ, must be produced for inspection within 24 hours (N.C. DWQ
“Nonpoint” 2002). Nutrient management training in the Neuse Basin was offered by N.C. Cooperative Extension Service agents on a county-by-county basis in 2001 and 2002. 2.2 SUPPORTING COST SHARE PROGRAMS
Numerous programs provide financial support for farmers who are interested in implementing or installing BMPs that help protect water quality. Two of the key programs that have been used to support implementation of the Neuse agriculture rules include the North Carolina Agricultural Cost-Share Program and the USDA’s Conservation Reserve and Enhancement Program. These programs provide financial incentives for use of BMPs and provide basic compliance
mechanisms through their practice inspection requirements. 2.2.1 North Carolina Agricultural Cost Share Program
The North Carolina Agricultural Cost Share Program (“N.C. Cost Share Program”) was
Manual” 2004). The program was created and is supervised by the North Carolina Soil and Water Conservation Commission. This commission consists of political appointees as well as representatives selected from the appointed and elected supervisors of each SWCD. The program is administered by the N.C. DSWC and is carried out by the state’s 96 SWCDs (N.C. DSWC “Cost Share Manual” 2004).
The N.C. Cost Share Program provides cost share funding for specific practices that reduce off-site water quality impacts from agricultural operations. These practices may be funded up to 75% of the average cost for each practice, with the farmer providing the other 25%. The farmer’s contribution can consist of in-kind support. Each applicant is limited to $75,000 per year of cost share funding. If the applicant is a limited-resource or beginning farmer, the cost share funding may increase to up to 90% and the total limit per applicant may increase up to $100,000 (N.C. DSWC “Cost Share Manual” 2004).
Participation in the N.C. Cost Share Program is voluntary, and projects are selected for funding based on their potential to improve water quality. In order to prioritize potential projects, the supervisors in each SWCD must develop a strategy plan that identifies what needs to be done in the district to reduce agricultural nonpoint source pollution, prioritizes the most critical areas, and determines how much money is needed to solve the problems with BMPs. These strategy plans are submitted to the Soil and Water Conservation Commission, which allocates funding to the districts based on their needs (N.C. DSWC “Cost Share Manual” 2004). Once the districts receive their allocations, which average about $75,000 per year per district, the supervisors then review applications from landowners and determine who will receive funding for BMP
installation.
Once funded and implemented, the district supervisors must certify that the BMPs meet NRCS standards. To ensure ongoing operation and maintenance for the life of the contract, the supervisors are required to perform spot checks on 5% of participating farms each year. They are also required to spot check 5% of cost-shared nutrient management plans each year (N.C. DSWC “Cost Share Manual” 2004). BMPs that are found out of compliance during the spot checks are reported to the DSWC along with a report of how the noncompliance was resolved. Operators found out of compliance must be notified in writing about their need either to
reimplement the practice or refund the cost share allocation (N.C. DSWC “Cost Share Manual” 2004). Districts are not allowed to approve cost share contracts for operators found to be out of compliance with the N.C. Cost Share Program at another site, field, or operation.
2.2.2 Conservation Reserve and Enhancement Program
The Conservation Reserve and Enhancement Program (“CREP”) is a joint federal and state land retirement conservation program. The North Carolina CREP targets agricultural lands in three river basins that drain into the Albemarle-Pamlico Estuary, including the Neuse River Basin. CREP is intended to help protect the estuary from nutrient and sediment-related problems from agricultural nonpoint source runoff. (USDA Farm Service Agency 1999). In the Neuse Basin, it is specifically meant to help farmers meet their mandatory 30% nitrogen reduction goal. It does this by providing financial incentives for voluntary use of conservation practices such as
and use of controlled drainage on lands near rivers, streams, drainage ditches, and wetlands (“BMPs in the Neuse”).
CREP supplements payments made under the federal Conservation Reserve Program.
Applicants may choose to enter into contracts that vary in duration from ten years to permanent. Cost-share payments increase as the contracts get longer, with 10-year contracts qualifying for a 75% cost-share payment for practice installation and permanent contracts qualifying for 100% payment. In addition to funding for installation, CREP also provides producers with annual payments that include the annual rental rate of the land, an annual incentive rate that varies by the practice installed, and $5 per acre for maintenance. There are also one-time bonus payments available if the land is put under a permanent contract or if it is enrolled for hardwood tree planting (“BMPs in the Neuse”).
North Carolina’s CREP will cover up to a total of 100,000 acres of land in the targeted river basins. Enrollment began in 1999. Land that is enrolled in CREP is subject to annual status reviews by the NRCS for the first three years of the contract period to ensure compliance. If contracted conservation practices have not been established by the third review, the contracts are subject to termination. After the first three years, Farm Service Agency personnel are
3. LITERATURE REVIEW
3.1 POLICY INSTRUMENTS RELATED TO AGRICULTURAL NONPOINT SOURCE POLLUTION
3.1.1 The Policy Challenge of Nonpoint Source Water Pollution
According to James McElfish of the Environmental Law Institute (2000), “Nonpoint source pollution is perhaps our greatest water quality problem, and it remains one of our greatest
problems of environmental governance.” Despite its pervasiveness, effective control of nonpoint source water pollution by government policies has been limited by several key factors. Nonpoint source water pollution is both diffuse and stochastic in nature, making it difficult to design effective and efficient control policies. It is impossible to pinpoint pollution sources and
pollution loads tend to vary by season, weather conditions, land use activities, soil type and other factors. These physical characteristics make monitoring nonpoint source pollution at its source challenging and cost-prohibitive (Malik, Larson, and Ribaudo 1994, Shortle and Horan 2001). They also make it difficult to clearly link pollution loads with specific land management practices. Due largely to these features, regulators have been hesitant to impose mandatory controls on nonpoint sources (Hale 2001).
Regulation of nonpoint source pollution is also limited by economic and political concerns. Regulations for diffuse pollution control tend to have less political support than those for point source control because they directly affect landowners’ use of their land (Warkentin 2001) and they often target activities that contribute to local economies (Hale 2001). Regulation of
nonpoint source pollution can also be hampered by overlapping agency jurisdictions, conflicting agency goals, and low public awareness (Gannon et al. 1996).
Given these difficulties, the primary government response to this problem has been to use financial and technical assistance to encourage voluntary actions such as the implementation of BMPs (McElfish 2000). However, it is apparent from ongoing water quality problems that these approaches have not been sufficient.
In the effort to move beyond a strictly voluntary approach to nonpoint source water pollution control, various groups have advocated the use of alternative environmental policy instruments. Some of these instruments have significant strengths, but most also have important weaknesses when applied to nonpoint source water pollution problems. Because of these weaknesses, some authors argue that more innovative mixes of policy tools should be investigated (Osborn and Datta 2006, Shortle and Horan 2001). One of the key policies investigated in this report, the Neuse Strategy agricultural rule, is such a mix.