Jn Partial Fulfillment of the Requirements For the Degree of
Doctor of Philosophy
California Institute of Technology Pasadena, California
1994
ACKNOWLEDGEMENTS
I would like to thank the members of the NE-18 collaboration for their contribu-tions to making the experiment a success. Special thanks go to Eric Belz, Rolf Ent, Wolfgang Lorenzon, and Naomi Makins for their work in the set up and analysis of the experiment. I also acknowledge the good work of Carl Hudspeth, Bob Eisle, the beam operators, and other SLAC staff members.
I am especially grateful to my adviser Brad Filippone. Brad has provided me with countless hours of guidance and discussion, and I have profittcd greatly from his suggestions and also from observing his methods. My graduate tenure was made much easier by the knowledge that my adviser had my best interests in mind.
Abstract
1 The Plane Wave Impulse Approximation . 6
2 Previous A(e, c'p) Data 12
B Color Transparency 17
1 Selection of Point Like Configuration l7
2 Color Screening . 21
3 Lifetime of Point Like Configuration 24
4 Color Transparency Experiments 27
c
Overview of the Experiment 30II Experimental Apparatus 33
A Electron B<'am 33
B Targets 34
c
The Magnetic Spectrometers 351 1.6 GeV /c Spectrometer 37
2 8 GeV /c Spectrometer 41
D Trigger Electronics . 48
III Analysis 53
A Particle Identification 54
B Track Identification 56
c
3-Momentum Reconstruction 60D Coincidence Identification . 63
E Reconstruction of Em and Pm 68
IV
v
VI
2 Coulomb Acceleration F Kinematic Settings . . G Efficiency Corrections
1 Absorption of Protons in Target and 8 GeV /c Materials 2 Summary . . . .
The Plane Wave Impulse Approximation Calculation A B
c
D E F GOverview of the Calculation . . . . . . . . . . . . . . . .
The Born-Level Plane Wave Impulse Approximation Cross Section Kinematics and Luminosity
External Radiation . Internal Radiation .
Multiple Scattering, Energy Loss, and Coulomb Acceleration Spectrometer Acceptance Monte Carlos
Results
A Extraction of S(Em, Jlm) B Measurement of T(
Q
2)
C Systematic Errors . . . D Comparison of T(
Q
2) with Theory 1 The Glauber Predictions . . . . 2 The Color Transparency Predictions
Conclusions
APPENDIXES
A
B
Coordinates
Track Purging
E
F
2 Scintillator Timing Parameters
3 1.6 GeV /c Scintillator ADC Malfunctions
The Model Spectral Function
Radiation in the PWIA Calculation
1 Effect of External Radiation on Count Rate 2 Effect of Internal Radiation on Count Rate 3 Internal Radiation in the One-Photon Limit .
4 Description of the Modified Equivalent Radiator Approximation. 5 Internal Radiation and Kinematics . . . . . . . . . . . .
173
177
178
185 185
187
188
List of Figures
1 Farrar et al. Color Transparency prediction for A(e, e'p). 2
2 Differential cross section for 3He(e,e') atE= 3.3-14.7GeV 4
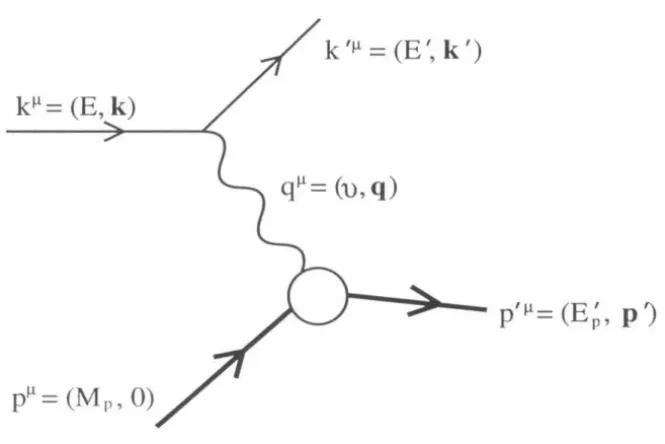
3 Born-LevePH(e,e'p) . . . . . . . 6
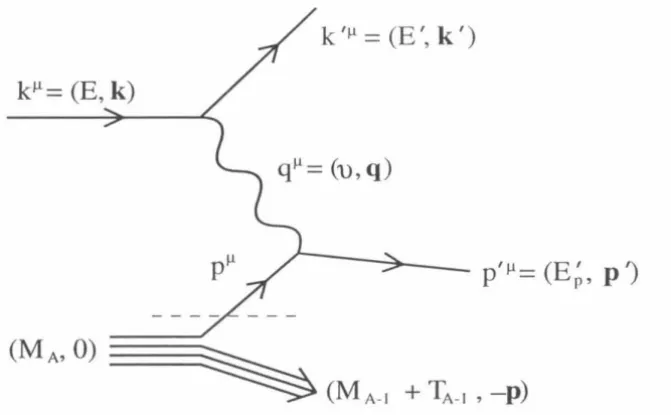
4 A(e, e'p) in the Born-level PWIA 8
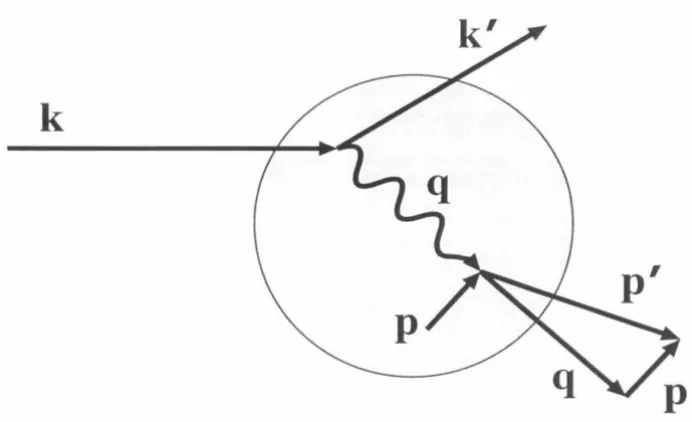
5 Schematic A( e, e'p) showing proton intial 3-momenLum 9
6 Em spectra from 12C(e, e'p) at Saclay . . . . . . . . . 13
7 ls and 1p Pm distributions from 12C( e, c'p) at Saclay 14
8 A(e, e'p) results for the spectroscopic sum rule 15 9 Schematic 1 H( e,
e'p) and A( e, e'p) 17
10 Lowest-order elastic scattering . . 18
11 The Feynman mechanism for elastic scattering 19
12 The A+ B ---* C
+
D exclusive reaction . . 2013 Constituent scaling in hadron form factors 22
1 ·1 Total hadron-proton cross section vs. elastic slope parameter 23
15 T measured in A(p, 2p) . . . . . . . . . 28
lG Correlation ofT and dujdt in A(p, 2p) 29
17 Plan view of End Station A . . 30
18 Schematic of experiment NE-l 8 31
19 Exterior view of the 1.6 GeV /c spectrometer 38
20 1.6 GeV /c spectrometer detector hut . . 39
21 Side views of the 1.6 GeV /c detector hut 40
22 Exterior side view of 8 GeV /c spectrometer . 42
30 8 Ge VIc trigger electronics . .
31 Typical track in the 1.6 GeV
lc
spectrometer 32 Typical track in the 8 GeVlc
spectrometer33 Effect of timing corrections for 197 Au at
Q
2 = 7 (GeV lc)2 34 flLv-e for 12C at Q2= 1 (GeV lc)2 35 Histogram of fltv-e for (Em, Pm) E R
36 Histogram of fl.Lp-e for (Em,Pm) E :F
37 Central Pm for a given Os . . . . . . 38 Coverage of (Em,
Pm)
at Q2= 1 (GeV lc)2 • 39 Coverage of (Em, Pm) at Q2
= 6.8 (GcV lc)2 40 Proton absorption efficiency for hydrogen . 41 One-photon external radiation in 1 H( e, c')
42 One-photon internal virtual radiation in 1 H( e, e')
'1:3 One-photon internal bremsstrahlung in 1 H ( c, e') 44 Em distribution of 1H(e,e'p) at
Q
2=
1 (GcVIc)2 45 1.6 GeVlc
focal plane distributions46 8 GeV
lc
focal plane distributions ·17 21
·
1
Pm distribution at Q2=
1
-
7
(GeV lc)2 48 2 [J Em distribution atQ
2=
1 7 (GeV lc)2 .49 12C Em distribution at
Q
2 = 1 (GeV lc)250
12CEm counts at Q2 = 1 (GeV
lc?
and 08 = 43.4°-51 12C Em distribution at Q2
=
1
-
7
(GeVlc)
2 • . 52 Em distribution of 12C model spectral function53
12C lp and ls Pm distributions at
Q
2=
1 (GeV /c)2 11454 12C Pm distribution at
Q
2=
1-7 (GeV /c)2 11555 56Fe Em distribution at
Q
2=
1-7 (GeV /c)2 11656 197 Au Em distribution at Q2
=
1-7 (GeV /c)2 11757 56Fe Pm distribution at Q2
=
1-7 (GeV /c)2 118 58 197 Au Pm distribution at Q2=
1-7 (GeV /c)2 11959 Nuclear transparency T(Q2
, 08 ) measured in 2H(e, e'p) 124
60 Nuclear transparency T(Q2,0
8 ) measured in 12C(e,e'p) 125
61 Nuclear transparency T(
Q
2, 08) measured in 56 Fe( e, e'p) 126
62 Nuclear transparency T(Q2
, 08 ) measured in 197 Au(e, e'p) 127
63 Nuclear transparency T(Q2
) measured in experiment NE-18 128
64 Nucleon-nucleon total and elastic cross sections 135
65 Standard T predictions for 12C . 137
66 Standard T predictions for 5°Fe 138
67 Standard T predictions for 197 Au 139
68 Farrar et a/. C, Au T predictions 144
69 Jennings and Miller 1992 C, Au T predictions 145
70 Bcnhar et a/. C, i\ u T predictions . 146
71 Frankfurt, Strikman, and Zhalov C, Fe, Au T predictions 14 7
72 Plan view of experiment NE-18 153
73 Formation of 1.6 GeV /c M cab and Tcab 161
74 Formation of 8 Ge V / c h /3 and h/3,only 162
75 Coincidence TDC' non-linearitics . 165
76 ] .6 GeV /c coincidence TDC 167
77 8 GcV /c coincidence TDC 168
78
Coincidence identification 169List of Tables
1 Approximate NE-18 Kinematics 31
2 Width of energy defining slits 33
3 Target characteristics . 35
4 Target-related materials 36
5 Nuclear radii and average Coulomb accelerations . 70
6 Detailed NE-18 kinematics . 71
7 Proton absorption in liquid target materials 78
8 Proton absorption in solid targets 80
9 Proton absorption in 8 Ge V / c spectrometer . 81
10 Tracking efficiency and proton absorption corrections 82
11 The (Em, Pm) range R 122
12 Correlation tail correction to the PWIA calculation 126
13 Nuclear transparency T measured in experiment NE-18 129
14 Uncertainties in the PWIA calculation 131
15 Experimental systematic errors 132
16 Total systematic errors 132
17 Laboratory coordinates 154
18 Spectrometer (Transport) coordinates 154
19 Focal plane (hut) coordinates 155
20 1.6 GeV /c track purges 157
21 8 GeV /c track purges 158
22 Timing conventions . 164
23 Scintillator timing parameters 174
24 Shell-independent parameters of IPSM S(Es, p) 180
I. INTRODUCTION
In 1982 Mueller and Brodsky [1] independently proposed that in wide angle exclu-sive processes, the initial and final state interactions (lSI and FSl) of hadrons in nuclei would vanish at high energies. This effect, based on arguments using perturbative QCD (pQCD), is called "Color Transparency" (CT), in reference to the disappearance
of the "color" forces between the hadrons and nuclei. The onset of CT with in
creas-ing energy can be tested by measurement of the nuclear transparency T, the ratio of the measured cross section to the cross section expected in the limit of complete CT
(i.e., no lSI or FSI). At low energies, T
<
1 because of absorption or deflection of the hadrons by lSI and FSI with the nucleus. At energies below the onset of CT, Tshould be independent of Q2 (assuming a constant proton-nucleus cross section). As
the energy increases and pQCD processes begin to dominate the scattering, however,
T should increase to unity. Some recent models of CT (see Figure 1, for example) exhibit significant increases in T for
Q
2 as low as 5 (GeV /c)2 [2-6]. Measurement ofan unambiguous increase in T could indicate the energy scale at which QCD becomes perturbative in exclusive processes. We present measurements of T for the reaction
A(e, e'p) on 2I-I, C, Fe, and Au nuclei at momentum transfers Q2
= 1, 3, 5, and 6.8 (GeV /c)2.
The following sections present a general overview of the theoretical and expen-mental questions of interest in the current experiment. First, in Section I.A there are descriptions of the formalism used for the analysis of A(e, e'p) and of the results
0.0~---.-1 ---.-1 ---·1---~r
0
2 4 6 8Q2
(GeV
/c)
2FIG. 1. Farrar et al. [2] T prediction for A(e, e'p) on A= 12 (upper
curves) and 200 (lower curves), calculated in the absence of Color
Transparency (solid line) or with the naive parton (dashed line)
and quantum diffusion (dash-chain line) Color Transparency
mod-els [2]. The CT models are described in Sections I.B.3 and V.D.
For comparison, the highest Q2
in the present experiment is
LA. The A(e, e'p) Reaction
Some of the best information about the structure of the nucleus has been derived using lepton-nucleus scattering. Experiments using leptonic probes have several ad-vantages over those using hadronic probes. Leptons couple to the nucleus through the r<.>latively weak electromagnetic interaction, while hadrons also experience the strong force. The electromagnetic interaction is calculable through low-order diagrams of the precision-tested theory of QED. By contrast QCD, the theory of the strong inter-action, is not as well-tested and its perturbative expansion docs not converge quickly (or at all) at the energies of interest. Furthermore, the lSI and FSI of a weakly-coupled leptonic probe are much smaller than those of a hadronic probe, minimizing the distortions to the measured structure. Finally, due to the small coupling, the structure is measured throughout the nuclear volume, rather than just at the surface. Early information about nuclear structure was provided by inclusive electron-nucleus scattering. The dependence of the A(c, c') cross section on the energy loss
at intermediate Q2 exhibits, among oLiwr structure, a broad "quasielastic" peak due
to the direct knockout of an individual nucleon from the nucleus (see Figure 2). The width of the peak is the result of the distribution of nucleon momenta inside the nucleus. Approximate nucleon momentum distributions can be extracted from the data through, for example, the study of the distribution in the scaling variable y [7]. Semi-exclusive measurements such a'3 A(e, e'p) allow a more complete character
> 200 0 3 4)
::::s 150 '-.. s...
2 4)
...
100 (ll'-..
m
50 1s::
0
0 100 200 300 400 500 250 500 750 1000 1250
"' in
MeV
CJinMeV
0.6
0.10
> E0~10.954 GeV
0.08 E0oc14.696 GeV
4) 0.4 ::::s
'-.. 0.06
...
s...
•
4)
..
+> 0.04
••
fll 0.2 '-..
m
0.02c
0.0 0.00
0 500 1000 1500 2000 2500 0 1000 2000 3000
"' in
MeV
CJinMeV
FIG. 2. Differential cross section dajd0.jdi/ for 3He(c,c') at E 3.3-J4.7GeV and ()k' = 8° (8]. In the figure, the energy loss
I/ 1s called w. The data exhibit a bump at I/ -::::= 100, 500, 1100,
2000 MeV [Q"l -::::= 0.2, 0.9.5, 2.1, 3.6 (GeV jc)2] due to quasielastic
nu-clean knock-out. The strength at larger v is due to excitation of a
nucleon to the ~{1 236) resonance and other inelastic channels. At
the entire nucleus, but for each nuclear shelL Thus the exclusive reaction allows
much more accurate tests of the single-particle description of the nucleus and better
matics for this process. The momentum transfer is
Q
=
-qiJ.q~-' and the 4-momentumtransfer is
( 1.1)
The circle at the photon-proton vertex, indicating the unspecified details of the
cou-piing, is suppressed in the following diagrams.
The Born-level cross section for this process is:
da
_
(da)
E'
(G
'i;
+
rG~
2G2
2
0)
-
-
-
-
+
T M tan-dO dO Mott E 1
+
T 2(1.2)
where the reference cross section for a structureless, non-recoiling target is
pI
~=
(E
;
'
p
')
FIG. 3. Born-Level 1H(e,e'p). Here k1', k111 , p1', and p'~L are the
4-momenta of the incoming electron, the outgoing electron, the
(
du ) a2 cos 2 f!..
dO. Matt - 4£2 sin4
2~.
( 1.3)Here a
=
e2 /47r1ic is the fine-structure constant, 0.=
(0, ¢) is the laboratory solidangle of the scattered electron, and T
=
Q
2 /411-12. The effect of the structure of the proton is specified by the electric and magnetic form factors, GE(Q2) and GM(Q2),
with approximate values given by the dipole form:
(
Q2 ) -2
GP "'
1+
-E - 0.71(GeV/c)2 ' (1.1)
Gp QP
M ~ flp E· ( 1.5)
Here flp is the magnetic moment of the proton.
For nuclear targets (A
>
1) at quasielastic kinematics and high energies[Q
2 ~1 (GeV /c)2], the Plane Wave Impulse Approximation (PWIA) is expected to dominate the A ( e, e'p) reaction mechanism. The PWIA assumes k, k', p, and p' are undistorted
plane waves (no Coulomb distortions, JSI, or FSI) and that the proton detected in the final state absorbed the entire momentum transfer. The Born-level PWIA is shown in Figure 4.
In the PWIA, the proton is treated as being essentially free ("quasi-free") before the reaction, except that it is bound with separation energy Es and moving with momentum p:
( 1.6)
The initial momentum p is t hC' result of the Fermi motion of the nucleons. The
separation energy Es is the energy it would take to remove the proton from the
nucleus to infinity without recoil (i.e., TA-l = 0). In the quasifree knockout reaction
the proton loses an additional energy TA-l to the recoil of the A - 1 system. In the
PWlA, the scattering ejects the proton from the nucleus without ISI or FSI. (The
pI~
=
(E
~' p
')
(MA,O)~ ..
~(M
A-l
+TA-l'-p)
FIG. 4. A(e, e'p) in the Born-level PWIA. The part of the
Feyn-man diagram above the dashed line is equivalent to Figure 3,
ex-cept that the proton initial 4-momentum pll- is given by
Equa-tion 1.6.
ln the Born-level PWIA, p~-' can be reconstructed from the experimentally
deter-mined 4-momenta: p~-' = p'~-' - q~-'. Thus, Es and p can be measured by the missing
energy
( 1. 7)
and missing momentum
Pm
=
p'- q ( 1.8)not accounted for in the detected particles [9]. In reality, the relations Em
=
Es andk
FIG. 5. Schematic A(e, e'p) showing effect of proton intial
3-mo-mentum on kinematics. Note the propagation length r v h/Q of
the photon is in reality much smaller than the size of the nucleus
(which is indicated in gray).
only up to the experimental resolution. Thus, the experimentally determined quanti
-ties Em and Pm can only be considered to be approximations to the actual separation
energy Es and initial momentum p. Note that in place of Pm, some authors [9] refer to the momentum PB = - pm of the recoil A - 1 system.
Vve adopt a convention where Pm, the magnitude of Pm, IS assigned a positive
(negative) sign if p' is at a larger (smaller) angle with respect. to the beam in the
electron scattering plane than is q. (For example, Figure 5 shows a kinematics where Pm
<
0. Note this convention is opposite to that used in [9].)Because of its separation energy Es and Fermi motiou pin the nucleus, the proton
is off-shell. De Forest. [10] and others [9] give a prescription for extending the nucleon
unconstrained proton initial 4-momentum.
The nuclear structure is characterized by the spectral function
S(Es,
p ), the pr ob-ability density for finding a proton with separation energyEs
and 3-momentum p.The normalization of
S(Es,
p) is given by the spectroscopic sum rule:(1.10)
where Z is the nuclear charge. The off-shell electromagnetic interaction is specified
by CTep, the square of the electron-proton elastic scattering amplitude. Equation (1.9) illustrates the intuitive idea that the quasielastic cross section should be the product of the probability
S(Es,
p) of finding a proton with 4-momentum pfL and the probabilityCTep of scattering from it (multiplied by a .Jacobian).
In the reaction, the A - 1 system may experience an excitation to any possible
bound or unbound state
lA-
r
>.
Because the Born-level cross section, Equation 1.9,ignores the final state of the A- I system, it can be considered to be the closure sum
over Ill-]*>. Data. from the Sacla.y 12C( e,
e
'p)
experiment [11] indicate that the rateis confined to low-lying A-1 states included in Em
<
100 MeV (see Section LA), sothe use of this cross section is appropriate.
One goal of many A(e, e'p) experiments is comparison of the experimental cross
sect.ions with those predicted using the P\VlA cross S<"ction (or a refinement thereof)
and a single-particle descriptiou of the nuclear structure, given by the Independent
Particle Shell Model (IPSM). In the IPSM, the spectral function is the sum of the
contribution from each shell:
where N; is the occupation number of orbital i (2::=; N; = Z), L;(Es) is the energy profile due to the finite lifetime of the one-hole state, and <p;(p) is the bound-state wave function. Except for the the least-bound shell, which may be partially filled,
[9,12-14]. The theory outlined in the previous section, with some refinements, has
had great success in explaining many features of the observed data. But there still
are unresolved issues, such as the failure of the spectroscopic sum rule, that can be
explored by measuring the reaction at higher
Q
2. The measured quantities most
rel-evant to the current experiment are the nuclear spectral function S(Em,Pm) and the
spectroscopic factors.
The spectral function is measured using Equation 1.9. First, the counts are binned
in Em and Pm using Equations 1.7 and 1.8. Then S(Em,Pm) is extracted by dividing
the cross section measured in an (Em, Pm) bin, corrected for experimental acceptances,
by <7cp· Distortions due to radiative effects are removed in a generalization of the ra
-diative correction procedure used in elastic 1
ll( e, e') scattering. Other distortions
from proton FSI and Coulomb distortions of the particle waves arc not removed from
the data, so the measured S(Em,Pm) are referred to as "effective" spectral functions.
Instead, the data is compared to the prediction in the Distorted Wave Impulse
Ap-proximation (DWIA) which includes these effects [9]. The resulting S(Em,JJm) can be
converted into proton energy and momentum distributions by integration over d3pm
and dEm, respectively. The treatment of radiation and distortions in the current
experiment is somewhat different (see Section V.A).
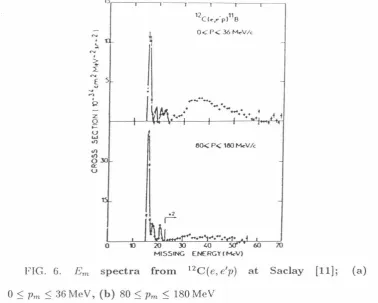
Figure 6 shows Em spectra measured on 12C at Saclay [11]. The Em acceptance
extends up to "' 60 MeV. The data clearly exhibit the presence of tbe lp and 1s
energy levels predicted in the nuclear shell model. The narrow 1p peak at 16 MeV
exhibits substructure at Em = 18 and 21 MeV clue to the final state of the A -1 =11B
12C(cc,,..-p)11B
.
Q z 0 ~ u w <I) <I) <I) 030 a:: u0 1J
.
....
0~ P._: 36 fvkV/c
..
...
-.
.... ·
.
.
-
...
.
..
.
.
60< P< 1&0 fvkV /c
60 70 MISSING ENERGYifvkV)
FIG. 6. Em spectra from 12C(e, e'p) at Saclay [11]; (a)
0 ~ Pm ~ 36MeV, (b) 80 ~ Pm ~ 180MeV
state has 74%, the ~- (2.12 MeV) excited state has 1~3%, the ~- (5.02 MeV) has 9%,
and higher excitations have 4% [9]. This indicates that all of the rate involves the
low-lying A - l states which are included in Em
<
100 MeV. The 20-MeV width of the 1s shell at Em = 38 MeV is due to the short lifetime of the 1s hole state.The identification of these peaks with the nuclear shell model states is confirmed
by the clear l = 1 and l
=
0 nature of the momentum distributions measured forthe shells, shown in Figure 7, and the good agreement with the Pm distributions
calculated in the DWIA using the IPSM spectral function (Equation 1.11). The
cp;(p) and L;(Es) used in the lPSM S(Es, p) are based on charge distributions from
elastic electron-nucleus scattering and separation energies from (p, 2p) [11 ,15]. The
good agreement. between the 12C( e, e'p) data and the DWIA calculation demonstrates that the single-particle model simultaneously explains the three different data sets.
1-<f)
z
w
0
0
30<E<SOMeV
so
100 150 200 2so
300RECOIL MOMENTUM (MeV/c)
PIG. 7. ls and lp Pm distributions from 12C(e, ~'p) at Saclay [11].
The solid and dashed lines are DWIA and PWIA calculations
re-spectively, with normalizations fit to the data.
magnitude and shape. This distortion of the Pm distribution is due to the FSI of the
proton, which arc generally calculated with an optical-model of the proton-nucleus potential [9,13]. The DWIA calculations are sensitive to the scattering kinematics [9] and can be subject to large theoretical uncertainties [13].
t
f
•
t
OWIAt
N
• t
4+
:::::- +
w 0~
9
n"'
??
*?
w
~
PWIA?
,
oQ
" ~
0
0 10 20 JO 40 , 0 GO II.
FIG. 8. A(e, e'p) results for the spectroscopic sum rule, from ref-erence [9].
connection between the nuclear transparency T and the measured fraction of the sum
rule strength is elaborated in Section V. B.
Part of the sum rule discrepancy may be due to performing the integrals over the
finite ranges of Pm and
E
m
imposed by experimental acceptances. Experiments with larger acceptance ranges exhibit smaller discrepancies[9]
.
In particular, one must becareful to take account of the large"' 15% strength at
IP
m
l
>
PJ (where PJ is the Fermi momentum) due to short-range correlations in the initial state. See Section V.B for the treatment of these issues in the current experiment. Another problem is uncer-tainties in the model of the proton FSI due to Pauli blocking, medium modifications, and nucleon-nucleon correlations [16]. Most of these uncertainties should be smaller
at Q2 ;:: 1 (GeV /c)2 [17].
A possible explanation for the remaining discrepancy is that the virtual photon
can couple to more than one nucleon because for Q2
<
0.8 (GeV /c)2 its wavelength1i
cJ
Q
is comparable to the nucleon radius RN ~ 0.8 fm. The expectation that theinteraction should be single-particle in nature at higher Q2 is consistent with the
observation of y scaling at Q2
the virtual photon resolves not just individual nucleons but also individual partons
therin. As a consequence there is the onset of the dominance of inelastic scattering
in the inclusive A( e, e') reaction, as shown in Figure 2.
In addition, treatment of the FSI should simplify at Q2 ~ 1 (GeV /c)2 where, due
to the shorter de Broglie wave length of the outgoing proton, the FSI are dominated
by nucleon-nucleon scattering. In Section V it is shown that at such high Q2, the
FSI produce a reduction in the proton flux without much distortion in the shape of
S(Em,
P
m)·
Given the theoretical uncertainties in the low-Q2 distortion calculations[13], it is important to verify the low-Q2
S(Em,
Pm)
with higher-Q2 measurements.Furthermore, since the strong coupling constant a5 decreases with increasing Q
2 ,
one expects QCD to enter the pcrturbative regime. Hence, the internal dynamics
and FSI of the struck proton could change dramatically at Q2
>
1 (GeV /c)2, possiblyleading to entirely new effects such as Color Transparency.
For all of these reasons, it is imperative to test the A(e, e'p) quasielastic scattering
mechanism at Q2
>
1 (GeV /c)2. The curr<'nt experiment represents the extension of
I.B. Color Transparency
The arguments leading to CT involve three assumptions. First, observing an
exclusive reaction requires the hadrons to ha.ve fluctuated to a small size- referred
to as a point like configuration (PLC)- at the time of the interaction. Second, the PLC experiences a reduced interaction with the nucleus, a phenomenon known as color screening. Third, the hadrons remain small while they propagate out of the nucleus. The three assumptions are discussed in the following sections, with special
attention paid to the A( e,
c'
p)
reaction. The process is shown in Figure 9 for the reaction A(e,e'p) with A =1H and A > 1./.8.1. Selection of Point Like Configuration
The first assumption can be supported by a simple pQCD model. As Q2 increases
and QCD becomes perturbative, the lowest order diagrams dominate the (quasi)
clastic scattering. Such a diagram is shown in Figure 10 for the case of
electron-proton elastic scattering in the Breit frame where q1
, = (0,
Qz)
(choosing zII
Q).
k
k
FIG. 9. Schematic indicating the 3-momenta involved m
-Q/6
-Q/6
-Q/6
Q/6
Q/6
Q/6
FIG. 10. Lowest-order elastic scattering. To lowest order in a8,
the scattering involves the minimum possible number of partons
{3) and gluon exchanges (2). The scattering is shown in the Breit
frame, where the proton momentum is changed in sign but not
in magnitude, and v
=
0. The quark lines are labeled by themomentum components along Q. For definiteness the quarks are
shown as having typical momentum values (Bjorken x = 1/3) before
and after the collision. (After Jennings and Miller [3].)
Unless the struck quark shares the momentum transfer with the other quarks, the
proton fragments and the reaction is inelastic. Hence, clastic scattering requires the exchange of two gluons (in the lowest order) of 4-momentum ,..., (0,
Qz)
and off-shell mass,..., Q. By the uncertainty principle, the gluons have a lifetime of,..., lifcQ and arange of,..., h/Q. Thus an elastic interaction only occurs if the proton happens to have
fiuduatC'd to a PLC of transverse extent b ;S
li/Q
before:> the interaction. At large Q2, b can be much smaller than R1., the equilibrium radius of the hadron. (Smalllongitudinal extent is guaranteed by Lorentz contraction.)
~---.
q
=
(
0,
Q)
-Q/2
Q/2
---Before
After
FIG. 11. The Feynman mechanism for elastic scattering. As in
Figure 10, the scattering is shown in the Breit frame and the quark
lines are labeled by the longitudinal momenta. Crosses indicate
the "wee" partons, which carry almost none of the longitudinal
momentum.
'"" (0,
-
Q
/2)
(see Figure11).
The momentum is reversed in the scattering, restor -ing the proton to its initial state without any gluon exchanges. At highQ
2 this diagram is suppressed, however, because the large acceleration of the struck quark produces gluon radiation (in analogy with electromagnetic radiation from accelerated electrons), making the interaction inela.'Stic.This reasoning leads to the most general argument supporting the formation of a PLC: the radiation of gluons is only suppressed if the color-neutral proton Ouctuates to a PLC with no residual color fields (in analogy with the vanishing of the radiation field of a zero-size electric dipole). This argument does not require the exchange of a small number of gluons between the partons, and therefore can apply at energies lower than the onset of pQCD. Unfortunately, it is not known what
Q
2is high enough for gluon radiation to prevent elastic scattering from non-PLCs.
The selection of the PLC may be responsible for the constituent counting rule scaling behavior predicted by pQCD and observed in many exclusive processes for
Q
2 2:, 5(GeVjc)2. Consider a reaction involving two (possibly composite) particles
FIG. 12. The A+B-+ C+D exclusive reaction. Particle X(= A,
B, C, or D) has nx elementary constituents (nx
=
1 is allowed).The total number of constituents is N = nA
+
na+
nc +no.the interaction (see Figure 12). If the momenta involved are much greater than the
particle masses, then constituent counting predicts the cross section scales
[19)
:
!(GeM)/ sin2N-4(8cM/2)
(Q2)N-2 (1.12)
Heres is the Mandelstam invariant and f(8c111 ) is a function of the center of mass
angle 8c111. The relation
Q
2=
s sin2(8cM /2) is used.
In the PLC-dominated mechanism, the factor 1/Q2 for each additional constituent
represents the geometric probability"'
(
b
j
R,.)2 that its transverse separation from the location of the scattering is< b = hjQ. (The factor l/Q2 arises for the outgoing con -stituents as well because the probability of a PLC fluctuating back to a full-sized hadron is the same as that of tlw full-sizf'd hadron fluctuating to the PLC.) Equa-tion 1.12 appears to explain the scaling observed at 8c;111
=
90° and s ,2:: 2 (GeV /c)2for the reactions 1H(p,2p) and 2li(!,p)n (see Figure 16 and reference [20]). For
electron-hadron scattering, the scaling results in
where Fh(Q2) is the elastic form factors of a hadron with nh constituents. This
scaling is observed in the data of Figure 13 for
Q
2 ~ 5 (GcVjc)2. In the case of elastic
electron-proton scattering, relevant to the current experiment, the scaling can be seen
as the limit of the dipole form (Equations 1.4 and 1.5) of the electric and magnetic
form factors:
l.
cv / _
1. GP _ [0.71 (GeV /c) 2j2
1m M jip - 1m E - Q4
Q2~= Q2~= (1.14)
The onset of the scaling behavior is not conclusive evidence of the onset of pQCD.
The dispersion sum rule approach argues that the observed scaling is accidental and
that the true scaling does not set in until higher
Q
2. For example, Bakulov and
Radushkin [21] claim that the Feynman mechanism dominates the pion form factor
for values of Q2
up to 10 (GeV /c)2•
I.B.2. Color Screening
In QCD the color field of a color neutral object vanishes as the size of the object
is reduced. This occurs because the fields of the individual quarks and gluons cancel
each other as the size is reduced, in analogy with the electric dipole in QED. Thus, the
interact ion of the PLC with the nucleus vanishes as its transverse extent b becomes
small. In pQCD for small b, two-gluon exchange is the dominant scattering mechanism
and the PLC-nucleon cross section is [27]:
b
2
CTPLC,N ~ CTh,N R~, (1.15)
where CTh,N is the standard hadron-nucleon cross section and Rh is the radius of the free
hadron. The cross section vanishes as b - t 0, in contrast with black-disk scattering
where the cross section is
1r( b
2+
R
'fv
)
- t1r R
'fv.
Although the two-gluon approximation is probably not v<'ry accurate for Q2
::;
1::'"
!
~---' · 1(1 •
v·
.', '"
' l
r;:
i
""
'
"'"
"
0.':~:
I
1
/f
1
:
::~:
·
"':
•
I > 0 (JI
I()" 4
l
I . .!... -· 10 4 8 12
Q? ((>('V/d
0.4
a. ~ a.::l!
<..?
0
0.3 0.28
0 10 20 30
02 (tGeVIc)2]
FIG. 13. Constituent scaling in hadron form factors. The
left-hand figure, taken from reference [22], ·exhibits approximate
dimensional scaling (Equation 1.13) at Q2 ;?: 5 (Ge\1 jc)2
for the pion,
proton, and neutron. More recent proton data is shown in the
right hand figure, taken from reference [23].
range than pQCD. For example, Povh and Hi.ifner [24] independently arrived at an
analogous form through the study of hadron-proton cross section data. They deduce the RMS hadron radius Rh from the elastic scattering slope parameter,
(1.16)
where du'f.~fdt is the differential elastic cross section and l = Q2 is the Mandelstam
invariant. The proton and pion radii are found to be Rp
=
J3bppj2=
0.82±
0.01 fm,R"+ = J3b1rP - R~ = 0.64
±
0.01 fm, and R7r- = 0.65±
0.01 fm, consistent with themeasured electromagnetic radii. They find that the total cross section is given by
(1.17)
7l
.s
t,
GO p p
30
-n· n
20 K• ~ K
-10 <I> J I <lJ ---,+---,
0
b [Gev-2)
0 5.0 10.0
PIG. 14. Data for total cross sections a:,~t vs. the experimental
slope parameters b for hadron-proton reactions at c.m. energy
.jS::; 16GeV.
for Rh between 0.84 (for pp) and 0.20 frn (for J j?/;p). (see Figure 14). Note that the
radii relevant to the elastic and total cross sections are the equilibrium radii and are not reduced by the formation of a PLC because the clastic slope parameters are
measured at
t
~ 0 and because the total cross sections do not represent exclusiveprocesses.
Direct evidence of color screening has been seen in the Fermilab experiment E665 [25] in the same
Q
2 range as NE-18. The experiment measured A(Jt,ft'p0) and
A(ft, 1t' <P) production on deuterium, carbon, calcium, and lead in deep-inelastic kine
-matics. In a simple model of the scattering, the photon fluctuates to a virtual
quark-antiquark pair with transverse extent b "" 1/Q (where
Q
2 is the muon momentum transfer) before it enters the nucleus, where it is scattered on-shell through an "elas-tic" interaction with a nucleon. The distance travelled by the meson before obtaining
full size is lh ~ fwjc4mv!:::.m [26] where the energy loss is v ~ 200GeY, the p0 or <P
mass is mv "" 1 GeV /c2, and the typical level splitting of quarkonium is m1• '""'0.7-1 GeY /c2 (based on the mass cliiTcrcnces of the
of the scattered muon and exactly two oppositely charged hadrons (from the meson decay). Because the recoil nucleon was not detected, kinematic cuts were used to select the incoherent scattering off of individual nucleons (describe above) from
co-herent scattering from the entire nucleus. The data show an increase in T and a
decrease in the A-dependence with increasing Q2
, consistent with the onset of Color
Transparency. Thus, hadron-nucleon reactions exhibit color screening in the
Q
2 rangeof NE-18. Note that this does not imply that Color Transparency occurs in A(e, e'p) and A(p, 2p) because for these reactions the PLC would be produced- if at all-by a different mechanism. Furthermore lh in E665 is larger than expected in A( e,· e'p) and A(p, 2p) experiments at the same Q2 because of the large time dilation.
Frankfurt, Miller, and Strikman [27] find additional support for the phenomenon of color screening in the observation of precocious Bjorken scaling in deep inelastic lepton-proton scattering, jet production in deep inelastic lepton-nucleus scattering
(which suggests that Equation 1.15 may be valid forb
:S
0.25 fm2), and high energydifrractive processes.
I.B.3. Lifetime of Point Like Configuration
The PLC takes a finite prop<'r tim<' to fluctuate back to its full size. Because the
PLC is moving at momentum Q, time dilation guarantees that at some Q2
the PLC will be able to propagate out of the nucleus before returning to full size.
assumes that the quarks expand back to their usual separation at the speed of light,
taking a time T ~ R~t/ c. The PLC can propagate through a length
(1.18)
of the nucleus with reduced cross section, where 1
=
E~/ Mh is the time dilationLorentz factor. If the hadron is a nucleon, Rh = RN ~ 0.8 fm, and the PLC can have
a significantly enhanced probability of escaping the nucleus, even for modest values
The naive parton model ignores the basic quantum behavior of the system. For
example, the virtual gluons and sea quarks can fluctuate back into existence at radii
"' Rh on a smaller time scale. The more realistic "quantum diffusion" model assumes
the expansion takes a total time given by the average value of the dominant pQCD
energy denominator, IT=< li/(E~. - E~)
>.
Here E~ and E~. are the energy of thehadron and its intermediate state.
The key point in this model is that the PLC is not the ground state of the free
hadron hamiltonian (which has a much larger radius), and therefore represents a
fluctuation to a state with MPLC
>
l\1h· By the energy-time uncertainty principle,this off-shell state can propagate a distance:
he 2hp'
l~t
~
E' - E' - c26_M2'PLC h
(1.19)
where p' is the momentum of the outgoing hadron (and of the PLC) and 6.M2
M~LC - M~. The right-hand approximation is vctlid for p' / c
»
1\1 PLC, l\1h. Tl1cauthors use 6.M2 = 0.7(GeV/c)2, which corresponds toT~ 0.5fm/c. (For easier
comparison with the naive parton model result, 1
=
E~/ Mh has been used instead ofThe other model of PLC expansion length commonly used to predict CT effects,
h*IP LC(t
=
0)>.
Here the Jh*>
are assumed to have equal energy E~, so p~.=
VP
12+
M;-M~..
Assuming the PLC is dominated by the nucleon IN>
and alow-lying nucleonic excitation JN1
>
of mass Af1 and momentum p~, the decoherencedistance is:
(1.20)
The result is similar to Equation 1.19. The underlying physics is basically equiva-lent, except that here the intermediate state is assumed to have the same energy as the outgoing proton, and so it is the position-momentum uncertainty principle that applies.
One of the largest differences between models of CT in !l(e, e'p) is the value of 6M2 or M
1 assumed. Larger
h
(smaller 6M2• Atfi) indicate that CT can set inat smaller Q2
. The CT predictions use 6M2
=
0.7-1.1 GeV /c2 [6] or /111=
1.23-1.77 GeV /c2 [3]. Clearly these ranges arc only estimates.
A complication to this picture that has apparently been overlooked in the pub-lished theories is the possible dependence of M PLC on
Q
2. Specifically, as Q2 increasesand b
.:S
h/Q decreases, the overlap< P
LCIN>
of the PLC with the ground state also decreases. Therefore, in the hadronic basis, the ov<'rlap<
P LCJh*>
with higher-mass states must increase. Thus, the !11 pu· may incrc>asc withQ
2, lessening the PLCI.B.4. Color Transparency Exper·iments
Due to the difficulty of performing realistic QCD calculations at the relevant
energy scales, there is no theoretical consensus on either the
Q
2 value at which theproduction of the PLC begins to dominate elastic scattering or the dominant mass
scale M PLC (or M1 ) of the PLC configuration. Thus, these values must be constrained
by experimental searches for the onset of CT.
The first experiment to investigate CT was performed by Carroll el al. (28], using
simultaneous measurements of A(p, 2p) and H(p, 2p) reaction rates at Brookhaven
National Laboratory. To determine T they divided the A(p, 2p) rate by the rate
expected in the limit of full CT. This rate was given by the product of the measured
proton momentum distribution and the H(p, 2p) rate, corrected for the theoretical variation of the elastic cross section and the difference in the experimental acceptances for t.he two reactions. Their results showed T increasing for incident proton momenta from 4.5 to 9.5 GeV /c, but then decreasing from 9.5 to 13 GeV
jc
(Figure 15). Becauseof the subsequent decrease, the increase at lower momenta cannot be taken as an
unambiguous signal of CT. Ralston and Pire have noted that the free proton-proton cross section oscillates about the s-10 behavior predicted by the pQCD constituent
counting rule, indicating the interference of a soft process with the pQCD amplitude
(29]. If tbe soft process is suppressed in the nuclear environment, this would lead to the
observed bump in Tat 9.5 GeV /c [29] (see Figure 16). In contrast, the electron-proton
interaction is well-understood and its cross section varies smoothly as a function of Q2
. Thus the A(e, e'p) reaction allows an important independent measurement of the
Q
2I 00
>-. 0 50
( )
c
QJ
s....
~ 020
tn
c
<0 0 10 L
E-0.05
05 >. 0 c QJ L.
"'
0.Q.~.
·-en:
c
<0
L.
f
-0.1
0
'",I,,.,
,
.
T,,
,
,l
,
"":
.,
...,
f ,-,-r-t'l"T""'1'"""'T'' (a Vanous Nuclc~ _1 • - LJ . - - t-.
<> -c ...- - - - z.. -
t
>< - AI r - ; , . ..ljJ '-i
/
0 -
¥
0 - 12 G<!V/c
t
f*t
t
t4
.
>O
I ...
~1
•• ''I',,' I''' ,It''
2.5 5 7.5 10 12.5 15Incident Momentum Gev/c
FIG. 15. T measured in A(p, 2p) [28]. The graphs show (a) the
transparency vs. beam momentum for nuclear targets, (b) the
transparency vs. effective beam momentum for the aluminum
tar-get. The effective beam momentum is given by the actual beam
momentum, coupled with the measured fermi momentum along
>-u :z. w a:: < 0... C/) :z. < a:: f
-FIG. 16.
erence [29],
1.0 0.8
0.6
0.-!
0.2
0.0
R,.---.
8 6 4 2 2 2 3 3 (a) 4In s(GeV2)
AE:27
(b)
4
ln s(GeV2 )
Correlation of T and dajdt In A(p, 2p). From
the graphs show (a) the energy dependence
ref-of
R1 (s) = const x s10da jdt for high-energy ]J]J elastic scattering at 90°
c.m. angle [30] compared to a model including the interference of
a soft Lands hoff-scattering process with the pQCD amplitude, (b)
the prediction for oscillating transparency for A = 27 compared
ll!Casurcd as a Lest or systematics.
The experiment was performed in End St<ttion A at the Stanford Linear Accelera-tor (SLAC) using the electron beam from the Nuclear Physics Injector (see Figure 17). Electrons and protons were detected in coincidence by the 1.6 GeV /c and 8 GeV /c magnetic spectrometers, respectively. A schematic of the experiment is shown in Figure 18.
The kinematics used in the analysis arc summarized in Table 1. For the nuclear targets, multiple proton angle settings were used in "perpendicular kinematics" to measure the desired range of Pm (see Figure .5 or Section III.F).
1.6 GeV
Spectrometer
fZl
Quadrupole
Magnets
m
Toroids
90
°
Dipole Magnet
Fixed and Moveable Slits
Chamber
To Beam Dump •
15
°
Dipol
e
Magnet
s
8GeV
Spectrometer
End Station A
k
From NPAS
injector, A line
Scattering Chamber
1.6 GeV/c Spectrometer
8 GeV/c Spectrometer
FIG. 18. Schematic of experiment NE-18
To Beam Dump
TABLE 1. Approximate NE-18 Kinematics. Here E is the beam energy, E' and 016 are
the momentum and angle seUings of the 1.6 GeV /c spectrometer (used to det.ect electrons),
and p' and Bs are the momentum and angle settings of the 8GeV /c spectrometer (used to
detect protons). The exact kinematics are given in Table 6.
Q2 E
E'
(}16 p' Bs(GeV /c)2 (GeV) (GeV) (degrees) (GeV /c) (degrees)
1 2.0 1.4 36 1.20 35.0-54 .G
:3 3.2 1..5 48 2.45 27.7-33.3
5 4.2 1.5 53 3.54 18.5-22.6
6.tp-e distribution is corrected for the absorption of outgoing protons in the target
and spectrometer materials.
The electron and proton particle tracks measured in the spectrometers are
con-verted to 3-momentum at the target by using matrix models of the spectrometer
optics. These yield the approximate 4-momentum of the proton before the collision
via Equations 1. 7 and 1.8. The spectral function
S(Em,
Pm)
is extracted as discussedearlier (in Section I.A.2).
Using model spectral functions fit to this and previous data, the PWIA is used to
predict the rate measured in the absence of FSI. We define the nuclear transparency T
as the ratio of the measured coincidence rate to the calculated PWIA rate.
Compar-ison ofT at
Q
2=
1, 3 (GeV /c)2 (where CT is not expected to occur) with the value expected using conventional nuclear physics tests the saturation of the spectroscopicII. EXPERIMENTAL APPARATUS
II.A. Electron Beam
The current experiment was performed in End Station A at SLAC usmg the
electron beam from the Nuclear Physics Injector [31]. The beam energy was E =
2.015-5.120GeVjc (see Table 6). Average currents were 0.1-15J.LA, delivered in 1
-2 J.LS pulses at a rate of 120Hz. The beam was transported to End Station A through
the A-Line of the beam switch yard. The energy spread of the beam is defined by
slits following eight momentum-analyzing dipole magnets (see Table 2).
Two ferromagnetic toroids roughly 10m upstream of the target measured the
beam charge. The toroids were calibrated at least once an hour by passing a known
charge through a wire that passed through them. The charge measured by the two
TABLE 2. Full width 26E/ E of the energy defining slits during the different
experi-mental kinematics (cf. Table 6). An entry of"*" in the target (or angle) column indicates
that the corresponding slit width was used for all targets (or angles), except for the two
exceptions in the second half of the table. These exceptions, which effect the resolution
but not the count rates, are ignored in the calculation of the PWJA prediction for the
experiment (Section lV.A).
1.04,1.16,3.06,3.23
1.21
.').00,5.14,6.77 ,6.85
1.16
5.00
aonly 1 out of 6 of the runs
Target
*
*
4 em 111
6%C
Bs 26E/E
(degrees) (%)
* 0.3
* 0.2
* 0.4
43.29 0.2a
ll, described in reference [32].
II.B. Targets
The targets, listed in Table 3, were mounted on remotely moveable target ladders
in a sealed vacuum scattering chamber. There were two target ladders, one holding
the solid targets, and the other the cryogenic and "dummy" targets. Thin aluminum
entrance and exit windows, described in Table 4, allowed the beam and scattered
particles to pass through with minimum energy loss and multiple scattering. The
targets were positioned at normal incidence to the beam.
The standard SLAC cryogenic liquid targets (I II and 2H) were used. The liquid
was contained in thin Aluminum target cells made of Coors aluminum beer can stock.
The liquid was circulated at a flow rate of 2 m/s, with pressure and temperature
mon-itored by pressure transducers and platinum resistors. These were used to calculate
the target density.
The small (
<
1%) contri bu Lion to the coincidence rate by the 0.0762 mm and0.1219 mm thick upstream and downstream end caps was measured using replica
empty cells (the dummy targets) with aluminum walls at the same positions but 9.5
times thicker. In the analysis, the inferred endcap coincidence rate is subtracted from
TABLE 3. Target characteristics. Targets are referred to by their nominal lengths
(liquid and dummy targets) or radiator thicknesses (solid targets). Purity of solid targets is
effectively 100%. The lengths and thicknesses of the liquid targets are given after applying
the expected 0.996 shrinkage factor in cooling to 21 K. The dummy targets are two aluminum
sheets of equal thickness at the positions of the endcaps of the liquid targets.
Name Material Density Length Thickness Purity
(g/cm3
) (em) (% r.J.) (%)
4 em 1H Liquid H2 0.0705 4.011 0.461 99.94
4cm 2H Liquid D2 0.1701 4.011 0.557 99.68
15cm 2H Liquid D2 0.1701 15.680 2.176 99.68
2% c 12c 2.193 0.4097 2.104
6% c 12c 2.193 1.1730 6.024
6% Fe 56 Fe 7.829 0.1064 6.019
12% Fe 56 Fe 7.829 0.2098 11.87
6% Au 197 Au 19.157 0.0206 6.137
12% Au 197 Au 19.157 0.04013 11.96
4,15cm dummy AI 3004 and 2.72 1.270 1.461
AI 5052 2.68 0.6096 0.691
II.C. The Magnetic Spectrometers
Electrons were detected in the 1.6 GeV /c magnetic spectrometer [33] and protons in the 8 GeV
jc
spectrometer [34]. Both arc vertical bend spectrometers with focusingin momentum and scattering angle, yielding good ('"" 0.1
%)
resolution in particle 3-momentum. The optics focus point-to-point from target to nwmentum focal plane in the bend plane and parallel-to-point in the horizontal plane. Scintillator planes inused by the Beam Control System. The length and thickness listed arc averaged over the
wires and the gaps between them. The hymen and chamber windows provide the vacuum
isolation of the scattering chamber. The endcaps and cell wall are the ends and side of the
aluminum can encasing a liquid target. The cell wall thickness includes the contribution of
the liquid target flow guide. The mylar insulation provides thermal isolation of the cryogenic
liquid targets. The endcaps, cell wall, and insulation do not apply to solid targets.
Object Material Density Length Thickness
(mm) (% r.l.)
Wire Array AI 2.70 0.03990 0.0449
Entrance Hymen AI 2.70 0.02540 0.0286
Upstream Endcapa AI 5052 2.68 0.07620 0.0864
Downstream Endcapa AI 3004 2.72 0.12192 0.1403
Cell Waua AI 3004 2.72 0.12700 0.1461
Insulation" Mylar 1.39 0.06350 0.0221
1.6 Chamber Window AI 5052 2.68 0.12700 0.1440
1.6 Air Gap Air 0.00121 132.588 0.0434
1.6 8ntrance Window Mylar 1.39 0.35560 0.1237
8 Chamber Window AI 5052 2.68 0.3048 0.3457
8 Air Gap Air 0.00121 160.0:2 0.0524
8 Entrance Window AI 5052 2.68 0.25400 0.2881
selection of coincident electrons and protons.
JJ.C.J. 1.6GeVjc Spectrometer
The 1.6 GeV
jc
spectrometer, described in more detail elsewhere [33,32], is a 90°vertical bend dipole spectrometer (see Figure 19). It has a maximum momentum of
1.5 GeV
jc,
a solid anglet:.n
~ 3 msr, and a momentum bite of ±6%. Note that thequadrupoles used to increase the solid angle for SLAC experiment NE-ll (reference
[32]) were not used in the present experiment.
After passing through the dipole magnet, electrons pass through a 1.5 m long gas
Cerenkov counter filled with C02 at atmospheric pressure (see Figures 20 and 21).
Following this, they pass through two crossed layers (XD and YD) of 0.5 em thick,
11.1 em wide plastic scintillators, 3 pairs (A, B, C) of X -Y drift chambers, another ho
-doscope pair (XU and YU), and two rows (PA and PB) of 10.8 em-thick (6.4 radiation
lengths) lead glass shower counter blocks.
Each drift chamber bad two planes of 31 X wires and two planes of 21 }·· wires
spaced at 2 em intervals. These provided an effective wire spacing of 1 em and a cover
-age of approximately 40 em by 60 em. For paired wire hits, the drift time information
allowed location of the track to a resolution of around ±0.3 mm. The Cerenkov
and shower counter provide electron identification and pion rejection, and the ho
-doscopes provide trigger and timing information. The scintillators and segmented
shower counter also provide position information used to remove tracking ambiguities.
The 1.6 GeV /c spectrometer detector package was the same as in SLAC experiment
NE-ll, except that all of the scintillators had photomultiplier tubes (PMT) on both
1.6 GeV Hut Detector
Dipole
Bending
Magnet
Fixed and
Moveable Slits
Scattering
~::::2,Chamber
2-~
7S<SA6
Pivot
FIG. 19. Exterior side vtew of the 1.6 GeV /c spectrometer, as
configured for the present experiment. The momentum analysis is
provided by a 90° dipole bending magnet, with optical properties
optimized by the use of rotated entrance and exit pole faces and
other pole tip shaping (31]. The detectors are above the exit of
Upper
Scintillators
Lower
Scintilla tors
Meters
1
.
0
0.5
0
Lead Glass
Shower
Counter
~
•tt
~On
Chambers
~Focal
Plane
...
Cerenkov
Counter
11-93
7545AS
FIG. 20. Side view of 1.6 GeV fc spectrometer detector hut with Y1 6 increasing to the left. Particles are incident from the bottom.
The light guides of the YU scintillators, shown bent in the figure,
were straightened before the experiment (see text for a description
=~I
I I I I I
Meters
1.0
xu
ex
BX
0
.
5
AX
XD
0
CK
)
Y,6
)
FIG. 21. Side views of the 1.6 GeV jc detector hut showing the
sizes and positions of the detectors to scale. With the exception
of the lead glass shower counters, the thicknesses of the detectors are not to scale.
jPB
IPA
YU
CY
BY
AY
YO
II. C. 2. 8 G e V / c Spectrometer
The 8 GeV /c is a 30° vertical bend QQDDQ magnetic spectrometer (Q
=
Quadrupole and D = Dipole, see Figure 22). It is discussed in more detail in reference
[20], which describes an experiment that took data with the 8 GeV /c spectrometer in
the same configuration (sec also references [32,34]). In order to increase the angular
acceptance of the 8 GeV /c spectrometer, the polarities of the first two quadrupoles
were reversed from the standard configuration. In this large acceptance tune, the
spectrometer has a maximum momentum of 4.5 GeV /c and a factor of
>
4 largersolid angle. See Figures 23 and 24 for raytrace diagrams showing the optics of the
large acceptance tune.
The detector package also differed significantly from previous experiments {see
Figures 25 and 26). The first detector encountered by a proton in the shielded hut was
a 3.1 m long gas Cerenkov counter, which was filled with atmospheric Freon 114 (n =
1.00140) at the Q2 = 5, 7 (GeV /c)2 kinematics but evacuated at Q2 = 1, 3 (GeV jc)2
.
Intended to provide 1r+ identification, it was not necessary in the analysis because
the pion rate was only ~ 10% of the accidental coincidence rate (see Section III.A).
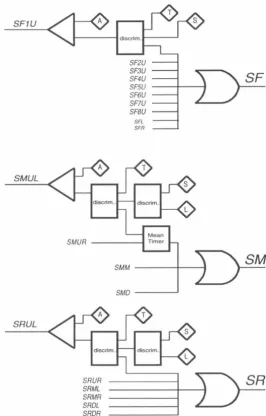
Following the Cerenkov were the front layer of plastic scintillators (SF), ten
multi-wire proportional chambers, two planes of scintillator hodoscope (NBS), and two
more scintillator layers (SM, SR). The lead glass shower counter used in previOus
experiments was removed.
For optimal timing resolution, the scintillators were read out on both sides by
PMTs (s<'e Figure 26). The three scintillator planes were refurbished and repos
i-tioned before the current experiment. The refurbishment included the replacement
of all scintillator material with new Bicron BC-420 fast scintillator material, and t.he
replacement of the PMTs with fast (1.5 ns rise time) Amperex XP2020 phototubes
Quadrupole Focusing Magnets
Dipole Bending
Magnets
Target Pivot Platfonn •
Bectron
Beam
-FIG. 22. Exterior side v1ew of 8 GeV /c spectrometer, as con-figured for the present experiment. The momentum analysis is provided by the two dipole magnets, with focussing provided by the three quadrupoles. The detectors are above and to the right of the exit of the dipole magnet, inside the concrete shielding hut.
7545A7
The SF plane wa'5 completely replaced. The eight new scintillators are 0.9525 em thick, 6 em wide, and 45 em long. The scintilla.tors a.r<' vertically oriented, layered
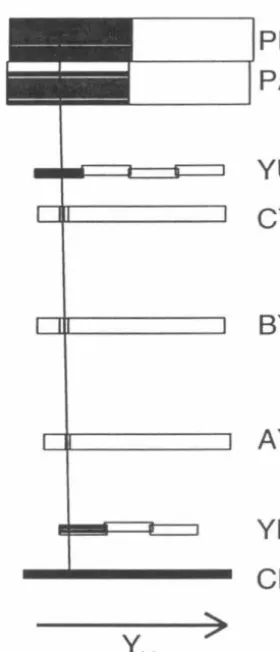
0 5 10 15 20
z (m)
FIG. 23. Vertical (bend) plane magnetic optics of the 8 GeV fc
spectrometer's large acceptance tune. Rays are started at <I> from
- 18 to 48 mr in 6 mr increments (bottom through top sets of curves
at Z
<
2m) ando
from - 5% to .5% in 1% increments (bottomthrough top set of rays at the tilted momentum focal plane at
Z ~22m). The rays are propagated forward using the optics model
described in Section IV.G and are cut off if they intersect an
aper-ture.
20
0
X
-20
0 5 10 15 20 25
z (m)
FIG. 24. Horizontal plane magnetic optics of the 8 GeV /c
spec-trometer's large acceptance tune. Rays are started at X from
-5 to 5 em in 1 em increments and
e
=
-28 to 28 mr in 4 mrincre-ments (bottom through top set of rays at the angle focal plane at
CK SFT1 P2 T3 P4 T5 P6 T7 PB T9 P10 NBS SM SA
I
0
Meters
I
I
I0.5
I
I
1.0
CK SFT1 P2 T3 P4 T5 P6 T7 PB T9 P10 NBS SM SA
PIG. 25. Top and side views of the 8 GeV /c spectrometer
de-tector stack, to scale (detector thicknesses are exaggerated). The
scintillator planes SF, SM, and SR were used to identify charged
![FIG. 1. Farrar et al. [2] T prediction for A(e, e'p) on A= 12 (upper](https://thumb-us.123doks.com/thumbv2/123dok_us/1118933.1141089/15.535.101.450.166.409/fig-farrar-et-al-t-prediction-e-upper.webp)