THE 160 + 160 REACTION
Thesis by Harold Spinka
In Partial Fulfillment of the Requirements for the Degree of
Doctor of Philosophy
California Institute of Technology Pasa.dena, California
1911
ACKNOWLEDGMENTS
I would like to
thank
the Kellogg Radiation Laboratory faoulty, staff and graduate students for assistance and encouragement during this research. Iam
thankfulto
Professor W.A. Fowler and Drs. J.W. Truran and W.D. Arnett for their interest and insight into thea.strophysical a.spects of the problem. I would also like to express my gratitude
to
Professor T .A. Tombrello for his supervision and suggestions and to Dr. J .R. Patterson for his help in the early stages of the experiments.I
am
especially indebted to Dr. Hubert Winkler for his active and enthusiastic participation in all pha.ses of this work.Finally, I wish to gratefully aclrnowledge the financial
assistance from the National Science Foundation during
my
graduate studies. This research was supported in part by the National Science Foundation (op - 9114,GP -
19887) and the Office of Naval Researchiii -ABSTRACT
The 160 + 160 total reaction cross section was measured at six energies between E = 6.80 to 11.85 MeV near the astrophysical
cm
region of interest. Angular distributions and cross sections for the production of protons, alphas and deuterons were obtained with
counter telescopes in a differentially pumped gas target. No
3
He or3H
were observed. Cross sections for the formation of31S
and30
p were measured by detectingthe
betas from their radioactive decays. The angular distribution and cross section for production of neutrons was obtained with a "long counter" at E = 12 MeV,em
demonstrating that the 160 (160 ,pn) process accounts for over 90
%
30
of the P formed at this energy. The presence of such three body breakup reactions made the experimental determination of the total cross section difficult. Finally, the 160 + 160 -+ 120 (g.s.) + 20Ne (g.s.) reaction was studied with a coincidence technique at
E
= 12 MeV. cmGamma spectra were taken at several energies for a number of targets using Ge
(Li)
counters. Gamma lines from nuclei produced in16 16 .
both two and three body exit channels from 0 + 0 react~ons were observed. In addition, the gamma yield as a function of bombarding
16 16
energy was measured in 50 keV (c .M.) steps for both 0 + 0 and 12
0 + 120 • The 160 + 160 gamma. yield is smoothly varying,
12
12
C + C reactions •
Nearly all cross sections were measured relative to the
16
0 +16
0 elastic scattering at~ab
=45
0to
avoid the problems with direct current integration o£ heavy ion beams in gas targets. A new, more precise determination of the elastic scattering cross section at8
em
=
900
was made for E =
7.3
toIh.h
MeV in steps cmof 100 keV (C .M.). A previously unknown anomaly was observed near E
em
==10.5
MeV. Elastic scattering cross sections were also obtained for l2C + l2c insteps
of60
keVC.M.
energy fromEcm
=3.9
to8.0 MeV at 8 ::0 90 0
• In both cases, gas mixtures were used in the cm
v
-TABLE OF CONTENTS
INTRODUCTION
The Problem
The Expected Results
The Experimental Methods
ELASTIC SCATTERING
Introduction
The Differentially Pumped Gas Target
Experimental
Results
GAMMA RAYS
Introduction
Ge
(Li)
Detector Spectra
yYield
VS.Energy
CHARGED PARTICLES
Introduction
Experimental
Data Analysis
ACTIVATION METHOD
Introduction
Experimental
Data Analysis
Results
NEUTRONS
Introduction
page 1
5
15
18
21
21
33
42
43
56
62
65
90
Experimental
Data Analysis
12C
+20Ne PRODUCTION
Introduction
Experimental
Data Analysis
Results
CONCLUSIONS
APPENDIX
I:APPENDIX
II ~C
+C and C
+0 Elastic Scattering
12
12
The C + C Y Yield VB. Ecm
BIBLIOGRAPHY
TABLES
142
146
152
153
157
164
167
177
181
1
-INTRODUCTION
The Problem
16
16
A study of the 0
+
0 reaction was made at energies near and below the Coulomb barrier (E=
7 - 12 MeV) because of itscm
pos sible importance in astrophysics. Cross sections to all exit channels as a function of energy are the quantities of interest for astrophysics, and numerous experimental techniques were employed to measure these cross sections.
The astrophysical interest in this reaction is related to the quest
to
explain the observed elemental abundances. Nuc1eosyn-thesis is presently believed to occur in large bodies of gas (stars t the primeval fireball, etc.). In high temperature regions of these bodies Hydrogen is converted to Helium, Helium to Carbon and Oxygen, and these to heavier elements upto
the iron region.90
Specifically, conditions are currently envisioned (T O! 2 - 4 X 10 K,5 8 3
p - 10 - 10 gm/cm and time scales of seconds to days) at a cer-tain evolutionary stage in some stars where Oxygen is present in
16
16
large quantities and burns by 0
+
0 nuclear reactions.Quiescent Oxygen burning in evolved stars was studied by Cameron (1959) and Tsuda (1963). The important exit channels for these calculations and the respective estimated branching ratios
were 31 S
+
n 10%, 31p+
p 50%, 100/0,16 16
the 0
+
0 total reaction cross section varied from 7 to 9 fm.) The physical conditions in the star were a central temperature of9
0 5 / 3T - 1.3 X 10 K, a density of p - 10 gm cm and a time scale of
5 7
10 - 10 years. The main products of Oxygen burning were the a-nuclei 24 Mg , 28Si and 32S.
The inclusion of a number of neutrino formation processes by Fowler and Hoyle (1964a) for temperatures above about 1 X 10⁹ oK altered the previous conclusions. Higher burning temperatures are required for quiescent Oxygen burning in order to counterbalance the neutrino energy losses from the star. The particular physical conditions considered were a star of total mass M ~ 10 solar masses,
9
0temperatures of T ~ 2.1 - 3.0 X 10 K and time scales on the order of days. Above T - 3 X 10
9
0 K photodisintegration of theOxygen via 16 O(y ,a) reactions was expected to become important. limiting the temperature range for Oxygen burning. Chiu (1968,
1966) also considered this case for a more massive star (M - 30
90
solar masses) and a similar temperature T - 2.5 X 1 0 K . In addition, a number of Oxygen burning stellar models were con-structed by Rakavy, Shaviv and Zinamon (see Rakavy (1967a,b,c».
Truran and Arnett (1970) discussed nucleosynthesis in explosive Oxygen burning as a means of producing elements with
14
:s
Z :S 20 from supernovae. They were able to reproduce both the elemental and isotopic abundance features observed in the solar system for these nuclei by assuming densities of 105 ;$ P ;$ 1063
9
03
-The time scales were on the order of seconds to minutes. Truran and Arnett speculated that the Oxygen burning might occur in a shell of matter not necessarily at the center of the supernova (see also Arnett (1969a,b)).
Most of these reactions do not occur at E ;: kT Oo! 250 keV cm
because the cross section at this energy is extremely small. Instead, the majority take place near E , which is the energy at the maximum
o of the product
(
Maxwell-B1~ltzmann distributiOn)of 0 energies (
Coulomb barrier penetratiOn)
• 16 16
factor for 0
+
0The full energy width at 1/e maximum of the distribution of the number of reactions occurring is .6 (see Fowler and Vogl (1964b) or Fowler, Caughlan and Zimmerman (1967). For 160
+
160 reactions at T=
3 X 10⁹ oKE
=
8.1 MeVo .6
=
30 4 MeVMost astrophysical nuclear reactions have a cross section too small to be measured at or near the corresponding E 0
Conse-o
quently, cross sections must be extrapolated down many orders of magnitude to the vicinity of E •
o
4
-since the large number of open exit channels and the presence of three body breakup reactions make the experimental determination of the total cross section difficult.
16 16
The 0
+
0 reactions are also interesting from the point of view of nuclear physics. Heavy ion reactions are quite complicated because of the large number of nucleons in both target and projectile. Yet considerable information on nuclear structure of the heavier elements has been derived from heavy ion reaction data. Elastic and inelastic scattering, Ericson fluctuations t transfer reactions and excited state lifetinles are commonly measured. However t few heavy ion reactions have been studied to derive cross sections and angular distributions for all exit channels present. Such a task is monumental at energies far above the Coulomb barrier where there are a large number of open channels, and normally reaction crosssection measurements are confined to cases where at least one reaction product is radioactive. A thorough study has been made
12 12
at sub-Coulomb barrier energies of the C
+
C system and strong cross section fluctuations were observed (see Almqvist (1960, 1963), Bromley (1960, 1961) and Patterson, Winkler and Zaidins (1969». Weaker structure has been seen in 12 C+
16 0, but16 16
none was apparent in the 0
+
0 case in the vicinity of theCoulomb barrier. These facts have caused considerable theoretical research to understand the origin of these fluctuations (see Davis (1960), Vogt (1960), Kompaneets (1961), Wildermuth (1961). lmanashi
5
-reactions near the Coulomb barrier would be us eful to compare with 12C
+ 12C.
The Expected Results
Before discussing the experimental methods, the results will be anticipated using ideas from elernentary quantum mechanics and
simple compound nucleus theo rYe This will provide a basis for understanding the experimental methods used and the choice of the various quantities measured.
In astrophysical calculations a cro ss section variation of the form
cr-(E) ::::
S~E)
exp (- 21fT) - gE) fwhere
T)= and
is often assumed. v 1 is the relative velocity of the incoming re
particles, R is the interaction radius, M is the reduced mass, and E is the center-of-mass energy. The relation follows from the WKB approximation for a charged particle with orbital angular
"'"' S(E)
is usually assumed to be nearly constant if there are no resonances in the nuclear system. The final measured cross sec-tions are used to obtain S (see the Conclusions Section). However, most of the measurements were made at energies not very far below the Coulomb barrier (E ,... 10.5 MeV, R"" 8.8 fm), where the
cm
exponential factor does not give a good approximation to the barrier 16 16
penetration energy dependence. Furthermore, for
0
+
0
reactions there is a considerable angular momentum involved (classi-cally, L ~ 6 at E = 12 MeV), so some variation of S with E
cm
is not unexpected. Using the equation above, the drop in cross section from E
=
10.5 MeV to the lowest energy measured.cm
E
=
7 MeV, is about a factor of 5000. cm16 16
The exit channels available to 0
+
0 reactions up to E = 12 MeV are shown in Figure 1. Note that there may becm
competition between compound nucleus formation and dhect reactions. 32
In the former case the 32 nucleons momentarily form S, the com-pound nucleus. The energy becomes spread among the constituent nucleons so that there is no Ilmemory" of the incoming channel. Then one or more particles "evaporate" from the compound nucleus. In the case of direct reactions the 32S intermediate state is not
12 20
formed. Examples of the latter are perhaps C
+
Ne (a-transfer) and 24 Mg+
8Be (2a-transfer). The neutron and proton transfer channels 150+
170 and 15 N+ 17 F are open only at the highest
bombarding energy used. Buchler (1969) calculated that less than7
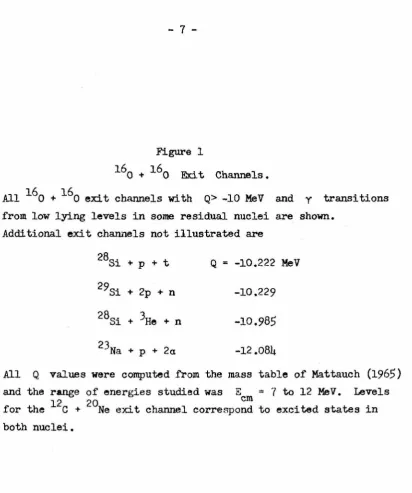
-Figure 1
160
+160 Exit Channels.
All
160
+160 en t charmels with
Q>-10 MeV and
ytransitions
from low lying levels in some residual nuclei are shown.
Addi tional en t channels not illustrated are
28
3i
+p
+t
Q =-10.222 MeV
29
3i
+2p
+n
-10.229
28
3i
+3
He
+n
-10.985
23Na
+p
+2a
-12.084
All
Q
values were computed from the mass table of Mattauch
(1965)
and the range of energies studied was
E =7
to12 MeV.
Levels
12
20
cm
ECM ..:W&L
MEV
~
29AI+3p ...:!UU... .::l.!...lH....,
~
~
~
-=!l2!.. 17F+I~ 170+ 150 10.0 ~ ~+6Li :3OS+2n .-~
2°Ne+ 30 8.0g
~
U
27~+a+n~~d
..:L!:!Lg
~
9
-fo r by the Q' -transfe r channel, so compound nucleus fo rmation is
expected to be important.
The energy spectrum of light particles b "evaporating"
from the compound nucleus can be estimated from Blatt and
Weisskopf (1952)
#(E) • dE = const • E • fT (E) • wy{E ) . dE
c exc
Here E is the excitation energy of the resulting nucleus Y
exc
corresponding to E. the total C. M. kinetic energy of the outgoing
particles b
+
Y. The value of fTc is the cross section forforma-tion of the compound system by particles b incident on the target
nucleus Y and can be expressed in terms of charged particle or
neutron penetrabllities. The level density in the nucleus Y was
taken to be that of a Fermi gas with angular momentum I
=
0:=
const • exp (2..faE ).2
excE exc
-1
with a
=
4 MeV (see Bohr and Mottelson (1969). especially page187 and Fig. 2-12). The computed neutron. proton and alpha spectra
with thresholds for secondary reactions are shown in Figs. 2 - 4.
It is evident that three body breakup reactions may have large
cross
sections. especially at the higher bombarding energies.
The Coulomb barrier E ul for the mass region A'" 30,
co
Figures 2 -
4
Neutron, Proton and Alpha Evaporation Spectra
From 160
+160 •
01
ZN C ~
m
1"1:u
0
0
2.5
CALCULATED
NEUTRON
SPECTRA
FROM
5.0
-Ecm
110
+
1&0
-..
n
+3I
S
•
7.5
(MeV)
10.0
I
~
(.ell
ZN
C
E
~
~0
0
5
10
Ecm
CALCULATED
PROTON
SPECTRA
FROM
18
0
+
180
-..
P
+
31p.
15
(MeV)
20
~
ZN C
I:
CD
:::u
'"
CALCULATED
ALPHA
SPECTRA
FROM
"0
+
"0
....
a
+Z·Si·
o·
,
o
~
10
Ecm
I~
(M.V)
20
25
A useful quantity to compare the different exit channels is 0cff = Q - E
coul• With these values and the computed particle spectra, the branching ratios can b<'l estimated. The 32 S compound nucleus will probably emit roughly equal numbers of protons and alphas (the alphas will compete because the positive Q value is higher for
28 31
Si
+
Cl than P+
p, counterbalancing the larger E ul for coalphas -- i. e., Q
eff - 5 MeV for both), with somewhat fewer neutrons (Oeff - 1.5 MeV), still fewer deuterons, etc. Thus the main nuclei Y left after the first evaporation should be 31 p , 28Si , and 31 S. Some of these will have an excitation energy above a
particle breakup threshold and will generally have a second
evapora-31 30 28 .
tion. For example, those S will go to P
+
p, and Sl prefer-entially to 27 Al+
P and somewhat less to 24 Mg+
a, etc. in the same way as before. These arguments based on Qe£f suggest the following "branching ratios" for a bombarding energy corresponding to E - 12 MeV:cm
Exit Channel 28 Si
+
a31p
+
P 31 S+
n 30 Si+
2p 30p+
d 29 S1+
3 He 30 p+
P+
n 27 Al+
P+
a24 Mg
+
2a29p
+
t 12C+
20 Ne Eve rything el s eQ
9.592 MeV 7.676 1.448 0.388 - 2.412 - 2.510 - 4.636 - 1.991 - 0.390 - 7.478 - 2.431 Q eff
+
5 MeV+
5+ 1.
5- 4.5 - 5
- 7
- 7
- 9
- 9.5 - 11<-
11.5liB. R. II
15
-The E!perimental MethodsA large proportion of these exit channels involve one or more light charged particles. Angular distributions and cross sections for the production of protons, deuterons and alphas were measured using counter telescopes. This technique, described in the Charged Particle Section (page 62) I provides the bulk of the cross section
data.
30 31
Two radioactive nuclei, P and S, were produced by 16
o
16+
0 reactions. Cross sections for their production were measured by counting the emitted beta particles as a function of time after the beam was turned off. The decay curves were analyzed using the known halflives to separate the two activities. Experimen-tal details and results are given in the Activation Section (page109 ).
A cross check between the previous two methods was afforded by the set of channels
30p
+
P+
n 31S+
n •In the Neutrons Section (page 141) is described a determination of the neutron production cross section using a flat response detector. The cross check
30 31
0-( P)
+
0-( S)=
0-(d)+
o-(n)The 12C
+
20 Ne exit channel cannot be studied with the previous techniques. Its branching ratio is hard to estimate theo-retically because it may be a direct reaction, yet both 16 0+
160 _ 12C+
20 Ne and the inverse 12C+
20 Ne - 16 0+
160 may be of astrophysical interest. Thus, the angular distribution of the former12 20
reaction leading to the ground states of C and Ne was meas-12 20
ured using a coincidence technique (see C
+
Ne Production Section, page 152). No data on the total cross section to excited states were obtained.A number of important semiquantitative results were also
. 16 16
obtained from the ,('s emltted in 0
+
0 reactions. The Gammas Section (page42 )
presents results which roughly verify the expected branching ratios. In addition, measurements of the16 16
total '( emission from 0
+
0 were made at narrow energy steps (~ E=
50 ke V) •cm No evidence for structure similar to that in the 12 C
+
12 C reactions was seen, so large steps in bombarding energy for the reaction cross section measurements were justified.All cross sections were measured relative to the elastic 16 16
scattering cross section for 0
+
0, because direct current integration of heavy ion beams, especially in gas targets, always presents problems and was completely avoided except for the12C
+
20 Ne measurements. Thee
=
900 relative maximum cm. 16 16
In the 0
+
0 Mott scattering angular distribution provided a17
-angle in the literature, a new. more precise determination was made for E = 7.35 - 14.35 MeV. The Elastic Scattering Section
cm
(page 18 ) describes these experiments.
The large number of exit channels and energetically accessible excited states in the reaction products made it very difficult to ex-clude contaminant reactions. Therefore a differentially pumped gas target of high purity 02 was used whenever possible. The low target density was partly compensated for by the much higher beam currents possible in an open gas target. Also. energy losses and target uniformity are more easily controlled in such a system. The target design is described in the Elastic Scattering Section (page 21). Several examples of problems that can arise from solid targets are given in the Activation Section.
12 12
Finally. two appendixes contain C
+
C 'Y ray and elastic16
16
ELASTIC SCATTERING
Introd uction
Some means of determining the number of incident and target
16
16
nuclei was necessary for measuring 0
+
0 reaction cross sections. Direct integration of the beam current is often used to obtain the number of incident particles. but this is difficult for heavyion beams because of the uncertainty of the beam's charge state dis-tribution after pas sing through the target. Thus the relationship between the current and the number of particles per second is poorly known. Another solution was to determine the heat deposited by the beam with a calorimeter. However. elastic scattering of the beam from the target region gives a mOre direct measurement of the com-bined beam intensity and target thickness. The reaction cross section can be written as
~)
~~)
reaction d elastic scattering
II
reaction roducts) elastically scatteredparticles
with the constant of proportionality depending on geometrical and kinematic factors only. This method was used for determining
16
16
nearly all the 0
+
0 reaction cross sections. requiring a knowl-edge of the differential cross section for elastic scattering.16
19
-scattering has a relative m.axim.um. there for all energies with a differential cross section just four Um.es the Rutherford value, and because the angle could be easily located experim.entally. As a test
of the differentially pumped gas target systern.. the elastic
scatter-. 16 16 0
mg of 0
+
0 was measured ate
= 90 • Our preliminary cmresults disagreed with values in the literature (Bromley (1960, 1961» near the Coulomb barrier, so m.ore complete data with higher pre-ci s ion
were taken.
16
In these experiments the 0 nuclei were scattered from a mixture of Oxygen and Argon gas and were detected with the sam.e counte rand collim.ation as in the other charged particle
m.easure-16
16
ments. The ratio of 0
+
0 elastic scattering to pure Rutherford scattering (16 0+ 40 Ar) was obtained from a ratio of counts in the
one detector ate
lab = 45
0
• The difference in the angular
distribu-. 16 16 16 40 0
tions for 0
+
0 and 0+
Ar neare
lab
=
45 required special precautions to keep the angle constant and to obtain repro-ducible data with good statistical accuracy. Data were taken from.4+
E =7.3-14.4MeV instepsofl00-250keV(C.M.) with 0cm 5+
time. The results show that the 900 (C. M.) cross section is not as smooth near the Coulomb barrier as formerly thought.
16 16
Previous elastic scattering data for 0
+
0 were taken by Bromley, Kuehner and Almqvist (1960, 1961) fo r E • 5.0- 17.5cm 0 0 0
MeV at angles of 0 = 38 , 58 , and 90 using a solid target. Over cm
part of this energy range Carter, Stelson, Mehta and Bernard (1965) 16 16
searched for fast changing structure in the 0
+
0 elasticscat-0 scat-0 scat-0 0
tering at 0 = 48 • 58 , 80 , and 90 with a differentially pumped cm
gas target. Carter, et al. ,reported general agreement with Bromley, but no new absolute differential cross sections were given. At higher energies, E = 10 - 35 MeV, Maher, Sachs, Siemssen, Weidinger
cm
and Bromley (see Siemssen (1967) and Maher (1969) made measure-ments of angular distributions and excitation functions and fOWld strong resonance structure.
. 16 16
Recently there has been theoretical lnterest in the 0
+
0 elastic scattering. Rickertsen, Block, Clark and Malik (1969) used a nuclear molecular potential to fit the differential cross sections ato
6
0 0 0 00=49, 0 , 7 0 , 8 0 , and 90 for E = 10to 22 MeV.
cm Brueckner,
Buchler and Kelley (1968) and Chatwin, Eck, Richter and Robson o
(1969, 1970) tried to fit the 90 excitation fWlction and some angular distributions for E = 10 to 15 MeV. In both cases the
experimen-cm
tal data of Bromley
_re
used t.o compareto
the theoreticalfits,
21
-the nuclear surface in connection with heavy lon scattering wal'l dis-cussed by Gadioli- Erba and Sona (1969).
The Differentially Purnped Gas Target
The differentially pumped gas target system is shown in Figure 5. The target chamber was 29.3 cm I.D. with 6.4 mm thick steel walls. The first canal was between the chamber and the Roots pump and was 6.4 mm I.D. by 2.5 cm long. The second was 3.6 mm I. D. by 10.2 cm long and the third was 9.5 mm I. D. by 12.0 cm long. At each end of the second canal was an 0.5 mm thick tantalum
collimator 2.5 mm in diameter which was responsible for determin-ing the size of the beam in the chamber. Usdetermin-ing the light produced by the beam in the gas, it was checked visually that the beam did not hit the sides of the first canal. A set of adjustable slits. set at a total width of 4.1 mm and separated from the second canal by
o 104 em, gave a maximum permissible angular deviation of ± 0.18 in the beam relative to the central axis of the system. Initial align-ment of the canals was performed with a telescope zeroed on these slits. Attached to the first pumpout was a Roots pump with a pumping speed of about 70 liter/sec at 0.2 torr. The second pump was a
Figure
5
Schematic of the Differentially Pumped Gas Target.
The parts of the differentially pumped system are drawn to the scale shown. The beam entered the target through three canals with typical pressures of 10-
5
torr in the region of the slits, 10-4
torr between canals 2 and3,
0.1 torr between canals 1 and 2, and 3 torr at the gas inlet. Several detectors were normally in the target chamber. The monitor(45
0) counter was mounted on the inner aluminum cylinder in the chamber bottom.V /\
SLITS
BEAM
-II
TO DIFFUSION PUMPo
20
em.
I
I
I
I
I
I
I
I
I
~
BRASS
E'J
COPPER
o
LUCITE
III
STEEL
D
ALUMINUM
TARGET CHAMBER
TEFLON
CANAL
I
/SLEEVE
DIFFERENTIALL
V
PUMPED
TARGET
TO
ROOTS PUMP
GAS
an.
roid gauge. checked against a McLeod InanOIneter.The energy 108s of the beam before arriving at the target chamber center was estiInated by taking the full chamber pressure from the target region to the middle of the first canal and zero pres-sure beyond. With this approxim.ation. the beaIn traversed 7 cm. in the gas befo re reaching the center of the cham.ber. For pure 02 gas at a cham.ber pressure of 3 torr, using Northcliffe's (1963)
16
energy loss curves. a 22 MeV
°
beam. would lose about 320 keY before reaching the target. The straggling would be about 40 keY(FWHM). For a target length of 3 InIn seen by the detector the target thickness would be about 14 keY (lab). The target length for the
counter telescopes described in the Charged Particles Section was roughly an order of Inagnitude larger than this.
In the m.easurement of reaction cross sections. ultra high purity (> 99.99
%
by volUIne) 02 gas was flowed through the chaInber at about 20 liter atm./hr for a chamber pressure of 3 torr. SIn all leaks. outgassing. and pUInp oll backstreaIning were estim.ated at-3 /
<
4 X 10 liter atIn hr total. The ratio of the nUInber of hydrogenatoInS to the num.ber of oxygen atom.s in the cham.ber was estiInated
-3 16 1
to be
<
5 X 10 from. the observed hydrogen recoils from. 0+
H elastic scattering seen in forward angle proton spectra.25
-and steering the beam into the target chamber. The photomultiplier current was propo rtional to the beam current within a facto r of two over the entire energy range used in these experiments. Direct current integration with gas in the chamber was not attempted.
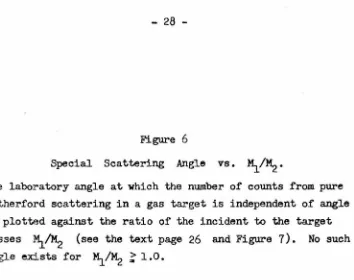
In a gas target there is an angle at which the nwnber of counts from Rutherford scattering is independent of angle for a given detector
collimator configuration. This useful fact was employed in part for monitoring the beam's angle in the chamber during the elastic scatter-lng measurements. It was also used for the experimental determina-tion of the ratio of geometrical factors for two different counters (see
Charged Particle Section, page 70 ).
In a gas target the number of counts N in a counter is pro-po rtio nal to
N «(solid angle) • (gas length) • (current) • (cross section)
dn L i d O " / d n ·
Two defining collimators are needed per counter to restrict the length of the beam path seen. For a counter at 9 o
lab =
90
b0cause the path length seen by the counter increases. In the special case of pure Rutherford scattering of light particles by heavy targets
S do- ex 1/ i 4 ( lab)
dQ"" s n 2
-so the angular dependence of N is
and
dN
=
0 dSlab
1
N ~ ---:::S~-sin Slab. ---:::S~-sin 4(
~ab)
for Slab
=
132 • oTherefore, the number of counts N is nearly independent of angle for Slab ~ 1320 and pure Rutherford scattering of light beam parti-cle s on heavy targets (8 ee Dwarakanath (1968». Making co rrections for the mass of the bombarding particle M
1, and of the target M2, the corresponding angle is a solution of the equation
o
=5 - sln2 Blab •
[9
+
20(~:tJ
+
sin
4
Blab·
[24(~:t
+
16
(~JJ
•
16 40 0
27
-<
0.7%.
Figure 6 plots the value of 91ab as a function of M/M2•
Experimental
16 16
The 0
+
°
elastic scattering was measured using various mixtures of ultra high purity Oxygen and Argon gases in the differentially pumped target. The ratio of pressures was typically 02 : A r = 3 : 1 to 1: 1. A special gas mixing bottle was used to make sure that the gases were well mixed (to within ± 0.25%). Mixtures containing a larger percentage of 02 were employed especially at higher energies where the ratio of elastic to Mott scattering was less than0.9.
Heat deposited along the beam path may cause changes in the gas density and perhaps in composition. Since only a ratio of counts was used for elastic scattering cross sections, density changes were unimportant. The continuous gas flow in the chamber also reduced composition changes along the beam path.. Typical beams in the chamber varied from 3 - 7 J.1a of 04+, corresponding
to
a loss of 0.13 to 0.30 watts/cm. It is estimated that these differences in heat loss could lead to «0.10/0 changes in the gas composition.The energy loss of the beam before reaching the target region was determined experimentally using elastic scattering. The scat-tered particles I energy was measured for chamber pressures of 3.0
Figure
6
Special Scattering Angle VB. ~/~.
29
-~---~---~---~---~g
~---~---~----~~O
150
016
of a 23 MeV 0 beam to the center of the target was found to be 330 ± 60 keV (lab). Using Northcliffe I s curves (1963) , the energy
loss and straggling are 310 keV and 40 keV (FWHM, lab) respectively.
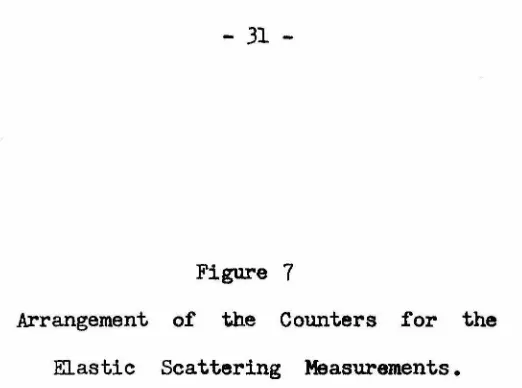
The elastically scattered particles were observed simultane-ously with three solid state counters (see Figure 7). Two were
placed on one side of the beam to check on its position in the chamber: One counter was at 1320 , where the number of counts is nearly
inde-o pendent of angle, and the other was at a forward angle (Slab::::: 24 ), where the count rate is a strong function of angle. The ratio of the
16 0
o
beam particles scattered from the Argon gas into the 24 cOWlter,o 0 0
N(Ar,24 ), to the number entering the 132 counter, N(Ar,132 ), changes by about 200/0/degree and is a good indicator of beam angle changes. Experimental values of this ratio agreed within the statis-tical fluctuations expected from the numbers N(Ar,240) and
N(A r, 132°). The standard deviation in this ratio was ± 1.60/0. This indicated beam angle changes of less than ± 0.080/0, whereas the
o
geometrically allowed change was ± 0.18 • Furthermore,
N(Ar, 240)/N(Ar, 1320) provided a check on whether or not the scat-16
tering of 0 from Ar was purely Rutherford at higher bombarding energies. Deviations were found above E
1ab
=
27
MeV; however, the ratio N(Ar,240)/N(Ar,450) did not change up to the highest energies measured. Thus N(Ar, 450) was taken to follow the 1/E2 law over the full range of energies used.31
-Figure 7
Arrangement of the Counters for the Elastic Scattering Measurements.
The actual elastic scattering data were taken with the
4.s<'
counter, but the other two detectors were used simultaneously to check for variations in the incident beam angle (see the text page 30). Also shown is the relative number ofen5
z
0
t-o
0:::4
Q..
LL
0
3
0:::
L&.I CD
~
=>2
z
L&.I
>
-,
~
..J L&.I
0:::
0
RUTHERFORD SCATTERING
OF PROTONS ON ARGON
IN
A GAS TARGET
900
COUNTER
FIRST STAGE fDlFF. PUMPING
1% I
1270
1200
ANGLE
RANGE
I
136.50
l
P.M.
WINDOW
---.-
~.
~~40
BEAM
JJ
-collimator arrangement was used to monitor the target thickness
and beam intensity in the other charged particle meas urements.)
°
Its collirn.ation was ± 0.67 • The correct angle of this counter
°
relative to the beam was determined by taking data in 1 steps over
o
16
16
a set of angles near
a
lab
=
45 • In the Mott scattering of 0+
O.16
16
0the number of 0 scattered from 0 nuclei into the 45 counter.
N(O,450) exhibits a relative maximUIll when the counter is at 45°
(see Figure 8). (The actual angle is about 44.9 because of the o
variation in the center-ai-mass solid angle conversion factor with
angle.) However N(Ar,450) varies monotonically with angle, so
the ratio N(O,45°)/N(Ar,450), which gives the final data. has a
o
maximum at an angle slightly greater than 45.0 • This difference
was found to be 0.50 , in good agreement with calculations. In order
to decrease the influence
oi
small changes in the beam angle on the oresults~ the counter was set between the two maxima at 45.2
relative to the beam. N(O,4S.20) differs from N(O,4S.00) by less
than 1.3%.
All elastic scattering and recoil peaks in the spectra were
well separated. These spectra from each of the counters were stored
in multi.channel analyzers, and the counts in the peaks were summed
later and used in the data analysis.
Results
The theoretical angular distribution for pure Mott scattering
Figure
8
.35
-"
z
-
>
a:
w
w
~
I-
III0
g
...
....
-0 C)<t
-
0z
0
+
-
0 ~
0-CJ)
0
II
~:2
v
t-
~t-
v
0
W
:e
0 0 -0
~)
=
cmwhere
1 {
1 4
e
sin"'2
+
4e
cos"2
21 2
+ (-1)
21 + 12 2
T) = Z e
/h
v re 1cos
(T)
1. n tan 2~)
} 2e
2e
sin cos-2 2
e ::
center of mass angle, and I:: nuclear spin = 0 in this case. The interference term causes relative maxima and minima in the angular distribution (see Figure 8), and these change in angle with energy. However, ate
=
900 there is always a relative maximum andcm
constructive interference, and the Mott prediction is just four times the pure Rutherford value there. That fact makes this particular angle ideal for monitoring beam intensity and target thickness in the case of the 160
+ 16
0 reactions.The ratio of the 16 0
+ 16 0 elastic scattering to Mott
scatter-ing ate
=
900 is shown in Figure 9. Almost all points are thecm
average of 2 to 6 measurements, or about 5 - 80 minutes counting time. Data in the region E
=
9.5 - 11.5 MeV are the results ofcm
4 to 6 such measurements. These data were taken in several passes over the energy region covered to average out possible changes in the incident beam angle. A statisticaJ. analysis of all the results
o
37
-Figure
9
160
+160 Elastic Scattering.
The ratio of the differential cross section for 160
+160
elastic scattering at
a
=90
0to the Mott scattering cross
cm
-~--.98
.96
.94
.92
.90
160 16
C
+
0 Elastic S
. M.
Angle =90
0coffering
•
oo o
o
o
o
o
o
o o
o
\I
1 2 f ; ; 1
-E
C.M. (MeV) 13 14
15
01
39
-correct value. Changes in the intensity distribution of the beam across the entrance collhnator, changes in the gas pressure, or rapid fluctuations in beam current affecting the dead time of the
electronics, did not influence the results. This was because the ratio N(O, 4 So) /N(Ar, 4So) was obtained from one counter alone. There-fore, the error bars on the data of Figure 9 and Table 1 correspond only to statistical errors calculated from the total number of COWlts at each energy and the uncertainty in the normalization constant. The energy loss was taken to be the measured value of 330:1: 60 keV (lab) at E
lab = 23 MeV and was extrapolated to other energies using Northc1iffe I s curves (1963). An overall uncertainty in the C. M.
energy scale for all points of :I: SO keV is estimated from the energy
loss correction. The elastic scattering results permitted another 16
check on the energy loss to the 0 beam before reaching the target. The ratio N(02' 4So) /N(Ar. 450) was measured with 3.1 torr and with 0.7 torr chamber pressures at E
=
11.7 MeV, on the steep portioncm
of the curve in Figure 9. The change in the ratio indicated a total energy loss before the target of 2S0:l: 100 keV, in agreement with the other. independent technique.
The average value of N(O,4So)/N(Ar.4So) for E ~ 10.0 cm
40
-The num.erical values of the data presented in the paper of Bromley, et al. (1961) are no longer available. Therefore, points were read off Figure 13 of that paper and then compared to values in Table 1. When this was done, the data of Bromley, et al. seem to be shifted up in energy by 150 - 250 keY (C.M.) from the gas target data for points above the Coulomb barrier. Part of this shift may be the result of reading the values from Figure 13.
However 1 it is also believed that the values of Bromley et al. should be shifted to lower energies by 50 - 100 keY (C .. M.), or more. based on more recent energy loss information. The targets were quoted to be ,,- 100 P. gm/cm2 thick" SiD foils with an estimated energy loss of ,,- 250 keV" (C. M.). The curves of NorthcHffe (1963) predict an energy loss of 350 keY (C.M.) at E
lab
=
24 MeV for such targets. With the larger energy los s estimate. the older data should be shifted down by 50 keY (C. M.) (half the error in the target thick-ness, since an average energy 108s over the target is used). If the2
foils were actually 130 p. gm/cm , the predicted energy loss is 450 keY and the corresponding shift is 100 keY. Note that the data in Table 1 are shifted down in energy from the data of Bromley t et ale even without the correction for energy loss of the beam before reaching the target region.
Moving the energy scale down by 100 keY for the data of Bromley, et ale gives agreement within one standard deviation with the gas target results at energies above E
=
13 MeV; the oldercm
41
-adequate agreement within their estimated errors, and the precision their values can be read from their Figure 13.
16 16 More recently, Maher, et al. (1969) measured the 0
+
0o
elastic scattering at
e
= 90 from E=
10 to 35 MeV using acm cm
SiO foil target. Both particles were detected in coincidence. A fairly thick target was used by Maher in order to get sufficient yield at higher energies. These values are systematically shifted up in energy by about 250 keV C. M. from the gas target data.. They are also shifted up in energy from Bromley's (1961) data. The reason for these discrepancies is not certain, but may be the result of poor knowledge of the solid target thickness and the energy loss. The gas target energy loss is believed to be well known.
The 16 0
+
16 0 elastic scattering curve should be compared 12 12to the one for C
+
C taken with the same apparatus (see Appen-dix I). The elastic scattering minima in 12C+
12C correspond to maxima in the reaction cross section and in a, p, nand '( yields.16
16
GAMMA RAYS
Introduction
Gammas emitted from j.6 0
+
16 0 reactions gave additional information on which exit channels are important and on the variation of the cross section with bombarding energy. Two different tech-niques were employed.for
In one case, several spectra were taken with Ge(Li) detectors
16
o
beams bombarding various targets containing Oxygen. Only specific energy '{'s were looked for, namely those from the first few excited states of nuclei formed in 160
+
16 0 reactions. Many levels can be populated in these nuclei; hundreds are energetically31 28 .
allowed in P and Sl, for example. However, highly excited states will often decay by a cascade of '{'s, proceeding through one of the low lying levels to the ground state, so transitions from the first few states are expected to be strong. Although branching ratios to the various exit channels could not be obtained from these obser-vations, semiquantitative information based on the intensities of the observed lines indicated that the most important exit channels are p
+
31p and/or 2p+
30 Si, Q'+
28 Si , d+
30 P and/or pn+
30 p.24 27
43
-important finding was the significant number of three body breakup reactions present and the sizeable increase in the two body reaction percentage at lower bombarding energies.
The total "V yield as a function of C. M. energy in 16 0
+
16 0 was measured in 50 keV (C. M.) steps with aNal (Tl) scintillator placed just above the beam line in the differentially pumped target. The number of "V's emitted increases with the total reaction cross section, but a strict proportion is not expected because of cascades from highly excited states. significant changes in angular distribu-tions, and possibly a preferential population of certain levels. The "V yield will be sensitive to fluctuations in the reaction cross section over restricted energy intervals, such as those observed in the12 12
C
+
C system (see Patterson, Winkler and Zaidins (1969) and Almqvist (1960, 1963)} since there are so many excited states that can be fed. The "V yield data suggest that the 160+
160 total reaction cross section varies smoothly with energy and fluctuations, if present, are less than the errors for the charged particle measure-ments.Ge (Li) Detector Spectra
. 16 16
Several high resolution "V spectra were obtalned for 0
+
0 reactions at E = 12 MeV with 40 and 55 cc coaxial Ge (Li) detectorscm
for a number of different targets.
Figure
10
160
+02 Gas and 160
+NiO Gamma Spectra.
These spectra were taken with a Ge(Li) counter at a bombarding
energy of 24 MeV
(E
=12 MeV).
The targets were 02 gas at
cm
1.S
torr pressure in the differentially pumped system and a
245
-I I
l
8
)
8
f-
-)
It) It)I L ' I -
.1
)
CJ)
)
-
~
-
8
0
§
•
f
J
.-,,
'
1-
"Z
0
'
....>
(..
.
)
L £ ' I - \~
Z
<~~
Z
LZ'I - ,".
:
}
0
w.~ ... I. ',. °
0 "
0
')~
f'
~§Gi
-
,~-
}
0
,>
)
!E Z
~O·,- .~.' ,
•..
,
Z-<:i
~
I
( )~ tiII·o - oC ••• " "
§
'~f
8
~
.
~.-.'t
'"
I L ' O - •...
,
. !,'\'
'"
"
r
,/'
~"
'f
MIQ'O
"
./T
.. l'?7
8
. ;rO t..
,-
,f
.'
L"
.
. ," ;..
...
t ~
....
I."~( ):
.
.
/""
.
~ . I:;" '.,
l
"~ '.
I I
00 0
0
8
0 0 0§
0 00 0 0
It)
si
It)pumped gas target with a gas pressure of 1.5 torr. The front sur-face of the detector was placed about 5 cm from the beam path and 48 ern beyond the target chamber center. Shielding from yl s pro-duced upstream and downstream was 11 cm of lead arranged so the target length was about 15 cm or 340 keY (lab). The tantalum beam
stop was 97 cm from the detector. Energy calibrations for this
d th d i 22N 54Mn 60C 88 y d
an 0 er spectra were rna e us ng a, , 0 , an
137
Cs sources to an accuracy of ± 5 keV.
Most y lines in Figure 10 are much wider than expected from the actual detecto r resolution. The main contribution to the line width is Doppler broadening because the heavy reaction products have velocities relative to the detector when they decay. For the
16 16 28 .* .
case of 0
+
0 --- a+
Sl (1.78) the Doppler shtft is expected to be up to 65 keY or 3.6%, and for 160+
160 - p+
31p* (1. 27) it is up to 35 keY or 2.7%. The observed wi.dths (FWHM) of both lines are about 4.0% from Figure 10. The 70 keY (FWHM) stragglingin the beam energy acquired from passage through 55 cm of O2 gas to the target region caused no significant further broadening of the y Hnes.
In a thick solid target the y energy resolution is better than for the gas target because the density is much higher, so the heavy nuclei are slowed down much more quickly and the Doppler
47
--3 / 2
about 10 I.l gm cm of 02 gas is traversed before a '( decay from these states in the gas target. The corresponding thickness
2
for a solid target is on the 0 rder of 1 I.l gm/cm • The difference in 16
'( line widths is apparent between the spectra of the
°
beam bombarding 02 gas and a NiO foil (made by oxidizing a 1000A
commercial Ni foil in a pure 02 atmosphere with a collimated light source) in Figure 10 and a thick piece of quartz shown in Figure 11.
The advantage of better resolution resulting from thick solid targets is partly offset by the uncertainty in the origin of some '( lines. Since solid targets cannot be made of pure Oxygen, they are susceptible to the production of undesired '(I s from reactions with
other nuclei in the target. For example, with hydrocarbon contami-nants on the target surface, the reactions 160
+ 12C -
P+
27 Al and 16°
+
16° -
27O'p
+
Al would lead to the same characteristic '(I sand could not be distinguished.
The Ge (Li) detector was always at right angles to the beam with at least a 1 cm thick cylindrical lead shield around the detecto r housing as some protection against background. The distance between the counter's front surface and the beam spot varied from spectrum to spectrum and ranged from 2 to 10 cm with about 1 mm of alumi-num in between. The beam intensity was generally kept below 200 na
16
48
-Figure 11
160 + Quartz Gamma Ray Spectrum.
This spectrum was taken with a 55 cc coaxial Ge (Li) detector for
24
MeV 160 nuclei bombarding a thick piece of quartz~oo,r---r---~~----~---~---~---'---~r---r---r---r----'
CJ)
f-4000 3000 2000
Z
1000
~
o
o
/!
I
!I~
iIi' ii'
II
...
,
•
..
•
.,;2 o
.,
;
~ ~...
!
160
+
QUARTZ
Y SPECTRUM..
~'I
~
, d~' ID .., • : 1 ~ 0; :. If)\J.!
_...
,II,
(-'
ii/I
,
.;
~
.
""!'-."~
... ",I'
';.;;:;/<!f\~i'
~
fiI' \
!
I
I
~
J! ~
... .' .,."" .• j~rl··. "
d
ii...!I
I~'.
\ • •• ~ ... t,I" ... .,.,..~-,. .. , .. i' I . .,:
I
' "'
.... .;.'''','
r,', ~:~.;,: '-:fl" • .. I! I j' '1 I! ' .~ ,.:,~..';;.I I J:' !1. ,\ ii, ~\...
i..l
x liS " ..., ....~..,
"",NIl.~
...~~
",-,' :.J_~,_~
': ••~'\.
!!! oi
.,
..
..
..
f.r
.\
I,n
~I
""--...:' 1 .7-.."-,,,...' '.
~ ~
.. :.~'
: ". V '.or....r"i""-0"
'"
o U'U'\.1"1.".__."'"
1000 1:\
.\
I' I ! ,500f-·i
i
I •~l
•
=
•
:
:
:J
..
;
..
g
~ 01 ..,!
!
i; 01
·\."'''''';'''N'''';\''~'''~''~~.';'O""""~>:<\,_,..~;",,_.~
..
.v>,,...,,'_''""'''"'I-.-~.-t--',,~
?Joo
,,&,
12~
I':x,f4~
15~O
16~
1700 1800 1900 2000CHANNEL
50
-Table 2 lists the y energy, the relative detection efficiency, and the counts normalized to the number in the 2.23 MeV peak for 9 strong lines observed in all spectra. The estimated errors on the ratios range up to ± 20% because of problems in background sub-traction. Note that the ratio of counts varies significantly. Some differences arise from the variety of circumstances under which the spectra were taken. Others probably carne from contaminants on the targets or from. 16 0 t Si reactions. Since all peaks in Table 2 are present in the gas target spectra, they are all believed to origi-nate from 160
+
16 0 reac on pro uc s. ti d t Th e re at ve p otopea 1 i h k efficiency of the detector was estimated from Paradellis and Hontzias (1969). Huang, Osman and Ophel (1969) and from direct m.easurement to roughly follow a power law-Q'
Effic iency - E with Q'D! 1 .. 2
This quantity is also tabulated in Table 2.
Estimates of branching ratios to the various 160 t 160 exit channels were made from the intensity of lines in Figure 11. Some conclusions were also implied by the absence of certain transitions. Table 3 gives a list of the y lines between 0.5 and 4.4 MeV from Figure 11, the most probable transition or transitions involved t and other possibilities that are considered less likely (for 160 t 160
.51
-observed. Transition energies were taken from Endt and van der Leun (1967) and the y energies were obtained from the energy
calibration with a number of source". The accuracy 1. about ± 5 keV except at the higher energies where no calibration lines were used. Several1ines remain unidentified.
Identifications in Table 3 were required to be self consistent in a number of ways. Single and double escape peaks were always broader than the photopeaks of about the same energy. Strong lines between 1.5 and 2.5 MeV and al11ines above 2.5 Mev were required to have both. y decay schemes and branching ratios, where known. were taken into account. Thus if a transition between the third and second excited states was present, the y's depopulating the second level had to be seen as well. Finally, if a transition from the second excited state in a nucleus was identified, the one from the first
excited state was also required to be present, etc. An exception to 31
the latter was that P (3-0)
=
3.135 MeV was not observed. but decays from higher levels were.A number of conclusions can be drawn from Tables 2 and 3
. 16 16
correspondmg to E = 12 MeV. These follow for each 0
+
0 emexit channel with Q
>
11 MeV (see the energy level diagram Figure 1). Level energies and y branching ratios were taken from Endt andvan de r Le un (1967) and Ajzenberg-Salove and Lauritsen
(1959).
All yields are stated as ratios to the 28 S1 yield and are generally based on results presented in Table 2. Limits on yields come from52
-26 M g
+ +
Q' Z p, 28 St+
t+
p,
_ _ 28 S1+
3 He+
n. All are expected to be small because of Q values. No conclusions are possible from ,,-ray yields since no excited states can be populated at E crn=
12 MeV.27 Si
+
0'+
n. Neither the transitions from the first nor from the second excited states of 27 Si were observed. A limit on the yield was derived to be<
0.05 (relative to 28 S1 == 1.0).29p
+
t. There is only marginal evidence for the 29 p (1- 0) trans ition, and none for the decay from the second exc ited state. The yield was estimated at.:5
0.03 times the 28 Si yield at E = 12 MeV. The large negative Q value andcm
Coulomb barrier probably suppress this channel.
29 Si
+
3 He • 29S1+
P+
d, 29Si+ 2p
+
n. No conclusions possible. The (1- 0) transition is masked by the 1.27 MeV,,'s
from 31 30P, Si. etc. The (2 - 0) transition is masked by the 3.05 MeV second escape peak, by 31p (4-1) and by 31g (4-1).
160
+
12C+
0'. The only energetically allowed state is the 4.43 MeV level of 12C~
but it is not observed (see Figure 11).20 12 20
Ne
+
C and Ne+
30'. Very little can be concluded. No counts above background were detected at E = 1.63 MeV fory
53
-ground states most of the time ~ emitting, no -V's. See the 12C
+
20 Ne Production Section (page 152 ) fo r a measurement of the cross section to the ground state.30 p
+
d t 30p+
_ P+
n. -V d ecays rom t e r s t our an per aps f h fi f d h five levels of 30 p were identified. The 0.67 MeV line was30
*
weak because P (1) is a T
=
1 state. The number of "{'sfrom 30 p is about the same as from 28 Si •27 Al
+
P+
a. Decays from the first three or four states in 27 Al are present. The fourth is in question because of the absence27
of Al (4-0), whereas the 1.727 line is broad and contains the single escape peak from 2.23 MeV -V's. The possible
16 12 .
presence of 0
+
C reactions must be considered, so the number of 27 Al formed by 160+
160 reactions is~
0.5 times the number of 28 Si formed.24M g
+ 2
a. The (1 - 0) transition is strong, but others are weak31
or absent. However the second to fourth levels in 24 Mg decay with E
>
2.7 MeV. Again there is the possibility of-V
160
+ 12C reactions, so the yield of 24 Mg is
.!S
0.4 ( relative to the 28 Si yield ==1.
0) •S
+ n. This channel is very weak compared to others with similar
Q values. 31S (1-0) was observed, but the (2-0)transition, if present, is obscured by the mirror transition 31p (2- 0) and others. Based on the 1.24 MeV -V's only,
31 28
54
-31 30
P
+
P
and 8i+ 21'. The idea of taking -V spectra was originally
conceived as a means of separating these channels. This failed because of a remarkable number of coincidences. The -V's involved are:1.27 MeV. There are at least 5 different transitions within 5 keV of this energy. One is the 1.78 MeV first escape peak, expected to comprise only a small fraction of the counts in this line. The amount of 29 8i (1 - 0) is uncertain, but the
30
amount
of
P (4 - 2) can be estimated using the known -V 30*
decay scheme of P {4} and the counts in the i.98 MeV peak. Note that 3i p {i-O} and 30 8i (2-0) transition energies are identical within the errors and the detector resolution.
2.235 MeV. Four important transitions occur within ± 3 keV.
32 31
The 8(1-0) and 8{2-0) -V's are expected to com-prise only a small portion of the total from the lack of
transitions from higher states in both and from the size of the 318 (1 -- 0) peak. That leaves 31p (2-0) and 30 8i (1-0), whose energies are within 2 keV.
30
*
3.505 MeV. 8i (2) decays 55
%
of the time through the 2.23 MeV level, and 45 % of the time directly to the ground31
55
-31
*
31" decay scheme of P (6) because the energy of P (6 - 1)
is 2.239 MeV! Nevertheless, for only the counts 1n the,
1. 27 MeV line, the number of 30 S1 is
<
0.2 and of 31p is>
0.7 (normalized to the number of 28 St == 1.0) from thestrength of the 3.51 MeV peak. The combined strength of all
these lines for 30 Si and 31p is 3.5.
28 Si
+
Q'. Decays from the first two excited states were observed.This is the only reaction producing a 1.78 Me V ", and there
28 28
*
are many levels of 8i which cascade through 8i (1.78).
Thus the 1.78 MeV line was ideal to compare to other yields,
and its strength was taken to be == 1. O.
32S. Unfortunately no conclusions can be reached. 32S (1 - 0) has
an energy of 2.23 MeV, which is the same as several other
32
*
strong transitions. The observation of the decay from S
(2) is questionable because of the "line II shape (see Figure 11).
Thus there is no evidence for or against a negligible yield in
this channel from the " spectra.
A summary is given in Table 4. These conclusions agree
qualitatively with the preliminary analysis performed in the
Intro-duction Section based on Q values and Coulomb barrier heights.
Table 4 contains similar data for 160 beams bombarding
quartz at E
1ab
= 20 and 18 Mev as well. A background spectrum
was subtracted from the 18 MeV run, but was unnecesscu:y for the
56
-of three body exit channels can be noted from the fall in the relative branching ratios of 27 AI, 24 Mg and 30p .
Such information is quite important in relating the measured production cross sections for protons and alphas to reaction cross sections. A proton fron'l 30 Si
+ 2p should be counted only half as
31
much as one from P
+
P in the proton spectra, since two light particles are emitted per reaction in the former case. The uncer-tainty in the three body fraction will be reflected in the reaction cross section, because of the difference of a factor of 2 in the count-ing, and in any extrapolation of the cross section to energies below E = 7 MeV. S