Volume 2009, Article ID 238103,16pages doi:10.1155/2009/238103
Research Article
Enhancing the Performance of Random Access Networks with
Random Packet CDMA and Joint Detection
Roland Kempter,
1Peiman Amini,
2and Behrouz Farhang-Boroujeny
21Military Air Systems, EADS Deutschland GmbH, 88039 Friedrichshafen, Germany 2Department of Electrical and Computer Engineering, University of Utah, UT 84112, USA
Correspondence should be addressed to Roland Kempter,[email protected]
Received 17 January 2008; Revised 17 April 2008; Accepted 29 July 2008
Recommended by Petar Popovski
Random packet CDMA (RP-CDMA) is a recently proposed random transmission scheme which has been designed from the beginning as a cross-layer method to overcome the restrictive nature of the Aloha protocol. Herein, we more precisely model its performance and investigate throughput and network stability. In contrast to previous works, we adopt the spread Aloha model for header transmission, and the performance of different joint detection methods for the payload data is investigated. Furthermore, we introduce performance measures for multiple access systems based on the diagonal elements of a modified multipacket reception matrix, and show that our measures describe the upper limit of the vector of stable arrival rates for a finite number of users. Finally, we simulate queue sizes and throughput characteristics of RP-CDMA with various receiver structures and compare them to spread Aloha.
Copyright © 2009 Roland Kempter et al. This is an open access article distributed under the Creative Commons Attribution License, which permits unrestricted use, distribution, and reproduction in any medium, provided the original work is properly cited.
1. Introduction
Generally, channel access can be performed either in a centrally controlled or distributed fashion. The benefit of scheduled access is obvious: due to the all-knowing nature of the channel arbiter (i.e., the base station), packet collisions can be avoided and service can be guaranteed [1]. However, these benefits come at the price of signaling overhead [2]. Additionally, in ad hoc networks, scheduled access is mostly avoided because of signaling complexity and/or signaling overhead. As a result, distributed, “handshake-free” random channel access has not only attracted considerable attention in data networks, but has in fact conquered this scenario. As an example, in packetized data networks where channel sensing is possible, the IEEE 802.11 standard has sparked a breakthrough of wireless technology. Where sensing is not feasible, random access is typically facilitated through the Aloha protocol or one of its flavors [3,4]. Such environments include networks with large propagation delay, for instance, satellite communication systems. Unfortunately, the lack of sensing greatly reduces the achievable throughput and the rate region where network stability can be guaranteed [4,5].
Random packet code division multiple access (RP-CDMA) [6] is a recently proposed random transmission scheme which has been designed to ease the performance penalties associated with fully random network operation. RP-CDMA embodies a cross-layer design approach for the physical and MAC layers to overcome the restrictive nature of the Aloha method. As has been shown in [6], RP-CDMA has the potential to greatly improve system throughput and to approach the goodput (“raw” channel capacity minus signaling overhead) of scheduled channel access. This is achieved through a reduction of the probability of packet collisions combined with multiuser detection technology to resolve multiuser interference. Essentially, the RP-CDMA physical layer allows for multipacket reception, hence, multiuser receivers are able to improve its throughput. At the same time, RP-CDMA maintains the simple MAC layer of the original Aloha protocol without the need for channel sensing. Furthermore, the performance of RP-CDMA can improve with the capabilities of the base station, no modifications in the transmitters are necessary.
In RP-CDMA, a transmitted packet of length (Lh+Ld)
Data Access preamble|code ID
Frame 1: header Frame 2: data Predetermined,
common to all encodedBlock Common spreading code,
collision limited Multiuser detection 400–12000 bits Figure1: RP-CDMA packet format as proposed in [6].
The header frame of length Lh consists of the access
preamble necessary for packet detection and carrier as well as timing recovery. The headers are all spread with a unique spreading signature which is known universally and contain the randomly chosen spreading information (Code ID) used to encode the data portion of the packet. For the data portion, the probability that any two active frames employ identical spreading sequences which would lead to collisions can be made arbitrarily small by increasing the Code ID. The header sequence enables the base station to detect ongoing concurrent transmissions and to recover timing information for each packet, allowing RP-CDMA to be fully asynchronous. Essentially, the header channel operates a spread Aloha system under extremely low load, thus facing a very low probability of packet collisions, whereas data transmission occurs under 3G CDMA system-like conditions.
In [6], the system characteristics of RP-CDMA have been investigated under the assumption of a collision-limited Aloha header process, setting the effects of mul-tiuser interference aside. In addition, no method for the detection of the data frame of the packet was introduced or discussed. Instead, it was assumed that as long as the headers survive, successful recovery of the entire packet is guaranteed usingidealmultipacket capture technology. Also, sizes of the data frame of the RP-CDMA packet in the order of hundreds of thousands of bytes were required to improve system throughput. As a result of these specific assumptions, it was concluded that RP-CDMA allows to approach the capacity of the multiaccess channel, and system performance is only limited by the capabilities of the base station in terms of the number of decodeable concurrent transmissions.
Herein, a more complete and realistic analysis of RP-CDMA is presented. In essence, we take into account realistic physical layer limitations, which allows us to understand RP-CDMA’s properties in an integrated fashion—across the boundaries formed by it’s physical and MAC layers. In a sense, the RP-CDMA packet format separates the wireless channel into two virtual channels: one for header and one for data transmission. We study the performance of both virtual channels for more general sizes of the data frame. Earlier analysis is extended in the following ways.
(1) Header transmission faces two limitations: (i) a collision limitation on the chip-level due to identical header spreading sequences, and (ii) an interference limitation caused by concurrent headers and, espe-cially, data transmissions. We consider both of these effects in our analysis.
(2) We investigate the behavior of the matched filter, the MMSE, the decorrelation receiver, as well as partitioned spreading demodulation for the data frame of the RP-CDMA packet in a multipacket capture channel.
(3) As has been shown and derived analytically by Naware, Mergen, and Tong in [5,7,8], we are able to base our performance analysis on the diagonal elements of the modified multipacket reception matrixE; namely,Λnand
nΛn =ζ. It also follows
from those references that Λn serves as the upper
limit of the stable arrival rates for n users. Using those metrics, we present more detailed and realistic results for the possibilities as well as limitations of RP-CDMA header and data transmission than those derived in [6].
(4) The system is simulated for different receiver struc-tures and performance in terms of queue size, and throughput is investigated.
Our paper is organized as follows. InSection 2, we intro-duce some notation and discuss preliminary assumptions, followed by an introduction to the multipacket reception channel and our performance metrics in Section 3. We proceed with an evaluation of the performance of spread Aloha and the RP-CDMA header process under various limiting assumptions inSection 4. InSection 5, we present the capabilities of RP-CDMA data recovery with our different receiver technologies.Section 6combines “all the pieces” via network-level simulations of RP-CDMA. Finally,Section 7 concludes our paper.
2. Notation and Preliminaries
the spreading gain of spread Aloha. The lengths of the RP-CDMA header and payload frames are denoted as
Lh and Ld, respectively. Γ is used to denote the
signal-to-interference-plus-noise ratio (SINR) at the output of a receiver, and γ refers to the detection threshold. K
denotes the overall network population, out of which n
users are active at a given time. We assume fixed bit durations; accordingly, when the processing gain N is increased, the chip size reduces proportional to 1/N, and the required bandwidth increases proportional to N. As a result, any increase of N constitutes a loss of bandwidth efficiency.
2.2. CDMA System Model. We assume n ∈ K active
users with independently generated binary information bits
bk(i) ∈ {0, 1},k = 1,. . .,nand modulated bynsignature
sequences{sk(t)}nk=1. As is common in the literature and for mathematical purposes only, (see, e.g., [9–12]), we assume chip syncronicity. The transmitted signals are embedded in an additive white Gaussian noise (AWGN) channel and the received CDMA signal is
y(t)=
n
k=1
Ekxk(t) +ν(t), (1)
whereEkis the power of thekth user,ν(t) is zero-mean white
Gaussian noise with two-sided spectral density σ2,x
k(t) =
ibk(i)sk(t − iT), and T is the bit interval. The chip
synchronicity assumption can be removed through a more cumbersome analysis which on average leads to similar results (see [13]).
2.3. Analytical Analysis: Asynchronous Versus Synchronous Packet Transmission. For analytical analysis of RP-CDMA, we assume packet level synchronicity, that is, packets are transmitted in predefined time slots. At a first glance, this seems like a violation of its envisioned asynchronous mode of operation. However, as far as the level of interference at the receiver, caused by asynchronous versus synchronous arrivals, is concerned, we note that the signal-to-noise ratio has to be interpreted as an average over theentirety of all
received packets. Along these lines, the performance of large powerful error control codes, such as turbo or LDPC codes [14]—which we envision to be used for payload encoding in any wireless transmission scheme—essentially follows the average SINR over the frame. Hence, only a small error is made by applying a synchronous model to the originally fully asynchronous RP-CDMA system.
While the assumption of packet level synchronicity allows us to grasp the characteristics of the interference process at the receiver, it would automatically lead to header collisions due to chip-level synchronicity. However, we can resolve this issue if we allow the starting point of our headers to be randomly distributed throughout the overall length of the RP-CDMA packet. We want to point out, thanks to these manipulations only, that we are able to come to a better mathematical understanding of the properties of RP-CDMA network operation. To our best knowledge, only few steps have been made towards true
asynchronous analytical network analysis, and the usability of the derived mathematical models seems very limited and highly restrictive (see, e.g., [15]).
Of course, we only use these assumptions for our analytical analysis. Whenever we present simulations results, RP-CDMA operates as described inSection 1, and we want to point out the very good match between the two.
2.4. Traffic Model. For our investigations, we adopt a widely used model for the classification of the physical layer performance of Aloha-type multiaccess systems. In accordance with [3–5,7,16–24], we assume that packets are generated independently according to a Bernoulli process with rate λ, 0 ≤ λ ≤ 1, and each node has a queue for storing the generated packets. From the queues, the first packet in the queue is transmitted with probability
P = 1 in the next time slot. If a packet has not been received correctly, in addition to any newly generated packets, it reenters the queue and is retransmitted in the subsequent time slot and feedback is instantaneous and error-free. P = 1 is chosen based on the discussion on the optimality ofpersistent Alohain the case of multipacket capture in [5]. Also from a systems angle, we believe it is very reasonable for an RP-CDMA implementation to immediately transmit packets as they enter the nodes’ queues as an approach to reduce transmission delay—comparable to 1-persistent CSMA/CD (see, e.g., [25]). Also note that
P = 1 is the underlying assumption in the definition of the multipacket capture matrix E, [22], which is defined below.
3. Multiuser Systems and Performance Metrics
3.1. Definitions. Given thatnpackets are being transmitted in a slot, forn≥1, 0≤k≤n, we define
n,kPr (kpackets are received correctly|nare transmitted).
(2)
The multipacket reception property of a receiver can be described by the multipacket reception matrix,E[22]:
E=
⎛ ⎜ ⎜ ⎜ ⎜ ⎜ ⎝
1,0 1,1 0 · · · 0
2,0 2,1 2,2 . .. ... ..
. ... ... . .. 0
n,0 n,1 n,2 · · · n,n
⎞ ⎟ ⎟ ⎟ ⎟ ⎟
⎠. (3)
Accordingly, system throughput when mpackets are being transmitted is computed as
Sm= m
k=1
km,k. (4)
We also define the modifiedn×nmultipacket reception matrix E, which is obtained from E by removing its first column, that is,
E= ⎛ ⎜ ⎜ ⎜ ⎜ ⎜ ⎝
1,1 0 · · · 0
2,1 2,2 . .. ... ..
. ... . .. 0
n,1 n,2 · · · n,n
⎞ ⎟ ⎟ ⎟ ⎟ ⎟
⎠. (5)
In this paper, we follow Loynes [26] and refer to a system as stable when the queue sizes in the nodes converge to a finite number as time goes to infinity.
3.2. Performance Metrics for Multiaccess Systems:Λandζ. In the remainder, we calculate, simulate, and compare network performance under various conditions and detectors. Here, we present measures that we found suitable for our study. In the literature, typically system throughputSas a function of the loadGis used for comparisons. However, it is a well-observed fact that in random schemes, obtaining maximum throughput with a finite number of users comes at the price of infinite queue sizes, that is, network instability (see, e.g., [1, 3, 26–28]). Hence, throughput alone is not
a meaningful measure for the performance of multiaccess systems, and researchers have used delay in addition to throughput. However, this makes the prediction of network performance hard if not unfeasible, since the quality of an accessing technique is not easily captured analytically. In fact, network-level performance limits are typically found through simulation, while only in some special cases in the
collision channel, analytical models are available (see, e.g., [25,29,30]). What makes matters more complicated in the case of RP-CDMA and spread Aloha is the fact that in the multiuser channel, multiple simultaneous transmissions not only may be successful but are in fact a feature to reduce delay and increase throughput. In fact, one may understand such multiuser systems as a set of (pseudo-) parallel channels that are correlated to some degree as a function of various receiver and network parameters. Considerable effort has gone into analytically predicting the stable-rate regions for the general case ofn >3 users—albeit without much success (see [5,19] for a discussion). Based on E, we show that at least in an environment with power control (all nodes are received at the same power level), the properties of the multipacket capture matrix itself allow us to express the maximum stablearrival rates(λn) given someE. The reason is as follows: the vector
of the diagonal elements ofE(opt)of an optimal multiaccess system withKusers has exactlyKelements of value 1:
diagE(opt)=1, (6)
where1is a 1×Kvector, that is,E=I. Hence,
ζ=diagE(opt)=K, (7)
and we denote the vector of the diagonal elements ofEasΛ.
Note thatΛrepresents the transmissions for whichk =
n, that is, all the transmitted packets which are received correctly. As stated previously, the number of nonzero elements on the diagonal of Eis the number of parallel channels provided by the system—correlated ifn,k <1. To
elaborate, based on the results presented in [5,7,8], we can calculate the elements on the diagonal ofEand use them as a measure of the number of parallel channels and the degree of their independence obtained through a specific method of multipacket reception. Furthermore, in a base station centric system, there is exactly one server for n customers. From the necessary condition for queue stability, which requires that the average arrival rateλ needs to be smaller than the average service rateΛ, multiplied by the number of servers in the system, we are left with the trivial finding that Λn
directly represents the upper limit on the stable arrival rates
λn for a number of 1 ≤ n ≤ K homogeneous (equal
arrival rate, equal power) users. We support this idea through simulations inSection 6.
Also, the closerζ is toK, the more parallel “channels” are provided and hence ζ is a measure of the optimality of a multiaccess system. This means that the elements of
Λ are a measure for the degree of orthogonality between the transmissions, and they can thus be used to determine the maximum arrival rates on these channels. As a result, we define η = ζ/K ≤ 1 as our quality of service (QoS) parameter.
4. The Performance of RP-CDMA Header
Detection and Similarities to Spread Aloha
The successful reception of a user’s packet in RP-CDMA requires correct header as well as correct data detection. We examine these factors individually, noting that packet transmission can be separated into two virtual channels— a header and a data channel (seeFigure 2). For one, header reception is affected by packet collisions on the chip-level of overlapping headers due to the system-wide identical header spreading sequences. In addition, due to the concurrent nature of packet transmissions, header detection has to operate under heavy interference. As follows, immediately from the fact thatLd > Lh, this interference is mostly caused
by data portions of competing packets. While in these two aspects similar to spread Aloha, in RP-CDMA, increasing the ratioLd/Lhreduces collision effects.
Packet 1 Packet 2
Packet 3
Packet 1 Packet 2
Packet 3
Vitrual header channel Vitrual data channel
Figure 2: Traffic in the virtual header and data channels. Since
Ld > Lh, interference for header detection is mostly generated by
header/data (h/d) overlaps from other users’ packets. This is shown in the case of the header of packet 3, which does not face (h/h) interference, but has to be captured in the presence of the data portions of packets 1 and 2.
successfully while only the weaker one is lost), we can express the probability for successful header detection as
p(h=succ)=minp(h=succ|coll), p(h=succ|inter), (8)
wherep(h=succ|coll) andp(h=succ|inter) denote the probabilities for correct header detection under the header collision and interference limitation models, respectively (the probability of successful header detection is the minimum of the probability of success of two independent processes: successful detection under the collision and the interference assumption). In contrast to header detection, data detection in RP-CDMA is only a function of the interference resolution capabilities of the data detector with associated probability of correct detection p(d = succ | inter). Thus, the overall system throughput (S) of an RP-CDMA system can be found as
SRP-CDMA=G×p(h=succ)p(d=succ|inter), (9) whereGdenotes offered load in packets. Note that the notion ofGdirectly implies that packets arrive in the transmitters queues at a rate ofλ=1 and are transmitted with probability
p(trans)=1. As a result, a load ofG =xpackets translates directly intoxactive transmitters out of the overall network population.
We proceed to build a realistic performance model of RP-CDMA in a step-by-step fashion, starting with the header process. At first, we model spread Aloha under an imaginary
collision-onlyassumption and transfer the results to the RP-CDMA header process. Next, we repeat this exercise but this time consider only interference. This gradual approach will later guide us to determine optimal parameter values as a function of RP-CDMA system load. We then investigate the performance of various multiuser receivers applied to the RP-CDMA data frame. Finally, we combine the results for the header (collision and interference limited) and data portions of the RP-CDMA system inSection 6.
4.1. Performance from a Collision Perspective. We now ad-dress the header collision effects by first investigating the behavior of spread Aloha and then use this understanding to model the RP-CDMA header process.
4.1.1. The Collision Limitation of Spread Aloha. In spread Aloha under the assumed system model (Section 2.3), a packet is lost if two or more packets overlap on the chip-level. Also, since the sequence is repeated for every bit, the collision vulnerable zone repeats L times throughout the packet duration in a packet of lengthL bits. We note that for every bit, a node hasNpossibilities to place the starting chip of its packet. We move on to express the conditional probabilities for packet survival in spread Aloha under the collision model,(SA, coll)
n,k .
Letui ≥0 denote the number of new packets in theith
chip, and note that when there arenactive users,
u1+u2+u3+· · ·+uN =n. (10)
However, (SA, coll)
n,k is obtained by exploring all possible
solutions to (10) and evaluating the ratio of the number of solutions where exactlykof theui’s are equal to 1 overAtot, the number of all possible solutions. This study, which is presented in the Appendix, leads to
(SA, coll)
n,k =
A(SA, coll)k
A(SA, coll)tot
= N
k
N−k−1 max(0,mmin)
N−k
m
A(SA)m
n+N−1
n
.
(11)
As an example, in the case whenN=10 andn=5, by using (11), we obtain
E(SA, coll)= ⎛ ⎜ ⎜ ⎜ ⎜ ⎜ ⎝
1 0 0 0 0
0 0.8182 0 0 0
0.4091 0 0.5455 0 0 0.1259 0.5035 0 0.2937 0 0.2248 0.1798 0.4196 0 0.1259
⎞ ⎟ ⎟ ⎟ ⎟ ⎟ ⎠.
(12)
Also here, the level of achievable QoS isη=0.56. From our discussion inSection 3.2, we expect this system realization to be able to support at most
(i) 1 stable user with a maximum arrival rate ofλ=1, (ii) 2 stable, homogeneous users with maximum arrival
rates ofλ=0.8182,
(iii) 3 stable, homogeneous users with maximum arrival rates ofλ=0.5455,
(iv). . . .
In Table 1, we further investigate the performance of spread Aloha in the collision model by presenting η asN
andK vary. There, we show by how much N needs to be increased as K grows to maintain a certain level of QoS. In the following, we use the obtained η ≈ 0.92 in the case when K = 5 and N = 100 as our baseline for comparison. As we double the number of users to K = 10, to maintain the same level of QoS, N needs to be increased to N = 400. Finally, as we further increase K
Table1: Spread Aloha, collision behavior asNandKvary.
η=ζ/K
K=5 K=10 K=20
N=100 0.926 0.7488 0.443
N=200 0.8575 0.462
N=400 0.925 0.748
N=800 0.856
N=1600 0.923
a multiplication of the spreading gain by a value of 24 is required to maintainη≈0.92. One can see that any doubling in the number of users K requires a quadratical increase in signaling dimensions N to maintain identical collision performance. This illustrates a fundamental problem of spread Aloha. Since it is impractical to increase the spreading gain dramatically because of the scarce wireless resource and also because of transceiver complexity, spread Aloha is limited to systems with a small number of active users. While basically, the RP-CDMA header process also relies on the principles of spread Aloha; given identical resources (i.e., a certain spreading gain N), RP-CDMA allows to improve
ζ by a factor of χ which is a function of Ld/Lh, such
that ζRP-CDMA = χ×(ζS-ALOHA), and χ > 1 grows with
Ld/Lh.
4.1.2. The Collision Limitation of RP-CDMA Header Detec-tion. For convenience, we refer to this scenario asRP-CDMA case (B)to be consistent with [31] (there,RP-CDMA case (A)
refers to the scenario when any header overlap automatically leads to the loss of all involved packets, i.e., the classical Aloha assumption). InRP-CDMA case (B), we assume that the receiver always has a sufficient number of parallel header detectors and packets are only lost due to collisions on the channel. To derive the conditional probabilities(B)
n,k for this
case, we note that only headers that actually overlap are subject to the spread Aloha mechanism. Hence,
(B)
n,k = n
|H|=n−k
a
n,n−|H||bH|,k−(n−|H|), (13)
whereaandb represent the probabilities for correct and
incorrect header detection due to collisions. Furthermore, |H|denotes the size of the set of the overlapping headers. For the evaluation of this equation, we recall that generally, the number of solutions of a function of the form shown in (13) in n variables is O(2n). As a result, an explicit computation of each individual solution for large values of N, n, and Ld/Lh is computationally prohibitive. In the
following, we thus restrict our investigations to the cases where n,N, and Ld/Lh are relatively small. For larger
networks, we resort to system-simulations for performance evaluation.
A study of (13) in the case when Nd = Nh = 10,
Ld/Lh=10, andn=5 results in the corresponding modified
multipacket reception matrix:
E(B)= ⎛ ⎜ ⎜ ⎜ ⎜ ⎜ ⎝
1 0 0 0 0
0 0.9669 0 0 0
0.0930 0 0.9050 0 0 0.0075 0.1688 0 0.8206 0 0.0139 0.0164 0.2476 0 0.7215
⎞ ⎟ ⎟ ⎟ ⎟ ⎟
⎠, (14)
andη(B) = 0.88. When we compareη(SA,coll)andη(B), it is clear that from a mere collision perspective,RP-CDMA case (B)will deliver far better QoS.
4.2. The Performance of RP-CDMA and Spread Aloha from an Interference Perspective. In the previous sections, we assumed that RP-CDMA as well as spread Aloha only face collision effects. We now more closely investigate the negative impact of interference on system performance. Our investigation includes the characteristics of header as well as data detection in RP-CDMA. We recall that the differentiation into header and data detection in RP-CDMA is necessary, since for header recovery, packet-specific timing information is not yet available and thus header detection has to rely on matched filtering. As soon as timing has been established, advanced multiuser techniques are available for the remainder of the packet. As far as spread Aloha is concerned, multiuser techniques cannot be used to improve performance because of its restrictive collision behavior (see [32–34]). Assuming that all transmitters in the network employ power control, the powers at the receiver (PRX,j) are
equal, and, therefore,PRX,j=P for allj, j=1,. . .,K.
4.2.1. Performance of Spread Aloha under Interference Effects.
Before addressing RP-CDMA from an interference perspec-tive, we first determine the achievable performance under spread Aloha. From [35, 36], the received SINR, Γ for a packetjwith a matched filter receiver is given by
Γ(mf)j =
Pj
σ2+ (1/N)n
i=1,i /=jPi, (15)
wherePjis the power of thejth user, and we assumednactive
packets in the system at the time packet jare transmitted. As we can see, the interfering powers are scaled down by the spreading factor (N). From (15), we can directly compute the maximum number of successfully detectable packetsncrit given some detection thresholdγas
γ≤ P
σ2+n crit−1
/NP,
ncrit≤
P−σ2γ
γP
N+ 1,
(16)
such that
n,k=
n,n=1, n≤ncrit,
n,0=1, otherwise,
(17)
As an example, withP/σ2=10 dB, a detection threshold of γ = 3 dB, a maximum number of active usersn = 6, and a spreading gain ofNSA=10, the modified multipacket reception matrixEhas the following form:
E(SA,inter)=
⎛ ⎜ ⎜ ⎜ ⎜ ⎜ ⎜ ⎜ ⎝
1 0 0 0 0 0 0 0 1 0 0 0 0 0 0 0 1 0 0 0 0 0 0 0 1 0 0 0 0 0 0 0 1 0 0 0 0 0 0 0 0 0 ⎞ ⎟ ⎟ ⎟ ⎟ ⎟ ⎟ ⎟ ⎠
. (18)
From another angle, since the nonzero elements in Λ are sufficient for stability analysis, we have
Λ=[1, 1, . . ., 1
ncrit=5
, 0,. . .]. (19)
In contrast to the view motivated by chip-level collisions inSection 4.1.1, here when doublingK, doublingN results in a linear increase in the number of detectable packets. Essentially,with perfect power control, Spread Aloha is in fact collision rather than interference limited(see also [32–34]).
4.2.2. Performance of RP-CDMA Header Detection under Interference Effects. Because of its packet structure, header detection in RP-CDMA faces interference from header/ header ((h/h)) and header/data (h/d) overlaps. As a conse-quence, since interference is dominated by (h/d) overlaps as outlined inFigure 2, from an interference perspective, dis-tributed access control, such as carrier sense multiple access with collision avoidance (CSMA/CA) on the header frame, is unlikely to significantly improve system performance.
For simplicity, in the following, we refer to the behavior of RP-CDMA header detection under equal power users as
RP-CDMA, case (C). In addition to perfect power control, we allow the nodes to increase the header transmission power over the data transmission power to increase the probability for correct header detection. Thus, to determine the level of multiaccess interference, we need to investigate the number of packet overlaps in both virtual channels as a function of Ld/Lh. For successful header detection, we require that
the total interference caused by overlapping (h/h) and (h/d) portions is less than some thresholdγ. We define the two supporting sets: (i)H: the set of (h/h) overlaps, and (ii)D: the set of (h/d) overlaps, and accordingly modify (15) as
Γ(mf)j =
Ph,i
σ2+1/N
h
HPh,k+
1/Nd
DPd,j
, (20)
wherejrefers to the packet under observation, whilePhand
Pdrepresent the transmission powers of the header and data
portions of the packet, respectively. In order to calculate the corresponding(C)
n,k, we note that the sizes of those sets,|·|,
givennactive packets, can be approximated by
|H| ≈E
h h
=nLh
Ld
,
|D| ≈E
h d
=n
1−Lh
Ld
.
(21)
0 5 10 15 20 25 30 35 40
Thr
o
ug
hpu
t
S
0 5 10 15 20 25 30 35 40
Number of transmitters
Ld/Lh=350
Ld/Lh=20
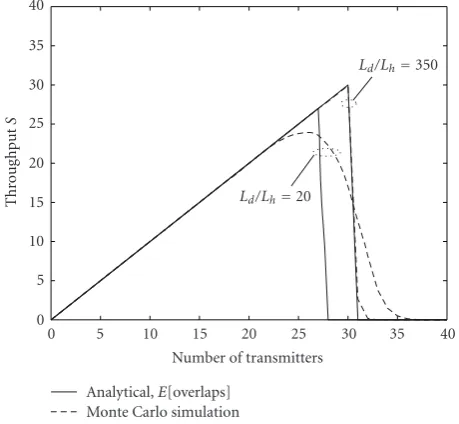
Analytical,E[overlaps] Monte Carlo simulation
Figure 3: Comparison of the approximations in (21) to Monte Carlo simulations of the header detection limitation in the case of equal receive SINRs ofPh/σ2=15 dB andPd/σ2=10 dB, spreading
gainN=20 and different ratiosLd/Lh=20 andLd/Lh=350.
Figure 3 shows the quality of our approximations for two values of Ld/Lh = 20 and Ld/Lh = 350 with Nh =
Nd = 20 compared to Monte Carlo simulations of system
performance. Even for the smaller value, expressing the number of overlapping headers and data frames in terms of their expected value leads only to a slight overevaluation of system throughput,S.
Substituting (21) in (20), noting that successful detection of the header requiresΓ(mf)j > γand dropping the user index
for simplicity, we get
ncrit≤
Ph/γ
−σ2
PhLh/NhLd+
Pd/Nd
1−Lh/Ld
+ 1. (22)
The elements in Ecan then be found by applying (17). As an example, when the header and data signal-to-noise ratios arePh/σ2 = Pd/σ2 = 10 dB, the header detector threshold
γ=3 dB,Nh=Nd=10, andLd/Lh=60, and the maximum
number of transmitters in the network is K = 7, the modified multipacket reception matrix E(C)(resp., Λ) have the form shown in (18) and (19) withncrit =5. Essentially, in this case, RP-CDMA header detection is limited by (h/d) interference. However, as we increase Ph/Pd = 0 dB to
0 50 100 150 200 250
ζ
200 150
100 50
0
N
=N h=
N
d 10
20 30
40 50
Ld/Lh
(a)
5 10 15 20 25 30 35 40
ζ
25 20
15 10
5 0
Ph /P
d(dB)
5 15
25 35 45
Ld/Lh
(b)
0 50 100 150 200 250
ζ
200 150
100 50
0
N
=N h=
N
d
10 15
20 25
30 35
Ph/σ 2(dB)
(c)
Figure4: Performance analysis of RP-CDMA header detection, equal receive powers, interference limit only. (a)ζfor fixed header and data transmission SINRs ofPh/σ2=15 dB,Pd/σ2=10 dB, and detection thresholdγ=3 dB as a function of the header and data spreading gains
N =Nh=Ndand the data to header ratioLd/Lh. (b)ζfor fixedNh=Nd=20 and varyingPh/σ2for a fixedPd/σ2=10 dB. (c)ζfor fixed
Ld/Lh=25 and fixed data transmission SINR ofPd/σ2=10 dB.
competing users. In spread Aloha, any increase in packet transmission power very strongly increases the interference for other packets and can thus have a disastrous effect for other users.
Finally, inFigure 4, we investigate the performance of the header detection process as a function of the spreading gains
Nh and Nd,Ph/Pd, as well as Ld/Lh. We assume a header
length of Lh = 50 bits, which allows for reliable timing
recovery as interference increases [37].Figure 4(a)presents variations ofζasN=Nh =NdandLd/Lhvary andPh/σ2=
15 dB,Pd/σ2 =10 dB, andγ=3 dB. We observe that while
increasing N = Nh = Nd offers a monotonic increase in
the number of detected headers, performance increases only slowly when we increase Ld/Lh alone. Figure 4(b)presents
similar results when we fixN=Nh=Nd =20 andPd/σ2=
10 dB and varyPh/σ2. IncreasingPh/σ2offers a monotonic
increase in the number of detected headers, while for a given
Ph/σ2andPd/σ2, increasingLd/LhbeyondLd/Lh ≈25 offers
little performance gain. Finally, in Figure 4(c), we observe that for fixed Ld/Lh = 25 andPd/σ2 = 10 dB, increasing
either or both,PhandN, improves system performance.
As a result of the discussion inFigure 4, we conclude that there is a point after which RP-CDMA becomesinterference limited instead of header collision limited, and increasing
Ld/Lhdoes not improve performance noticeably. This point
depends on the available header detection technology as well as on Nh, respectively, LdNd/LhNh and Ph/Pd. As an
example, with γ = 3 dB, little performance as a function of Ld/Lh can be gained onceLd/Lh > 25. In such cases, it
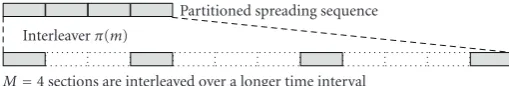
Partitioned spreading sequence
M=4 sections are interleaved over a longer time interval Interleaverπ(m)
Figure5: Partitioned and interleaved spreading for CDMA,M=4.
maximum effective ratio of header to dataon the channelof
NdLd/LhNh≈25 is maintained.
5. The Performance of RP-CDMA
Data Detection
In the following, we investigate the performance of RP-CDMA data reception with the matched filter, the decorre-lator, the MMSE, as well as partitioned spreading demod-ulation. We proceed to give a brief overview of the various multiuser receiver technologies.
5.1. Data Detection with the Matched Filter. Data detection in RP-CDMA with a matched filter receiver leads to the performance of spread Aloha, which was evaluated in Section 4.2.1.
5.2. Data Detection with the Decorrelator. The decorrelating receiver inverts the channel to completely eliminate interfer-ence. This results in a loss of energy for each user, depending on the user population. Interference no longer depends on the power of other users, and the SINR for packetjafter the decorrelating receiver reduces to SINR [35]:
Γ(deco)j =
Pj
σ2
N−n+ 1
N . (23)
In the equal power case, we can rewrite (23) and solve for the maximum number of detectable packets (ncrit) directly as
γ≤ P
σ2
N−ncrit+ 1
N . (24)
Rearranging this result, we get
ncrit≤N+ 1−γσ 2N
P , (25)
and(deco)
n,k follows from (17). In the case whenN=10,P/σ2
=10 dB,γ=3 dB, the correspondingE(deco)andΛ(deco)once more have the forms shown in (18) and (19) withncrit=9.
5.3. Data Detection with the MMSE Filter. The MMSE establishes a filter to minimize the mean-square error caused by noise and the multiaccess interference. For the MMSE receiver, a given packet j will be received successfully if its powerPjsatisfies [35]
γ≤ Pj
σ2+ (1/N)n
i=1,i /=j
PjPk/
γPk+Pi
. (26)
Under perfect power control, (26) reduces to
γ≤ P
σ2+n crit−1
/NP2/γP+P. (27)
This can be rearranged as
ncrit≤N
1 +γ γ −
1 +γ Pσ2
. (28)
In the case whenN =10,P/σ2=10 dB, andγ=3 dB, here also,E(mmse) andΛ(mmse) have the form shown in (18) with
ncrit=13.
5.4. Data Detection with Partitioned Spreading. Partitioned spreading is a recently proposed technique which utilizes the benefits of interleaving and iterative receiver processing. To make this paper more self-contained, we summarize the findings already presented in [36, 38, 39]. In partitioned spreading, the spreading waveform for each symbol is partitioned into M sections. The different sections are interleaved over a number of section intervals, as shown in Figure 5, and the gaps in the figure are filled by the partitions from other symbols. The interleaving function π(m) is to spread partitions of the original chip waveform such that interfering partitions belong to statistically independent symbols and no correlation can build up. The function of this interleaver is analogous to that used for turbo codes [40] and the received signal with K active users is given by
y(t)=
K
k=1
Pkxk(t) +n(t), (29)
where xk(t) is the signal from user k,n(t) is zero mean
white Gaussian noise with double-sided noise power spectral densityσ2=N
0/2.
The receiver operates with a number of stages (or iterations). The first stage is a conventional matched filter receiver. Due to the interleaving, each partition of the spreading waveform is individually filtered by a corre-sponding energy-normalized matched filter. Assuming that synchronization has been accomplished, the output signal after the matched filter of symbolland partitionmis given by
zk,l,m=
Pk
wherebk,lis the (binary) symbol of userkat positionl,nk,l,n
is white noise sample with powerσ2, andI
k,l,mis interference
from the other user, whose prefilter signal is given by
Ik(t)= K
k=1
k=/k
Pkxk(t). (31)
Simply, adding all the different matched partitions, that is, M
m=1zk,l,m, leads to the conventional matched filter receiver
for CDMA. Instead, we derive the a posteriori probability for the transmitted bitbk,lfrom each received samplezk,l,m, given
by
Prbk,l= ±1|zk,l,m
=κexp ⎛ ⎜ ⎜ ⎝−
zk,l,m±
Pk/M
2
2σ2
k ⎞ ⎟ ⎟ ⎠, (32)
where we have used the fact that Ik,l,m rapidly assumes a
Gaussian distribution asK becomes large. This is true for largeKandNunder mild conditions on the powersPk(see,
e.g., [41]). The varianceσ2
k is that of the joint interference
and noise, that is, ofIk,l,m+nk,l,n.
Since the different partitions have to agree on the transmitted bit, we compute the cumulative probabilities of
bk,las
Prbk,l= ±1|zk,l,1,. . .,zk,l,M
=κexp
− 1 2σ2
k M
m=1
zk,l,m∓
Pk
M
2
. (33)
From (33), we can compute asoft-bit estimateofbk,las
bk,l=ln
Prbk,l=1|zk,l,1,. . .,zk,l,M
−lnPrbk,l= −1|zk,l,1,. . .,zk,l,M
=tanh √ Pk
Mσ2
k M
m=1
zk,l,m
.
(34)
Such soft-bits are now used to reduce the mutual inter-ference. In a subsequent decoding step, soft-bits from the previous step are used to cancel part of the signal interference for each userk, given a next-stage received signal y(ki+1)(t)
where part of the interference has been canceled using reconstructed interference signals modulated by the soft-bits
bk(i),l,m=tanh ⎛ ⎜ ⎜ ⎜ ⎝ Pk √
Mσi2,k
M
m=1
m=/m
zk,l,m ⎞ ⎟ ⎟ ⎟
⎠, (35)
whereσi2,kis the residual variance ofIk,l,m+nk,l,nat stagei. The initial variance isσ0,2k=(K−1)/N+σ2.
We now calculate the varianceσ2
i,k of the interference and noise at iteration stagei. Due to the random spreading, the interference power of a userkon the postmatched filter
signal of userkis given byPkσi2,k,b/N, whereσi2,k,b=E(bk,l−
bk(i),l,m)2. Adding up all the contributions, we obtain
σ2
i,k= K
k=1
k=/k
σ2
b,i,kPk
N +σ
2. (36)
For large numbers of users K, and under some mild conditions on the powersPk[42], the interference variance becomes independent ofkas the contribution of thekth term vanishes, and is given by
σ2
i =
K
k=1
σ2
b,i,kPk
N +σ
2. (37)
How ever,Mm=1,m=/mzk,l,mhas mean and variance equal to
Pk(M−1)/(Mσi2) [38], and we can write
bk(i),l,m=tanh
M−1
M Pk σ2 i +
M−1
M Pk σ2 i ξ , (38)
whereξ∼N(0, 1). Now,
Ebk,l−bk(i),l,m
2
=E1−tanhb2+bξ2;
b=
M−1
M Pk σ2 i . (39)
Equation (39) has no closed-form solution, but the following bounds are tight [43]:
E1−tanhb2+bξ2
≤min
1
1 +b2,πQ(b) = ⎧ ⎪ ⎪ ⎨ ⎪ ⎪ ⎩ 1
1 +b2, b <1,
πQ(b), b≥1.
(40)
The assumption in (38) is admissible as long as the interleav-ing of partitions is sufficient to ensure no or only minimal correlation among successive soft-bits used for cancellation. This is usually quickly achieved even with moderate levels of spreading in the order of a few hundred symbols. Using (37) and the bound (40), the variance evolution follows:
σ2
i ≤
K
k=1
Pk
N min
1
1 +(M−1)/MPk/σi2−1 ,
πQ
M−1
M Pk
σi2−1
+σ2,
(41)
where the summation is over all active users, andMdenotes the number of partitions. A packet j will be successfully decoded if after iterationi, its SINR satisfies
Γj(ps)=
Pj
σ2
i
≥γ.
0 0.1 0.2 0.3 0.4 0.5 0.6 0.7 0.8 0.9 1
η
−3 2 7 12 18 23
SNR(eff)(dB)
PS-CDMA MMSE
Decorrelator Matched filter
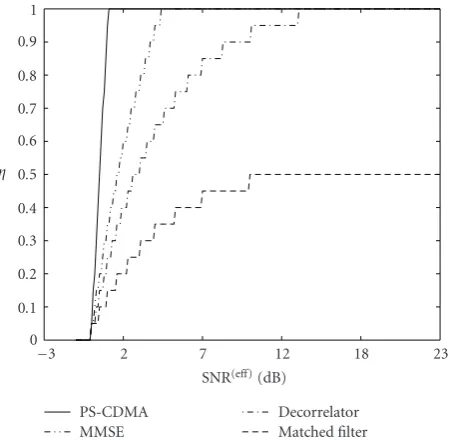
Figure6: Comparison of the achievableη= f(SINR(eff)) for the different receivers, equal power, SINR(eff) = SINR−γ. Spreading gain for all reception methodologies of N = 20 with detection thresholds ofγ=3 dB, partitioning factorM=N/4.η=1 reflects afully loaded system, that is, optimal performance.
5.5. Comparison of the Various Multiuser Receivers. In Figure 6, we compare the maximumηas a function of the effective SINR which can be presented asη= f(SINR(eff)), SINR(eff)=(SINR−γ), achievable with the various receivers presented above. We assume a spreading gain ofN=20 and detection thresholds ofγ=3 dB. We recall thatη=1 reflects a fully loaded system, that is, the optimal multiple access system. For SINR(eff) ≥ 1 dB, partitioned spreading allows for such a fully loaded system with one user per dimension, making it the most spectrally efficient receiver. Also,η(ps)is followed by the MMSE which achieves η(mmse) = 1 at an SINR(eff) ≈ 4.5 dB and the decorrelator which requires a significantly higher-powered environment of approximately 13 dB forη(dc)=1. As expected from [35], the matched filter receiver is unable to achieveη=1, andη(mf)1.
6. Network Simulations
We now simulate RP-CDMA in base station centric networks with the various detectors introduced and evaluated above. We investigate throughput as well as average queue sizes. Again, our baseline for comparison is spread Aloha. From Section 4, we recall that the performance of RP-CDMA— especially when partitioned spreading detection is applied to the data frame—is critically determined by the interference suppression capabilities of the header detection stage rather than by the header collision process.
We assume that the accessing terminals are located in a cell and transmit packets to a central base station according to Section 2.4. For our analysis of the nodes’ queues, we introduceΩ, defined as the average growth rate of the queues
per (re-)transmission attempt. In general, the value of Ω lies between Ω = 0, indicating that every transmission was a success, and Ω = 1, indicating that no packet could be transmitted successfully during a transmission attempt, hence maximum queue buildup. In the following subsections, we validate through simulations our earlier claim made inSection 3.2, where we stated thatΛpresents the upper limit of the vector of arrival rates λwhich leads to network stability. In contrast to previous sections, in our network simulations, thecollision behaviorof RP-CDMA as well as spread Aloha captures their intended asynchronous mode of operation. Once more, we envision the application of strong error-correcting codes in the data stages, thus the modeling of asynchronous packet overlap is not necessary for the systems’interference behavior. To determine the value forLd/Lh, we turn our attention to Internet2 traffic. There,
the packet size is trimodally distributed with lengths of
L = 50, L = 500, and L = 1500 bytes and respective probabilities of occurrence of p(L = 50) = 0.5, p(L = 500) = 0.4, and p(L = 1500) = 0.1 [44]. Assuming a header length of Lh = 50 bits, we have E[Ld/Lh] =
60. Clearly, with these figures and from a mere collision perspective, RP-CDMA promises great improvements over spread Aloha, possibly approaching the performance of a fully access controlled system, as was also concluded in [6,45,46]. In our model, we assume that any packet that exceeds the detection threshold will be decoded, respectively, detected successfully.
We now demonstrate thatΛ allows us to find a vector of stable arrival ratesλ. FromSection 4, for the parameters chosen for spread Aloha inFigure 7, the vector of the diag-onal elements of the resulting effective modified multipacket reception matrix (Λ(SA,eff)) are
Λ(SA,eff)
=minΛ(SA,coll),Λ(SA,inter)
=[1.000, 0.905, 0.740, 0.547, 0.365, 0.219, 0.118, 0.057], (42)
and all other elements are zero. In Figure 7, we show (a) system throughputS, and (b) the rate of the growth of the queue size,Ω, for three different realizations ofλ: (i),λ=1, (ii),λ = Λn, wheren ≤ K denotes the desired number of
stable users, and (iii), λ = Λn+, where = 10% of the
corresponding entries inΛ. We chose a rather large value of
to accelerate the increase inΩ, since as the number of active transmitters increases, the respective elements inΛdecrease in value quickly, making transmissions less likely. The case whenλ=1results in maximum throughput for the system— but leads to queue instability. Whenλ=Λnas seen in (b), the
average growth of the queue sizes remainsΩ=0 for all loads. However, the throughput dropped significantly, achieving a maximum ofSλ=Λ ≈ 2.2 at a load ofG = 3 compared to
Sλ=1 ≈ 4.3 at G = 8. As λ is increased to λ = Λn+,
throughput slowly increases towardsSλ=1, however, queues
begin to build up.
0 0.5 1 1.5 2 2.5 3 3.5 4 4.5
Thr
o
ug
hpu
t
S
0 1 2 3 4 5 6 7 8 9 10
Number of transmitters,p(trans)=1
λ=1 λ=Λ
λ=Λ+
(a)
0 0.1 0.2 0.3 0.4 0.5 0.6 0.7 0.8 0.9 1
Ω
0 1 2 3 4 5 6 7 8 9 10
Number of transmitters,p(trans)=1
λ=1 λ=Λ
λ=Λ+
(b)
Figure7: Spread Aloha, comparison of three different arrival rates,
Λ=1,λ=Λn, andλ=Λn+, where=10% of the corresponding
value inΛ. (a) network throughput and (b),Ωas functions of the network load, G. N = 20, PSA/σ2 = 12 dB, detection threshold
γSA =3 dB. Achieving maximum throughputS =Smaxcomes at the expense of increasingΩ.
system. The less a given E equals I—as indicated by the difference betweenζand the number of usersn—the bigger the difference between Sλ=1 and Sλ=Λ. In other words,
such systems are spectrally inefficient, and since the stable arrival rates are low, they should be restricted to low-traffic networks. On the other hand, the moreEapproachesI, the less the difference betweenSλ=1 andSλ=Λ. This means that
0 5 10 15 20 25 30 35 40
Thr
o
ug
hpu
t
S
0 5 10 15 20 25 30 35 40
LoadG, number of transmitters,λ=1,p(trans)=1 Header
process
S=G
PS-CDMA MMSE
Decorrelator Matched filter (a)
0 0.1 0.2 0.3 0.4 0.5 0.6 0.7 0.8 0.9 1
Ω
0 5 10 15 20 25 30 35 40
LoadG, number of transmitters,λ=1,p(trans)=1 Header process
PS-CDMA MMSE
Decorrelator Matched filter (b)
Figure8: (a) Network throughput and (b),Ωas a function of the network load,G.Nh =Nd =20, trimodal packet sizes andLh =
50 bits such thatE[Ld/Lh] = 60.Pd/σ2 = 12 dB,Ph/σ2 = 15 dB.
Detection thresholds ofγd = 3 dB,γh = 1 dB. For partitioned
spreading,M=Nd/2=10.
the network is able to support a large and very active user base, allowing the system to best harness its assigned spectral resources.
We now compare these results to the achievable perfor-mance under RP-CDMA.Figure 8shows simulation results in the case when the header and data SINRs are Ph/σ2 =
Furthermore, the header and data spreading gains areNh =
Nd = 20, we assume trimodal packets with a header size
of 50 bits and a data detection threshold of γd = 3 dB
as in the case of spread Aloha presented above. For data detection, we employ all multiuser detectors discussed in Section 4. For header detection, we assume a threshold for matched filtering of γh = 1 dB. Choosing a lower
threshold is possible in RP-CDMA, since the header is merely used for timing and code-ID recovery with resulting low transmission rates. While the value of 1 dB has been chosen somewhat arbitrarily, we note that even lower values might be possible in practice (see [47]) for a discussion on the fundamental limits of detection in the low SINR regime. Like before,Figure 8(a)shows achieved throughput (S) and Figure 8(b) depictsΩ, both versus offered loadG. Starting withFigure 8(a), we first see that just like in the case of spread Aloha, the header process is unable to follow the optimalS=
Gcurve as soon as the load increases beyondG=1. However, in contrast to before, the difference between the header throughput and S = Gis less pronounced, even at a load ofG= 40 transmissions. Essentially, the throughput in the (virtual) header channel diverges only slowly from optimal behavior. Hence, the remaining question to be answered is what fraction of this possible performance can be harnessed by the RP-CDMA data-detection stage. Proceeding from lowest to highest performance, we have the matched filter followed by decorrelation detection, collapsing at a load of
G=18 transmitters. This is easily exceeded with the MMSE, where the supportable number of transmissions equalsG= 27 packets. Even higher performance can be achieved with partitioned spreading demodulation, where the maximum load approachesG = 34, in unison with [38,39,48]. For all the receivers, the throughput curves break down rapidly, indicating that after a certain load, the effective SINR after the detector was not sufficient for detection. As we focus our attention on the behavior of the queues inFigure 8(b), since the throughput in the virtual header channel diverges from
S=Ginstantly due to the limitations of the header process, the queues grow in size at all loads.
Fortunately, especially in packet-switched systems,P is very unrealistic, and of course, stable operation is very possible by adhering to the elements inΛ.
6.1. Effect of the Header Frame on the Stability Region of RP-CDMA. Figure 9 summarizes our observations. There, we analyze the stable rates in the header and data channels separately and compare them to spread Aloha. Here, we see that in all cases of RP-CDMA data detection, the rate region formed byΛ(eff) =min{Λ(h),Λ(d)}is determined by the RP-CDMA header process. Interestingly, while especially from previous throughput plots, it seemed that upgrading the RP-CDMA data detection stage from matched filtering to partitioned spreading is necessary to increase the user base, in fact, as a result of the low supportable stable arrival rates in the virtual header channel, the rates for all of the additional users are diminishing to zero quickly. This leads to the following conclusion: due to the low stable header rates, the number of packetsnsimultaneously “seen” by the
(0,0) (0,1)
(13,0.6)
(20,0.25)
(28,0.2) (34,0)
0.2 0.4 0.6 0.8 1
Λn
5 10 15 20 25 30 35 40
Number of transmitters RP-CDMA
header process
PS-CDMA,Λ(ps)n
MMSE,Λ(ps)n
Decorrelator,Λ(deco)n
Matched filter,Λ(mf)n
f(h-dete)
Spread Aloha
Figure9: Comparison of user arrival rate regions which lead to network stability.NSA = Nd = Nh = 20, trimodal packets and
Lh = 50 bits such that E[Ld/Lh] = 60.Ph/σ2 = 15 dB,Pd/σ2 =
PSA/σ2=12 dB. Detection thresholds ofγd=γSA=3 dB,γh=1 dB.
For partitioned spreading,M = Nd/2 = 10. As indicated by the
arrow labeled f(h−dete), the area under the RP-CDMA header process generally increases as a function ofNh,Ld/Lh,Ph/Pdand as
γh→0.
receiver for the data stage is reduced. Hence, according to the definition of the conditional probabilities for reception,
n,k = p(kpackets are correctly received | nare active),
depending on the actual performance in the header channel, simple linear multiuser receivers may be sufficient in the data stage even for large networks. As an example, at the point labeled as (20,0.25),n = 20 users can be active with a maximum arrival rate ofλ = 0.25. From Figures 8 and 9, it seems that for such a network, at least a decorrelation receiver is required. However, with an expected number of simultaneous packets n ofE[n] = 20×0.25 = 5 in the virtual data channel, we see that, in fact, with a probability of 5,5 = Λ(mf)5 = 1, the matched filter receiver is able to recover all transmissions. So while initially, a load of
n = 20 indicated that matched filtering is not a sufficient choice for data detection of 20 users, due to the effects of the header channel which require low rates to maintain network stability, it may be all needed. Note, however, that the specific instantaneous traffic patterns (i.e., burstiness) may still require more advanced data detection.
Nevertheless, although it seems that there may be limited benefit in upgrading to partitioned spreading demodulation in certain cases, this may only be a part of the picture. It was shown in [38, 39, 48] that in contrast to other receiver methodologies, partitioned spreading allows to resolve virtually all multiuser interference. In our model, the rate regions for the various demodulators are formed by the packets whose SINR after the demodulator satisfyΓi> γ; this
arrival ratesare determined by the header process, the usable
data ratesare determined by the demodulation scheme. As a result, even in our example with only 5 concurrent users in the data channel, partitioned spreading allows forhigher data ratesand, therefore, higher spectral efficiency. Another perspective on this issue is that for a targeted data rate, partitioned spreading demodulation allows to transmit the data frame at a lower SINR, therefore, making it possible to increase Ph/Pd which improves the performance in the
header channel. As we have seen inSection 4, the behavior of the header process is nonlinear in some parameters and improving its performance directly faces limitations. Along these lines, upgrading RP-CDMA to partitioned spreading demodulation might be the easier and more practical way to improve performance.
Once more, we want to point that these observations are different from a conclusion one might draw based solely on the throughput curves inFigure 8, which may lead one to believe that matched filtering isnevera satisfying candidate for the data demodulator as the network increases. Lastly, we recall that the area under the header-process generally increases withNh,Ld/Lh,Ph/Pdand asγh→0, thus allowing
to harness more of the performance of a more advanced data detection stage.
6.2. A Note on the Achievable Spectral Efficiency of RP-CDMA.
Also as a result of our investigations, it is clear that the overall spectral efficiencyC(eff)of an RP-CDMA system is critically determined by its header process. Of course, trivially, the impact of the additional header frame on RP-CDMA system performance as well as onC(eff)goes to zero as
Nh,Ld
Lh
,Ph
Pd −→ ∞
, (43)
and/or the threshold for header detectionγh:
γh−→0 (≡ −∞dB). (44)
As the effect of the header diminishes, the performance of RP-CDMA is directly and only determined by the data-detection scheme. We want to refer the curious reader to [48] for a discussion on the achievable spectral efficiency of partitioned spreading.
7. Conclusions
We revisited RP-CDMA, a transmission scheme that was designed from the start as a cross-layer method and discussed its performance from a throughput and stability perspective. In contrast to previous works, our investigations were based on a realistic model for header and payload transmission. We showed how the characteristics of multipacket header reception on the physical layer make it possible to simplify the MAC layer, and at the same time allow to maintain very high system performance. While earlier results suggested that RP-CDMA throughput is only limited by the capabilities of the base station receiver as the ratio of data frame to header frame increases, we showed that, with a realistic model which
takes multiuser interference into account, there is a point after which the RP-CDMA header process becomes interfer-ence limitedinstead ofheader collision limited, and increasing the ratio does not noticeably improve performance.
For the analysis of the quality of RP-CDMA payload detection, we compared the performance of partitioned spreading demodulation to the matched filter receiver, the decorrelator, and the MMSE filter. As expected, partitioned spreading greatly outperforms other reception methodolo-gies, lead by the MMSE, the decorrelator, and finally the matched filter receiver.
We used two performance measures based on the modified multipacket capture matrix (E) termedζ andΛ. Through simulation, we showed that in equal power systems and with a transmission probability ofP=1,Λnpresents an
upper bound on the arrival ratesλ which lead to network stability for nhomogeneous (i.e., equal arrival rate, equal power) users. Also, since ζ is formed by summing the elements ofΛ, it can thus be used to capture the degree to which an accessing system or receiver is able to provide for user separation. Our analysis is supported by the theoretical works of Naware, Mergen and Tong in [5,7,8].
We simulated the throughput and delay characteristics of an RP-CDMA network and compared it to spread Aloha in a base station centric environment. Since the achievable stable arrival rates with RP-CDMA are critically determined by the header process and for additional users are diminishing to zero quickly, even for large networks, “weaker” multiuser receivers can be sufficient for the data stage. However, because of the vastly superior interference resolution capa-bilities and the near-far resistance of partitioned spreading, in all cases, much higher data rates can be used with such a demodulator—thus improving system performance.
Appendix
Letui≥0 denote the number of starting chips of packets in
theith chip, and note that when there arenactive users,
u1+u2+u3+· · ·+uN =n. (A.1)
This equation has a total of A(totA) = (n+Nn−1) solutions.
In a first step, we distribute the start of new packets in the
N chips such that allk packets (and thusktransmissions) are successful. This is the case if thekpackets are distributed over the total ofN available chips, and ui ∈ (0, 1). In the
next step, we distribute the remaining (n−k), remembering that this time, the transmission is not successful, respectively. Since thekpackets are successful, we can write the another equation as
u1+u2+u3+· · ·+uN−k=n−k. (A.2)
Furthermore, let m denote the ui which have a value
of ui = 0, of which we have exactly (Nm−k). In the rest of
the chips, there are more than two starting chips of packets; therefore, we can write the new equation as
u1+u2+· · ·+uN−k−m=n−k−2(N−k−m), ui≥0,