Volume 2008, Article ID 280635,10pages doi:10.1155/2008/280635
Research Article
A Novel Retinal Identification System
Hadi Farzin,1Hamid Abrishami-Moghaddam,1and Mohammad-Shahram Moin2
1Department of Electrical Engineering, K.N. Toosi University of Technology, Seyed Khandan, 16315-1355 Tehran, Iran 2Iran Telecommunication Research Center, North Kargar, 14399-55471 Tehran, Iran
Correspondence should be addressed to Hamid Abrishami-Moghaddam,[email protected]
Received 1 May 2007; Revised 27 December 2007; Accepted 21 February 2008
Recommended by Nikolaos V. Boulgouris
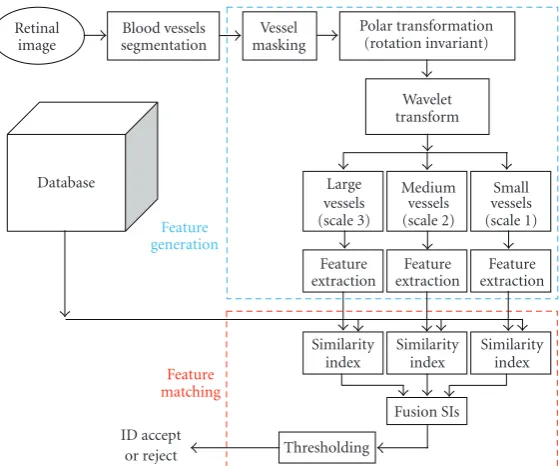
This paper presents a novel biometric identification system with high performance based on the features obtained from human retinal images. This system is composed of three principal modules including blood vessel segmentation, feature generation, and feature matching. Blood vessel segmentation module has the role of extracting blood vessels pattern from retinal images. Feature generation module includes the following stages. First, the optical disk is found and a circular region of interest (ROI) around it is selected in the segmented image. Then, using a polar transformation, a rotation invariant template is created from each ROI. In the next stage, these templates are analyzed in three different scales using wavelet transform to separate vessels according to their diameter sizes. In the last stage, vessels position and orientation in each scale are used to define a feature vector for each subject in the database. For feature matching, we introduce a modified correlation measure to obtain a similarity index for each scale of the feature vector. Then, we compute the total value of the similarity index by summing scale-weighted similarity indices. Experimental results on a database, including 300 retinal images obtained from 60 subjects, demonstrated an average equal error rate equal to 1 percent for our identification system.
Copyright © 2008 Hadi Farzin et al. This is an open access article distributed under the Creative Commons Attribution License, which permits unrestricted use, distribution, and reproduction in any medium, provided the original work is properly cited.
1. INTRODUCTION
Biometric identification systems become a real demand for improving the security issues in different organizations. Commonly used biometric features include face, fingerprint, voice, facial thermogram, iris, retina, gait, palm print, hand geometry, and so on [1, 2]. Among these features, retina may provide higher level of security due to its inherent robustness against imposture. On the other hand, retinal pattern of each subject undergoes less modification during life. In spite of these properties, retina has not been used frequently in biometric systems mainly because of techno-logical limitations in manufacturing low-cost scanners [3–
6]. This is the reason why few works have been published on human identification using retinal images [7–10]. Nowadays, with the progress in retinal scanner technology, relatively low-cost retinal scanners are introduced to the market [6, 11]. The first identification system using commercial retina scanner called EyeDentification 7.5 was proposed by EyeDentify Company in 1976 [6]. Retinal-based recognition for personal identification has further desirable properties such as uniqueness, stability, and noninvasiveness. The
features extracted from retina can identify even among genetically identical twins [12]. Uniqueness of retina comes from uniqueness of blood vessels pattern distribution at the top of the retina.
[9] to compute the parameters of a rigid transformation between feature vectors which gives the highest matching score. This algorithm is computationally more efficient with respect to the algorithm presented in [9]. However, the performance of the algorithm has been evaluated using a very small database including only 14 subjects. Recently, Tabatabaee et al. [8] presented an approach for human identification using retinal images. They localized the optical disk using Haar wavelet and active contour model and used it for rotation compensation. Then, they used Fourier-Mellin transform coefficients and complex moment magnitudes of the rotated retinal image for feature definition. Finally, they applied fuzzyC-means clustering for recognition and evaluated their algorithm on a database including 108 images of 27 different subjects.
In this paper, we present a new biometric identification system based on retinal images. The system generates rotation invariant features by using polar transformation and multiscale analysis of retinal segmented images. For identifi-cation, the system uses a modified correlation function for computing similarity index measure. Experimental results using our new identification system demonstrated its high performance. Our retinal identification system is novel in the following ways: (i) our recently introduced state-of-the-art algorithm [13] is used for vessel detection; (ii) a new multiscale code representing the blood vessel distribution pattern around the optical disk is introduced and used as feature vector; and (iii) a new similarity index called modified correlation is defined for feature matching.
This paper is organized as follows. Section 2 will talk about retinal technology. Section 3 provides an overview of our new biometric identification system. In Section 4, we describe our vessel segmentation algorithm. Sections
5 and 6 are devoted to feature generation and matching modules, respectively. Evaluation results and discussion are presented inSection 7. Finally, concluding remarks are given inSection 8.
2. OVERVIEW OF RETINAL TECHNOLOGY
2.1. Anatomy of the retina
Figure 1shows a side view of the eye.The retina is approx-imately 0.5 mm thick and covers the inner side at the back of the eye [8]. In the center of the retina is the optical nerve or optical disk (OD), a circular to oval white area measuring about 2×1.5 mm across (about 1/30 of retina diameter) [14]. Blood vessels are continuous patterns with little curvature, branch from OD and have tree shape on the surface of retina (Figure 2). The mean diameter of the vessels is about 250μm (1/40 of retina diameter) [14].
The retina is essentially a sensory tissue which consists of multiple layers. The retina also consists of literally millions of photoreceptors whose function is to gather the light rays that are sent to it and transform that light into electrical impulses which travel through the optic nerve into the brain, which then converts these impulses into images.The two distinct types of photoreceptors that exist within the retina are called rods and cones. The cones (there are about 6 million cones)
Anterior chamber
Vitreous body
Fovea
Optic nerve
Retina Choroid Sclera
Iris Cornea
Visual axis Lens
Figure1: Eye anatomy [15].
Optical disk
Figure2: Retina images from four different subjects.
help us see the different colours, and the rods (there are about 125 million rods) help with night and peripheral vision.
2.2. How the retinal anatomy can be used to identify people?
When talking about the eye, especially in terms of biometrics, there is often confusion between the iris and the retina of the eye, in that the two are similar. While the iris and the retina can be grouped together into one broad category called “eye biometrics,” the function of the two are completely different. The iris is the colored region between the pupil and the white region of the eye (also referred to as the sclera). The primary role of the iris is to dilate and constrict the size of the pupil. As shown in Figure 1, the iris is located in the front of the eye, and the retina is located towards the back of the eye. Because of its internal location within the eye, the retina is not exposed to the external environment, and thus it possesses a very stable biometric. It is the blood vessel pattern in the retina that forms the foundation for the science and technology of retinal recognition. Figure 2shows different retinas captured from four people.
2.3. Retinal scanners
The first major vendor for the research/development and production of retinal scanning devices was a company called EyeDentify, Inc. This company was created in 1976. The first types of devices used to obtain images of the retina were called “fundus cameras.” These were instruments created for ophthalmologists but were adapted to obtain images of the retina. However, there were a number of problems using this type of device. First, the equipment was considered to be very expensive and difficult to operate. Second, the light used to illuminate the retina was considered to be far too bright and discomforting to the user.
As a result, further research and development were con-ducted, which subsequently yielded the first true prototype of a retinal scanning device in 1981. This time, infrared light was used to illuminate the blood vessel pattern of the retina. Infrared light has been primarily used in retinal recognition because the blood vessel pattern in the retina can absorb infrared light at a much quicker rate than the rest of the tissue in the eye. The infrared light is reflected back to the retinal scanning device for processing. This retinal scanning device utilized a complex system of scanning optics, mirrors, and targeting systems in order to capture the blood vessel pattern of the retina [6]. However, later research and development created devices with much simpler designs. For example, these newer devices consisted of integrated retinal scanning optics, which sharply reduced the costs of production, in comparison to the production costs of the EyeDentification System 7.5.
The last known retinal scanning device to be manufac-tured by EyeDentify was the ICAM 2001. This device could store up to 3000 enrolees, with a storage capacity of up to 3300 history transactions [16]. However, this product was eventually taken offthe market because of user acceptance and public adoption issues and its high price. It is believed that some companies like Retica Systems Inc. are working on a prototype retinal scanning device that will be much easier to implement into commercial applications and will be much more user friendly [11].
In summary, given its strong and weak points, retinal recognition has the potential to be a very powerful biometric identification technology. In Figure 3, you can see four types of retinal scanners: (a), (b), and (c) correspond to human retinal scanner, and (d) corresponds to animal retinal scanner.
2.4. The applications of retinal recognition
The primary applications for retinal recognition have been for physical access entry for high security facilities. This includes military installations, nuclear facilities, and labora-tories. One of the best-documented applications of the use of retinal recognition was conducted by the State of Illinois, in an effort to reduce welfare fraud. The primary purpose was to identify welfare recipients, so that benefits could not be claimed more than once. Iris recognition is also used in conjunction with this project [11]. Retinal imaging is a
(a) (b)
(c) (d)
Figure3: Some retinal scanners, (a) a human retinal scanner, (b) and (c) human retinal recognition scanners, and (d) a cow retinal scanner.
form of identification that can be used in both animals and humans.
2.5. The strengths and weaknesses of retinal recognition
Retinal recognition also possesses its own set of strengths and weaknesses, just like all other types of biometric technology. The strengths can be described as follows.
(i) The blood vessel pattern of the retina hardly ever changes over the lifetime of an individual. Moreover, the retina is not exposed to the threats posed by the external environment, as other organs such as fingerprint.
(ii) The retinal recognition is robust against imposture due to inaccessibility of the retina.
(iii) The actual average feature vector size is very small compared to other biometric feature vectors. This could result in quicker verification and identification processing times, as opposed to larger sized feature vectors such as in iris recognition systems [17], which could slow down the processing times.
(iv) The rich and unique features which can be extracted from the blood vessel pattern of the retina.
The weaknesses can be described as follows.
(i) An individual may be afflicted with some diseases of the eye such as hard glaucoma, cataracts, and so on which complicate the identification process.
Polar transformation (rotation invariant) Vessel
masking Blood vessels
segmentation Retinal
image
Wavelet transform
Large vessels (scale 3)
Medium vessels (scale 2)
Small vessels (scale 1) Feature
extraction
Feature extraction
Feature extraction
Similarity index
Similarity index
Similarity index Fusion SIs
Thresholding ID accept
or reject
Feature matching Feature generation
Database
Figure4: Overview of the proposed retinal identification system.
requires a conscious effort on the part of the user. All these factors adversely affect the public acceptability of retinal biometric.
(iii) Retinal vasculature can reveal some medical condi-tions, for example, hypertension which is another factor deterring the public acceptance of retinal scan-based biometrics.
3. PROPOSED SYSTEM BLOCK DIAGRAM
Figure 4 illustrates different parts of our new biometric identification system based on retinal images. As illustrated in the block diagram, this system is composed of three principal modules including blood vessel segmentation, feature generation, and feature matching. Blood vessel seg-mentation provides a binary image containing blood vessels pattern which will be used by the next module. Feature generation module contains several submodules: (i) vessel masking in the vicinity of OD, (ii) polar transformation to obtain a rotation invariant binary image containing major retinal vessels, (iii) multiscale analysis of the resulted binary image using wavelet transform in order to separate vessels according to their diameter sizes,and (iv) feature vector construction from three images, each containing vessels with specified range of diameter size. Feature matching module contains the following submodules: (i) computation of similarity indices called SIs for three different scales, (ii) scale-weighted summation of SIs for generating the total SI, and (iii) thresholding the computed SI for subject identification.
4. BLOOD VESSEL SEGMENTATION
Blood vessel segmentation is essential for our biometric identification system. For extracting retinal vessels, we use
an algorithm, recently introduced by Farzin et al. [13] based on a local contrast enhancement process. This algorithm includes the following steps: (i) using a template matching technique OD in retinal image is localized; (ii) the orig-inal image is divided by the correlation image obtained in the previous step to achieve a new image in which undesired brightness effect of OD is suppressed, (iii) the vessel/background contrast is enhanced using a new local processing operation based on statistical properties of the resulted image, and (iv) finally, a binary image containing blood vessels is resulted by histogram thresholding of the contrast enhanced image.
4.1. Localizing optical disk and removing its effect in retinal image
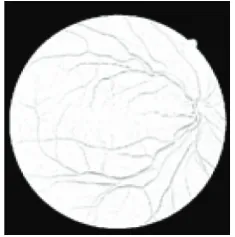
Here, we use a template matching technique to localize the optic disk. For this purpose, we correlate the original green plane image with a template. The template is generated by averaging rectangular ROIs containing OD in our retinal image database [13]. After correlating each retinal image with the template, OD is localized as a bright region in the correlated image with high density of vessels.Figure 5shows the template and the resulted correlated image. As illustrated, the bright region in the correlated image corresponds to OD in the original image.
The original image is subsequently divided (pixel by pixel) by the correlation image obtained in the previous step to achieve a new image in which undesired brightness effect of OD is suppressed (Figure 6).
(a) (b) (c)
Figure5: Optical disk localization: (a) original image, (b) template, and (c) correlated image.
(a) (b)
Figure6: OD removing results: (a) original image, (b) reducing of OD effect in the original image.
the vessel distribution pattern in the vicinity of OD, its localization may be used for compensating the variation of vessel distribution pattern caused by the variation in OD location.
4.2. Local contrast enhancement
In local processing operation, a sliding window of sizeM×
M (M is at least 50 times smaller than the dimensions of the original image) is used to obtain a contrast enhanced image. In each pixel, the new value is computed using the mean/variance of window values and global maxi-mum/minimum values of the pixels in the original image. Let f(i,j) be the value of the pixel (i,j) in the original image. The enhanced image g(i,j) is computed according to the following equations [13]:
f(i,j)−→g(i,j)= H−wmin
wmax−wmin,
H= 1
mean + (1/√var) exp−mean−f(i,j)0.98/√var,
wmin= mean
1 + exp−mean−fmin/√var,
wmax= mean
1 + exp−mean−fmax/√var,
(1)
Figure7: Local contrast enhanced image.
(a) (b)
Figure 8: Morphological correction: (a) vessels after contrast enhancement, (b) vessels after morphological correction.
where var and mean are variance and mean of the values inside the window, and fmin and fmax are global minimum and maximum of the original green plan image, respectively. It is clear thatHis a mapping function from f tog.Figure 7
shows the local contrast enhanced image.
4.3. Morphological enhancement
After local contrast enhancement process, we encounter a problem that large vessels are transformed to two parallel curves as illustrated inFigure 8(a). This problem is caused by small size of the selected window (in the previous step) compared to the large vessels size. To solve this problem without modifying vessels thickness, we use morphological dilation and erosion to fill the blank space between the two parallel curves. Figure 8(b) shows the large vessel in
(a)
r1
r2
(b)
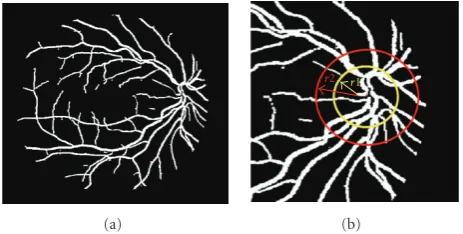
Figure9: Blood segmentation and masking: (a) vessels pattern, (b) region of interest of vessels images around OD.
4.4. Histogram thresholding
To achieve a binary image containing the blood vessels pat-tern, we apply an optimal thresholding technique [18] to the results provided by the previous stage.Figure 9(a)illustrates the final vessel segmentation result after thresholding.
4.5. Segmentation results
The vessel segmentation algorithm was presented and evalu-ated in detail in our previous paper [13]. This algorithm was applied to two databases including DRIVE [19] and STARE [20]. The average accuracies of our algorithm were 0.937 and 0.948 for DRIVE and STARE databases, respectively, which are comparable to state-of-the-art vessel segmentation methods [15,19–25].
5. FEATURE GENERATION
Our retinal identification system uses features of blood vessels pattern including their diameters and their relative locations and angles. For generating these features, the algorithm uses four submodules as briefly introduced in
Section 2.1. Detailed descriptions of these submodules are given in the following subsections.
5.1. Vessel masking in the vicinity of OD
Vessels around OD are more important for identification purposes because their distribution pattern around OD has less randomness within a subject. In other words, as the vessels are farther from OD, they become thinner and their distribution is more random such that it has less discriminative property. Hence, OD location can be used as a reference point for positioning the human eye with respect to the scanner system. This means that OD should be placed at the central region of the scanned image in order to allow the system to perform the identification. After extracting the vessels and localizing OD by vessel segmentation algorithm, we focus on vessels in the vicinity of OD. A ring mask centered at OD location, with radiir1 andr2 (r1 < r2), is used to select a ROI in the vessel-segmented binary image (Figure 9(b)). This binary ROI is used for feature generation in the next stages.
5.2. Polar transformation and rotation invariancy
Eye and head movements in front of the scanner may result in some degrees of rotation in retinal images acquired from the same subject. Therefore, rotation invariant features are essential for preventing identification errors caused by image rotation. This is the reason why we use polar transformation to obtain a rotation invariant binary image containing retinal vessels in the vicinity of OD. Polar image can be constructed by the following transformations from Cartesian coordinates. The point (x,y) in Cartesian coordinates is transformed to the pointρ=(x2+y2),θ =arctg(y/x) in the polar coordinates. A polar image created from ROI image is shown inFigure 10. The polar image size is 30×360 in which the second dimension refers to view angle of ROI.
5.3. Multiscale analysis of the polar image
Vessels in the vicinity of OD have different ranges of diameter size. This property may be used as the first feature in the feature generation module. In this way, one can emulate a human observer mental activity in multiscale analysis of the polar image. In other words, a human observer classifies vessels in the vicinity of OD into large, medium, and small sizes, and uses their relative positions for identification of each individual. For this purpose, we analyze the polar image in three scales by means of discrete stationary biorthogonal wavelet transform. Obviously, alternative methods such as using image processing for determining vessels diameters can be used. However, the diameter nonuniformity of each vessel in the polar image may complicate this kind of approaches (see Figure 11(b)). Figure 11(a)shows residual coefficients resulted from applying wavelet transform to the polar image inFigure 10(b)in the first three scales. To extract large vessels from polar image, we threshold residual coefficients in the third scale of the wavelet transform. For extracting medium-size vessels, we remove large vessels from the polar image and repeat the same procedure on residual coefficients of the wavelet transform in the second scale. Finally, we remove large- and medium-size vessels from the polar image in order to obtain small vessels. The result of vessel separation procedure is illustrated inFigure 11(b).
5.4. Feature vector construction
(a) (b)
Figure10: Polar transformation: (a) ROI in Cartesian coordinates, (b) polar image.
(a) (b)
Figure11: (a) Multiscale analysis of polar image: wavelet approximation coefficients in scale 3 (up), 2 (middle), and 1 (bottom); (b) vessel separation result: large (up), medium (middle), and small (bottom) vessels.
vectors from 3×360 bytes to only 3×48 bytes, which is significantly smaller than 256 bytes for iris code [17].
6. FEATURE MATCHING
For feature matching, we introduce a new similarity index based on a modified correlation between the feature vectors. Modified correlation (MC) between two feature vectors for theith scale is defined as follows:
MCi(ϕ)= N
τ=1
stepθi(τ)×θ q i(τ+ϕ)
∗cosα×θi(τ)−θqi(τ+ϕ) , i=1, 2, 3,
(2)
whereθiis the feature vector corresponding to the enrolled
image, andθqi is the feature vector corresponding to the input
query image, αis a coefficient experimentally set to 1.7, τ represents the circular translation value, andN =360 is the length of the feature vector in each scale. step (·) is the step function defined as follows:
step (x)=
1, x >0,
0, x≤0. (3)
The role of step (·) in (2) is to normalize the product of pulse amplitudes in the feature vectors, because the amplitude of each pulse specifies the orientation of the corresponding
vessel and is used only for determining the argument of cos (·) in (2). The role of cos (·) in (2) is to take into account the angle between vessels in the enrolled and query images. Since the angle between vessels rarely exceeds 90 degrees, we use a coefficientα(∼=2) in the argument of cos (·) in order to reduce the modified correlation value when the vessels are not oriented in the same direction. If the two vessels have the same orientation, the angle between them will approach to zero and cos (·) will take a value close to 1. In contrary, if they are oriented differently (e.g., about 90 degrees), the angle between them will be different from zero and cos (·) will approach to−1. The similarity index between the enrolled and the query image corresponding to theith scale is defined as the maximum value of the modified correlation function:
SIi= Max ϕ=1,...,360
MCi(ϕ)
, i=1, 2, 3. (4)
Finally, a scale-weighted summation of SIs is computed to obtain a total SI for the enrolled and query images. In general, larger vessels are more effective than smaller ones for identification. Therefore, we used three different weights
(w1 > w2 > w3) to obtain the weighted sum of similarity
indices as follows:
SI=w1×SI1+w2×SI2+w3×SI3, (5)
1 119120121 257258259 339340341 360
θ(120) θ(120)
θ(340) θ(340)
ϕ θ
Figure12: Construction of feature vector in the second scale (medium-size vessels), the horizontal axis, shows the position of vessels (in degrees) in polar coordinates and the vertical axis and shows the angle (in degrees) between corresponding vessel orientation and the horizontal axis in the polar image.
Table1: Experimental results.
Experiment Experiment A Experiment B Experiment C Experiment D Mean Variance
Accuracy 99.4% 97.9% 98.9% 99.6% 99.0% 0.58
7. EXPERIMENTAL RESULTS
We applied the algorithm on a database including 60 subjects, 40 images from DRIVE [19], and 20 images from STARE [20] database. We rotated randomly each image 5 times to obtain 300 images. We evaluated the performance of our identification system in four different experiments as follows.
Experiment A
The first 30 images of DRIVE database were enrolled, and 60 images of DRIVE and STARE databases with 5 images per subject were entered to the system as queries.
Experiment B
The last 30 images of DRIVE database were enrolled, and 60 images of DRIVE and STARE databases with 5 images per subject were entered to the system as queries.
Experiment C
The first 10 images of DRIVE database and the first 10 images of STARE database were enrolled, and 60 images from DRIVE and STARE databases with 5 images per subject were entered to the system as queries.
Experiment D
The first 15 images of DRIVE database and the last 15 images of STARE database were enrolled, and 60 images of DRIVE and STARE databases with 5 images per subject were entered to the system as queries.
These experiments demonstrated that our system has an average accuracy equal to 99.0 percent. Table 1 shows the results of each experiment.Figure 13shows the variation of FRR and FAR according to the distribution of nonmatching distance by selecting a proper distance threshold. Also, in
0 2 4 6 8 10 12 14 16
Threshold 0
0.01 0.02 0.03 0.04 0.05 0.06 0.07 0.08 0.09 0.1
Er
ro
r
rat
e
EER: (0.006, 7.83)
FAR FRR
Figure13: Intersection of FRR and FAR diagram shows EER for Experiment A withα=1.7.
0 20 40 60 80 100
False acceptance rate (%) 90
91 92 93 94 95 96 97 98 99 100
G
en
u
in
e
acce
p
ta
n
ce
ra
te
(%
)
Figure 14, the ROC curve shows that in a very small false acceptance rate we have large values of genuine acceptance rate for identification.
8. CONCLUSIONS AND PERSPECTIVES
In this paper, a novel biometric system was introduced using unique features from retinal images. Advantages of this system can be summarized as follows.
(i) It needs small memory size, since feature vectors are fairly compact.
(ii) In the proposed system, the identification result is not influenced by gaze angle, since the OD location is used as a reference point for feature extraction, and only blood vessels pattern around OD are detected and used for feature generation. Therefore, if OD is not located in an authorized position around image center, it can be detected and alarmed to the subject for a new scan with correct gaze angle.
(iii) Since the vessels pattern only in the vicinity of OD is used for feature generation, the vessel segmentation may be performed only in the vicinity of OD which reduces drastically the computational cost of the algorithm.
(iv) Our feature generation algorithm uses multiscale analysis of the polar image which in contrary to other image processing techniques is less sensitive to small variations of the vessels diameters and extracts a considerable amount of information.
The primary results obtained by our retinal recognition system demonstrate its potential for being used as a reliable biometric system. Further enhancements to our retinal recognition system can be provided by the following:
(i) most of the parameters used in the algorithm have been selected experimentally in order to obtain good results. These parameters such as the weights used in matching process can be optimized for providing a higher average accuracy;
(ii) the effect of the optical disk position within the retinal image can be reduced by performing a normalizing transformation which brings OD to the center of the retinal image. In this way, the resulted retina codes will be less sensitive to the OD position within the retinal image.
ACKNOWLEDGMENT
This work was partially supported by Iran Telecommunica-tion Research Center under Grant no. T-500-7100.
REFERENCES
[1] A. Jain, R. Bolle, and S. Pankanti,Biometrics: Personal Identi-fication in a Networked Society, Kluwer Academic Publishers, Dordrecht, The Netherlands, 1999.
[2] D. Zhang,Automated Biometrics: Technologies and Systems, Kluwer Academic Publishers, Dordrecht, The Netherlands, 2000.
[3] R. B. Hill, “Rotating beam ocular identification apparatus and method,” 1983, US patent no. 4393366.
[4] R. B. Hill, “Fovea-centered eye fundus scanner,” 1986, US patent no. 4620318.
[5] J. C. Johnson and R. B. Hill, “Eye fundus optical scanner system and method,” 1990, US patent no. 5532771.
[6] R. B. Hill, “Retinal identification,” in Biometrics: Personal Identification in Networked Society, A. Jain, R. Bolle, and S. Pankati, Eds., p. 126, Springer, Berlin, Germany, 1999. [7] C. Simon and I. Goldstein, “A new scientific method of
identification,”New York State Journal of Medicine, vol. 35, no. 18, pp. 901–906, 1935.
[8] H. Tabatabaee, A. Milani Fard, and H. Jafariani, “A novel human identifier system using retina image and fuzzy clus-tering approach,” inProceedings of the 2nd IEEE International Conference on Information and Communication Technologies (ICTTA ’06), pp. 1031–1036, Damascus, Syria, April 2006. [9] Z.-W. Xu, X.-X. Guo, X.-Y. Hu, and X. Cheng, “The blood
vessel recognition of ocular fundus,” inProceedings of the 4th International Conference on Machine Learning and Cybernetics (ICMLC ’05), pp. 4493–4498, Guangzhou, China, August 2005.
[10] M. Ortega, C. Marino, M. G. Penedo, M. Blanco, and F. Gonzalez, “Biometric authentication using digital retinal images,” inProceedings of the 5th WSEAS International Con-ference on Applied Computer Science (ACOS ’06), pp. 422–427, Hangzhou, China, April 2006.
[11] http://www.retica.com/index.html.
[12] P. Tower, “The fundus oculi in monozygotic twins: report of six pairs of identical twins,”Archives of Ophthalmology, vol. 54, no. 2, pp. 225–239, 1955.
[13] H. Farzin, H. Abrisham Moghaddam, and M. Sh. Moin, “A new method for blood vessels segmentation in retinal images,” inProceedings of the 13th Iranian Conference on Biomedical Engineering (ICBME ’07), Tehran, Iran, February 2007. [14] K. G. Goh, W. Hsu, and M. L. Lee, “An automatic diabetic
retinal image screening system,” inMedical Data Mining and Knowledge Discovery, pp. 181–210, Springer, Berlin, Germany, 2000.
[15] S. Chaudhuri, S. Chatterjee, N. Katz, M. Nelson, and M. Goldbaum, “Detection of blood vessels in retinal images using two-dimensional matched filters,”IEEE Transactions on Medical Imaging, vol. 8, no. 3, pp. 263–269, 1989.
[16] http://www.raycosecurity.com/biometrics/EyeDentify.html. [17] W.-S. Chen, K.-H. Chih, S.-W. Shih, and C.-M. Hsieh,
“Personal identification technique based on human Iris recog-nition with wavelet transform,” inProceedings of IEEE Inter-national Conference on Acoustics, Speech and Signal Processing (ICASSP ’05), vol. 2, pp. 949–952, Philadelphia, Pa, USA, March 2005.
[18] N. Otsu, “A threshold selection method from gray-level his-tograms,”IEEE Transactions on Systems, Man and Cybernetics, vol. 9, no. 1, pp. 62–66, 1979.
[19] J. Staal, M. D. Abr`amoff, M. Niemeijer, M. A. Viergever, and B. van Ginneken, “Ridge-based vessel segmentation in color images of the retina,”IEEE Transactions on Medical Imaging, vol. 23, no. 4, pp. 501–509, 2004.
[21] D. Wu, M. Zhang, J.-C. Liu, and W. Bauman, “On the adaptive detection of blood vessels in retinal images,”IEEE Transactions on Biomedical Engineering, vol. 53, no. 2, pp. 341–343, 2006. [22] M. Niemeijer, J. J. Staal, B. van Ginneken, M. Loog, and M. D.
Abr`amoff, “Comparative study of retinal vessel segmentation methods on a new publicly available database,” in Medical Imaging 2004: Image Processing, J. M. Fitzpatrick and M. Sonka, Eds., vol. 5370 ofProceedings of SPIE, pp. 648–656, San Diego, Calif, USA, February 2004.
[23] F. Zana and J.-C. Klein, “Segmentation of vessel-like patterns using mathematical morphology and curvature evaluation,” IEEE Transactions on Image Processing, vol. 10, no. 7, pp. 1010– 1019, 2001.
[24] X. Jiang and D. Mojon, “Adaptive local thresholding by verification-based multithreshold probing with application to vessel detection in retinal images,” IEEE Transactions on Pattern Analysis and Machine Intelligence, vol. 25, no. 1, pp. 131–137, 2003.
![Figure 1: Eye anatomy [15].](https://thumb-us.123doks.com/thumbv2/123dok_us/1160944.1146091/2.600.317.545.72.317/figure-eye-anatomy.webp)