Volume 2010, Article ID 212517,14pages doi:10.1155/2010/212517
Research Article
Progressive Exponential Clustering-Based Steganography
Chang-Tsun Li
1and Yue Li
21Department of Computer Science, University of Warwick, Coventry CV4 7AL, UK 2College of Software, Nankai University, Tianjin 300071, China
Correspondence should be addressed to Chang-Tsun Li,[email protected]
Received 26 April 2010; Revised 15 August 2010; Accepted 5 October 2010
Academic Editor: C. C. Jay Kuo
Copyright © 2010 C.-T. Li and Y. Li. This is an open access article distributed under the Creative Commons Attribution License, which permits unrestricted use, distribution, and reproduction in any medium, provided the original work is properly cited.
Cluster indexing-based steganography is an important branch of data-hiding techniques. Such schemes normally achieve good balance between high embedding capacity and low embedding distortion. However, most cluster indexing-based steganographic schemes utilise less efficient clustering algorithms for embedding data, which causes redundancy and leaves room for increasing the embedding capacity further. In this paper, a new clustering algorithm, calledprogressive exponential clustering(PEC), is applied to increase the embedding capacity by avoiding redundancy. Meanwhile, a cluster expansion algorithm is also developed in order to further increase the capacity without sacrificing imperceptibility.
1. Introduction
Many steganographic schemes have been developed for hiding data in vector-quantisation (VQ) compressed colour images (also called palette images) [1–14]. Although there are variations among them, a common feature of these methods is that they partition the codebook into a number of groups or clusters and then embed the secret message by replacing the codeword indices of the compressed image with those of the same group/cluster selected according to the corresponding secret data bits. For example with a cluster of 8 (= 23) codewords, each codeword can embed 3 bits of the secret message. If the binary secret data bits is 0102, (or 1102), the second (or sixth) codeword is used to replace the original codeword. The receiving end of the stego-image needs to have the same clustering of the same codebook. The secret message is extracted by concatenating the position/index (in binary form) of the received code-words in their groups/clusters. Therefore, we can see that the greater the cluster, the greater the embedding capacity of each codeword of the cluster [1,4,12]. The size of a cluster is determined by the distance between each codeword and the cluster’s centroid. The greater the distance is allowed, the larger the cluster is. However, the greater a cluster is, the greater the variance among the codewords in the cluster becomes, meaning the average embedding distortion is greater because the possibility that a codeword gets replaced
with a more distant codeword is higher [4,12]. So striking a good balance between embedding capacity and embedding distortion is important, but unfortunately not trivial. The feasibility resides in the optimality of the codebook clustering algorithm [4,12]. Because of the indexing characteristic of this type of schemes, we describe them ascluster indexing-based steganography in this paper. In Du and Hsu’s work [2], the clustering algorithm treats the secret message as a clustering parameter. The value of the secret message and the size of groups from each clustering step are combined as the threshold of the clustering algorithm. As a result, when embedding different secret messages, the codebook must be reclustered. Furthermore, the performance of the method is dependent on the secret message, making the performance evaluation of the algorithm difficult. Another drawback of some schemes of this category (e.g., [1]) is that the size of each cluster is not a power of 2, making some colours in the same cluster redundant, thus reducing overall embedding capacity. For example, if the sizeCof a clusterCis not a power of 2, thenC −2log2Ccolours are redundant and
colour space with 224 colours as the codebook, a colour table containing only the colours present in the original image is first created. A k-means clustering algorithm is then applied to cluster the colours in the colour table into
N clusters/groups. Thirdly, the entire colour space with 224 colours is partitioned intoNcubes, with each cube centred at one centroid of the N clusters formed in the first step. Subsequently, each cube is reduced to a 3-dimensional sphere containing 2h colours, where his a prespecified parameter
which determines the capacity and distortion of the scheme. Finally, to embed data bits with a value equal to d into a pixel, the algorithm identifies the cluster which contains the colour of the pixel and then replaces the colour with thedth colour in the sphere centred at the centroid of the identified clusters. To extract the secret data from the received image, anN-element colour palette (i.e., the centroids of the same
N colour clusters) has to be transmitted to the recipient so that the same colour clusters can be reestablished. From each pixel, the index of the pixel’s colour in its cluster is taken as the secret data bits carried by the pixel. By concatenating those colour indices, the complete secret message can be formed if the stego-image is not manipulated. Although high embedding capacity of this scheme has been reported, high distortion due to the low density of the colour clusters makes this scheme unacceptable. Based on [16], Brisbane et al. proposed another scheme [15], aiming at trading embedding capacity for embedding distortion. Although the objective of reducing embedding distortion is achieved, the same requirement of communicating the extrapalette to the receiving side stands as the main limitation on the feasibility of the scheme. For example, if N = 1000, then approximately 3,000 bytes of data have to be transmitted to the recipient. This extracommunication not only requires extraresource, but more seriously, presents a security gap for potential attack. Moreover, a common limitation of the aforementioned methods is that they are not immune to histogram analysisas we will discuss in Section4.1.
In this work, we propose a Progressive Exponential Clustering-(PEC-) based steganographic scheme, aiming at striking a good balance between high embedding capacity and low embedding distortion. Meanwhile, the proposed scheme does not have to transmit the palette from the embedding side to the recipient, hence strengthening secu-rity. Moreover, the proposed scheme is immune to histogram analysis [1,15,16].
2. Progressive Exponential Clustering- (PEC-)
Based Steganography
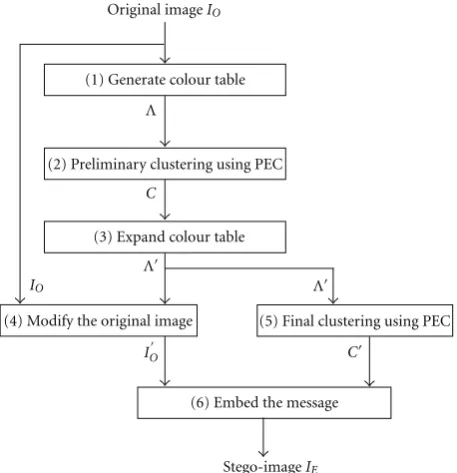
In this section, we propose a Progressive Exponential Clustering-(PEC-) based steganographic scheme for hiding secret data in true colour images. Figure 1 illustrates the main idea of the proposed scheme. The first step of this scheme is to create a colour tableΛ, which covers all colours present in the original image IO. In the second step, the
colour table is partitioned into a number of groups using the Progressive Exponential Clustering (PEC) algorithm (to be described in Section2.2). The result of this grouping is a
set of clustersCof various sizes, each containing 2hcolours,
wherehis a positive integer variable depending on the size of the cluster. In Step 3, each cluster is expanded by adding a number of virtual colours, which are not present in the original image and near the centroid of the cluster, in order to form an expanded cluster with 2h
colour (h > h). The cluster expansion operation results in an expanded colour tableΛ. Throughout the rest of the paper, we will use the termsphysicalcolours to represent the colours present in the original imageIO andvirtualcolours to represent the added
colours that are absent in the original image. The purpose of expanding the clusters is to increase the embedding capacity, and the reason of selecting the virtual colours near the centroids is to minimise the embedding distortion. Step 4 modifies the original image slightly by assigning each virtual colour toonly onepixel whose physical colour is present in the same cluster as the virtual colour. The result of Step 4 is a modified image IO containing all of the physical and
virtual colours. The reason of doing so is to ensure that after hiding the secret data, all the physical and virtual colours will be present in the stego-image such that the recipient of the stego-image can re-establish the same colour table and cluster configuration in the data extraction process. Step 5 partitionsΛusing the same PEC algorithm to create a new cluster configurationC. Because the colour table is modified by inserting virtual colours, the reclustering is necessary to ensure that the same cluster configurations are used in the embedding and extraction phase. The final step (Step 6) is to hide the secret data stream into the modified imageIO based
on the final clustering configurationC. To embed secret data bits with a value equal todinto a pixel based on the final clustering, the cluster which contains the colour of the pixel is identified, and the colour of that pixel is replaced with the
dth colour of the identified cluster. The secret data hiding process is repeated on the ensuing pixels until the entire secret data stream is embedded. The details of each main step are presented in the following subsections.
2.1. Colour Table Generation. The colour table generation in Step 1 of Figure 1 is the operation of collecting, without repetition, all the colours present in the original image IO
in the raster scan order to create a colour tableΛ. Usually images with large homogeneous areas or low-frequency components lead to a smaller colour table than those images mainly consisting of high-frequency components.
2.2. Progressive Exponential Clustering (PEC). In the prelim-inary clustering phase (step (2) of Figure1), the colour table
Λis taken as the input to the proposed PEC algorithm, as presented in Algorithm1, and the PEC algorithm randomises the orders of the colours inΛunder the control of a secret key K and partitions Λ into a number of clusters, each with a size equal to a power (h) of 2. The main idea of this iterative PEC algorithm is that, initially, in Iteration 0, each individual colour in the colour tableΛis treated as a singleton cluster,and then a pairing operation matches each cluster to one of theclusterswithin a Euclidean distance of
Original imageIO
Stego-imageIE
IO
IO C
C
Λ Λ
Λ
(4) Modify the original image
(6) Embed the message (1) Generate colour table
(2) Preliminary clustering using PEC
(3) Expand colour table
(5) Final clustering using PEC
Figure1: The framework of the PEC-based steganographic scheme.
until no more matches can be made. The centroid/average of eachcluster pairis calculated, and then, with the leftover clusters excluded, the entire new set of the paired clusters is subjected to the same pairing operation under the constraint of the same threshold T in the next iteration. The pairing/clustering operation iterates progressively until no match is made throughout an entire iteration. The final clustering is achieved by concatenating the leftover clusters of all iterations. The reason we want the size of each cluster to be equal to a power of 2 is to eliminate redundancy so as to increase the overall embedding capacity.
The most accurate way of pairing up colours/clusters is to conduct an exhaustive search and pair up the closest ones. However, we observed that the size of the colour table of 1024 ×1024-pixel images normally varies from 100,000 to 700,000. Exhaustive search in such an enormous colour table is by no means computationally feasible. So we employ a suboptimal, yet more efficient search method, called incremental clustering based on the idea proposed by Jain et al. [17]. The idea is that patterns are sorted in a random order, each treated as singleton clusters, and then incrementally merged to form larger clusters. When growing a cluster, the algorithm searches for the first pattern or cluster outside the growing cluster, with a distance to the growing cluster’s centroid shorter than a threshold, to merge. According to [17], the time complexity of ak-means clustering algorithm isO(nlk), wherenis the number of the colours to be clustered,kis the number of the clusters in the final cluster configuration, andlis the number of iterations taken by the algorithm before convergence. In comparison, the time complexity of the incremental clustering algorithm is onlyO(nlogn).
LetΛbe the colour table,Cithe set of clusters in theith
iteration of the clustering process, Ci(x) the xth cluster in
Ci,ui(x) the centroids ofCi(x),D(ui(x),ui(y)) the Euclidean
distance between the centroids ui(x) and ui(y) of clusters Ci(x) and Ci(y),T a Euclidean distance threshold, and C
the final clustering configuration of the colour tableΛ. The proposed PEC algorithm is described in Algorithm1.
Figure 2 illustrates an example of the working of the PEC algorithm. Each circle represents a colour in the colour table Λ to be clustered. At the beginning of Iteration 0 in Figure 2(a), every individual colour is considered as a singleton cluster, and all of the circles/colours are sorted, with their indices determined by a secret key K. At the end of Iteration 0 as demonstrated in Figure2(b), each circle/colour is either paired up with another with a distance shorter than
Tto form a new cluster{C0(m),C0(n)}ofC1or left inC0. At the beginning of Iteration 1, as demonstrated in Figure2(c), the centroids (represented as dots) of the successfully paired clusters in C1 are calculated. Based on the centroids of the successfully paired groups, the clustering continues in Iteration 1 (see Figure2(d)). After Iteration 1, there is only one cluster left, which satisfies Ci ≤ 1 in step (4.4) of
Algorithm1. Therefore, the PEC algorithm stops.
In order to demonstrate the idea of the PEC algorithm in a simple manner, let us use a scalar number to represent a colour of Λ in the following example. For example, given Λ = {15, 26, 2, 11, 9, 1, 7, 4, 17, 6}, C0 = {{15},{26},{2},{11},{9},{1},{7},{4},{17},{6}} after randomisation under the control of a secret keyK, and the thresholdT=5, the clustering process is as follows.
After Iteration 0,
C0= {{26},{17}},
C1= {{15, 11},{2, 1},{9, 7},{4, 6}}.
(1)
After Iteration 1,
C0= {{26},{17}},
C1= {{9, 7},{15, 11}},
C2= {{2, 1, 4, 6}}.
(2)
Since C2 = 1, according to step (4.4) and (5) of Algorithm1, the final clustering is
C=C2∪C1∪C0={{2, 1, 4, 6},{9, 7},{15, 11},{26},{17}}. (3)
C is a clustering configuration consisting of clusters of various sizes, and the size of a cluster Ci is Ci = 2i.
Therefore, the embedding capacity for a pixel, whose colour belongs toCi, isibits. Meanwhile, every colour in clusterCi
may be used for substitution during the secret data hiding process, hence there is no redundancy in C. In addition, althoughC0contains only one colour and is not embeddable, such a cluster can be expanded to a larger cluster by the expansion algorithm as introduced in Section2.3, and thus
C0is included inC.
Input: colour tableΛ, Euclidean distanceT, secret keyK Output: cluster configurationC
PEC algorithm
(1)C0=The set of colours inΛwith their orders randomised according to secret keyK(each individual colour is seen as a cluster);
(2)i=0;
(3)clustering completed:=FALSE; (4) Whileclustering completed:=FALSE;
(4.1) Calculate the centroidμi(x) of each clusterCi(x) inCi;
(4.2)Ci+1=φ;
(4.3) For everyCi(m) inCi, m∈ {1, 2, 3,. . .,Ci}
(4.3.1) Forn=m+ 1 toCi
IfD(μi(m),μi(n))≤T
(4.3.1.1)Ci+1:=Ci+1∪ {Ci(m),Ci(n)};
(4.3.1.2)Ci:=Ci\ {Ci(m),Ci(n)}(Note “\” is the operation of Set Difference)
(4.3.1.3) Go to step 4.3; Else
Go to step (4.3.1)
(4.4) IfCi+1 ≤1 (At the final iteration,Ci+1is either 0 or 1 depending on Step 4.3.1)
clustering completed:=TRUE; Else
i=i+ 1;
(5) Final cluster configurationC=Ci+1∪Ci∪Ci−1∪Ci−2∪ · · · ∪C0;
Algorithm1: Progressive exponential clustering (PEC) algorithm.
C0(1)
C0(2) C0 (3)
C0(4)
C0(5) C0(5)
C0(5)
C0(5)
C0(6)
C0(7)
C0(8)
C0(9)
C0(10)
C1(1)
C1(1)
C1(2)
C1(2)
C1(2)
C1(3)
C1(3)
C1(4)
C1(4)
C1(5)
C1(5)
C0(8)
C0(8)
C0(8)
C2(1) µ1(1)
µ1(2)
µ1(3)
µ1(4)
µ1(5)
(a) Beginning of iteration 0 (b) End of iteration 0
(c) Beginning of iteration 1: centroid calculation (d) End of iteration 1
C0(11)
C0(12)
This selection policy has two advantages. Firstly, it avoids exhaustive search and greatly reduces the computation load [17]. Secondly, this selection policy increases the security of the PEC-based steganographic scheme because it is sensitive to the orders of the colours in the colour table. For example, in Iteration 0 of the above demonstration, 17 is closer to 15. However, 15 is paired up with 11 since 11 appears before 17 in the colour table, and the distance between 11 and 15 is 4 < T (= 5). By randomising the orders of the colours of the colour table in Step 1 of the PEC algorithm according to secret keyK, we can ensure the security of the proposed scheme. Without this secret key, even if a potential attacker managed to establish the same colour table, he/she is still unable to obtain the same clustering configurationC. Without the same clustering configurationC, the attacker is unable to extract the correct secret data.
2.3. Cluster Expansion. If the colour of a pixel belongs to a cluster with 2h colours, then this pixel can carry hbits of secret message. Therefore, by expanding clusters exponentially, higher embedding capacity can be achieved. For example, a cluster with 4 (22) colours has the embedding capacity of 2 bits. If 4 more different colours are inserted into this cluster, the embedding capacity of the colours in this cluster increases to 3 bits (8 = 23). However, despite the increased capacity, the cluster expansion may also lead to higher embedding distortion if not done in an adaptive manner with regard to the details of the content in the image. Therefore the following two factors need to be taken into account when expanding clusters.
(i) We observed that, for most images without larger homogeneous areas, higher embedding capacity can be achieved without incurring further distortion in terms of both human perception and PSNRs if the added virtual colours are within one standard deviation of the cluster centroid. However, if there are larger homogeneous areas in the image, although the PSNR remains near constant, visual distortion may become more noticeable when too many virtual colours are added to the homogeneous areas. There-fore, the number of the virtual colours should be restricted in the expansion process.
(ii) Another factor worth noting is that overexpansion cannot guarantee the presence of every virtual colour in the stego-image. As a result, the recipient of the stego-image cannot obtain the same colour table as used at the embedding side; consequently he/she is unable to make the correct extraction. Therefore, measures for tackling this situation are necessary.
LetCi(x) be the expanded counterpart ofCi(x), 2h the
size of Ci(x) (i.e., 2h
= Ci(x)), and p the number of
pixelswhose colours belong to clusterCi(x). One necessary
(but not sufficient) condition for all the colours in cluster
Ci(x) to appear in the stego-image isp ≥2h
. Without loss of generality, we assume that the secret data is uniformly distributed, that is, the probability of the occurrence of every 2h
-bit secret data segment in the entire secret data
stream is 1/2h
. For example, in a uniformly distributed secret data sequence, the probability of the occurrence of every 2-bit secret data segment (“00”, “01”, “11” and “10”) is 1/4. According to the data hiding algorithm (described in Section2.4), the colour, with its index equal to the secret data bits will be substituted in order to carry the secret data bits, will be substituted in order to carry the secret data bits. Therefore, the probability for one colour to be substituted is 1/2h
. Consequently, the probability of one colour not being substituted is 1−1/2h
. Performing data embedding on ppixels whose colours are in the same cluster of size 2h
, the possibilityλof one colour in this cluster not being substituted is
λ=
1− 1
2h p
. (4)
Therefore, the expansion should not result in a value of
λgreater than a given upper boundτ(i.e.,λ≤τ). That is to say that the following inequality must be satisfied:
2h< 1
1−√pτ (5)
Additionally, the radius of the expanded cluster should also be smaller than the Euclidian distance thresholdT
2h≤4
3πT
3, (6)
where the right-hand side of Inequality (6) is the volume of a 3-deminsional sphere with a radius equal to T. We also require that the size of the expanded cluster still equals a power of 2, in order to avoid redundancy. Therefore, taking the aforementioned factors into consideration, the size of the expanded cluster, 2h
, should satisfy
h=
log2min
p,
1 1−√pτ
, 4 3πT 3 , (7)
where · is the floor function. The cluster expansion algorithm is presented in Algorithm 2. After applying the cluster expansion to all clusters in the original colour table
Λ, the result is an expanded colour tableΛ.
To ensure the appearance of every virtual colour in the stego-image and subsequently allow the recipient to reconstruct the same colour table Λ, some pixels have to be chosen to have their original (physical) colours replaced with the virtual colours before data hiding takes place (step (4) of Figure1). To assign a virtual colour, we identify the first pixel in the image with a physical colour in thesame cluster as the virtual colour. Assigning each virtual colour to only one pixel keeps the distortion low. Note that this “expansion” distortion is insignificant when compared to the actual embedding distortion, as discussed in Section3and demonstrated in Table4and Figures7and8.
Input: clusterCi(x), probability upper boundτand Euclidean distance thresholdT
Output: expanded clusterCi(x)
Cluster expansion algorithm
(1) Computep(the number of pixels with their colours belonging toCi(x));
(2) Compute the centroidui(x) of clusterCi(x)
(3) Compute 1/(1−√pτ) of Inequality (5);
(4) Computehaccording to (7);
(5) LetCi(x)=Ci(x)∪ {2h
−2hvirtual colours with their distances closest toC
i(x)}. Note
that by “virtual colours” we mean the colours that are not present inCi(x) and h=log2Ci(x).
Algorithm2: Cluster expansion algorithm.
2.4. Data Hiding and Extraction. The data hiding process is straightforward and is presented in Algorithm 3. At the receiving side, the recipient has to construct the same colour tableΛaccording to the received imageIE, and then apply
the same PEC algorithm on Λ in order to obtain the same clustering configurationC. With the sameΛandC
the secret data can be extracted correctly. The extraction algorithm performs as follows. If the colour of a pixel is the only member of its clusterCi(x), then this pixel carries
no information; otherwise, the index of the colour in the cluster represents the secret data bits. After visiting all pixels, by concatenating those extracted bits, the complete secret data stream can be revealed. The data extraction algorithm is presented in Algorithm4.
3. Experimental Results
In Figures3to6, we show 4 original images and their cor-responding stego-images with different values of Euclidean distance thresholdT. In these figures, we can see that when
T ≤ 4, the distortion is imperceptible by human eyes. However, as T increases further, the distortion becomes more noticeable. The following experiments conform to this result (see Table 4). Although the greater the T is, the higher the embedding capacity becomes because there is bigger room for cluster expansion, the distortion also increases. On the other hand, the smaller T is, the lower the distortion becomes. However, the embedding capacity decreases because the room for cluster expansion becomes more limited. Therefore, in our experiments, we setT to 3 and 4. We also set the upper boundτ of Inequality (5) to 0.001.
The size of the host image is an important factor of the embedding capacity because a large image normally contains more colours than a smaller one, which results in larger clusters with higher embedding capacity. Meanwhile, since the homogeneous background areas in an image only contain a limited number of colours, images with large homogeneous areas tend to have a smaller colour table, but greater rooms for cluster expansion. We use two 1024× 1024-pixel images as examples, one with a large homogenous area (as shown in Figure7(a)), thus a smaller colour table, while the other without a homogeneous background (as shown in Figure8(a)), thus a larger colour table. Whether an image has
a large homogeneous area can be determined by the size of the colour table. A large colour table means that every colour only appears a few times, indicating that there is no large homogenous area in the image, and vice verse. Given the images of the same size, the ratio between the total number of pixel and the size of the colour table can give a good indication as to whether there are large homogeneous areas in the images or not. For example, for the “Hill” image, the ratio between the total number of pixel, and the size of the colour table is 7.1 : 1 while the ratio for “Mandrill” is 1.6 : 1. Each colour has appeared about 7 times on average in the “Hill” image, while each colour only has appeared 1.6 times on average in the “Mandrill” image. Therefore we can conclude that there are larger homogeneous areas in “Hill” than those in “Mandrill.” Table 1 lists the statistics of the cluster expansion with the distance thresholdT equal to 3 and 4. We only choose the distance threshold 3 and 4 for experiments because when the threshold is higher than 4, the distortion is too high (PSNR is lower than 35 db) and when the threshold is lower than 3, the room for expansion is too small (the threshold equal to 2 hardly allows any expansion in the cluster expansion phase). We can see that image “Hill” in Figure7(a), with a relatively larger homogeneous background than image “Mandrill” in Figure 8(a), has a more significant expansion rate. Because one virtual colour is assigned to only one pixel in the image, the distortion arising from the expansion operation is well above 60 dB (see “Distortion due to expansion” of Table1). Figures7(b)and 8(b)are the slightly modified version of Figures7(a)and8(a) with virtual colours added when distance thresholdT = 3, respectively. Table2demonstrates the changes to the size of the largest cluster of image “Hill” and “Mandrill” after cluster expansion. For image “Hill,” the size of the largest cluster doubles (from 64 up to 128) after the expansion when the threshold is either 3 or 4. So those pixels with their colour belonging to this cluster can carry 7 (27=128) bits of secret data, rather than just 6 (26 = 64) bits. Note that there are other clusters of various sizes underwent expansion. For the image of “Mandrill” with a lower expansion rate as shown in Table2, the largest cluster has not been expanded due to the constraints (mentioned in Section2.3) imposed on the expansion algorithm.
Input: modified imageIO, cluster configurationC, secret keyK, secret dataW
Output: embedded imageIE
Embedding algorithm
(1) ConvertWinto binary form;
(2) While the end of the input imageIO is not reached
If the colour of the current pixelxis the only member of its clusterCx(i.e., this pixel is non-embeddable)
(2.1) Go to Step 2; Else
(2.2) Takeh(h=log2Cx) bits fromW, denoted asWx;
(2.3) Replace the current colour with theWxth colour inCx;
Algorithm3: Data hiding algorithm.
Input: received imageIr, secret keyK, thresholdT
Output: extracted secret dataW
Extraction algorithm
(1) Create the colour tableΛbased onIr; (Note no cluster expansion is needed.)
(2) Apply the PEC algorithm onΛto get the cluster configurationCusing the same thresholdTand the shared secret keyK; (3) While the end ofIEis not reached
If the colour of the current pixelxis the only member of its clusterCx(i.e.,xis non-embeddable)
(3.1) go to step (3); Else
(3.2) Convert the indexWxof the colour inCxinto binary form;
(3.3) AppendWxto the binary stream of the secret dataWextracted so far;
Algorithm4: Data extraction algorithm.
Original image T=2 T=3 T=4
T=7 T=10 T=13 T=15
Original image T=2 T=3 T=4
T=7 T=10 T=13 T=15
Figure4: The original Mandrill image and the stego-images with different distance thresholds.
Original image T=2 T=3 T=4
T=7 T=10 T=13 T=15
Original image T=2 T=3 T=4
T=7 T=10 T=13 T=15
Figure6: The original peppers image and the stego-images with different distance thresholds.
(bpp) without inflicting distortion on the stego-images. For image “Hill,” we can see the significant capacity difference between the unexpanded and the expanded cases as shown in Table3while embedding distortion remains near constant as shown in Table 4. Note that Table 4 even shows slight reduction in distortion (i.e., the increase of PSNR from 38.22 dB to 38.82 dB) after cluster expansion on “Hill” with
T = 3. Although the general perception is that high embedding capacity is usually gained at the expenses of high distortion, such a distortion reduction is still possible due to the fact that the virtual colours are only added around the centroids of the clusters under the constraints mentioned in Section2.3. The least upper bound of embedding distortion is the mean Euclidean distance of each group (determined by the triangle inequality). Adding virtual colours around the centroid of the clusters can reduce the mean Euclidean distance of each group and therefore reduce embedding distortion. However, in Table3, in the image of “Mandrill” wherein the high-frequency signal prevails, rooms for cluster expansion are relatively limited (see Table 1, expansion rate), and performance improvement gained through cluster expansion is therefore insignificant. Figures7(c)and8(c)are the stego-images of Figures7(a)and8(a)with virtual colours added when distance thresholdT=3, respectively.
As discussed above, adding the virtual colours to expand the cluster size can boost the performance of PEC. A more critical way of demonstrating the PEC algorithm’s superiority tok-means algorithm is to perform PEC without adding virtual colours (i.e., a handicapped version of PEC). We compared the CW method reported in [1] and PEC by
applying them to Lena image of 512×512-pixels and 256 gray levels as shown in Figure9. CW is a VQ-based method; to conduct comparisons on the same basis, we generate a codebook containing 512 codewords, each represented as 4×4-pixel image block. The reader is referred to [4] for details about how the codebook is generated. Compared to the previous case with colour images as target images, the colour table is now replaced with the codebook of 512 codewords, and each image is divided into blocks of 4×4-pixels and replaced with the most similar codeword. Algorithm one is then used to cluster the codebook, but we do not apply Algorithm2to expand the clustered codebook. Algorithms2and3are applied to embedding and extracting secret data. Since the embedding capacity and embedding distortion cannot be evaluated alone without taking each other into account, a reasonable way of evaluating them would be to fix one of the two factors and see how the algorithm performs in terms of the other factor. Figures10(a) and10(b)are the results of experiments with the threshold
(a) Original image (b) Modified image with virtual colours added
(c) Stego-image
Figure7: PEC-based data hiding experiments on image “Hill.”
(a) Original image (b) Modified image with virtual colours added
(c) Stego-image
Figure8: PECPEC-based data hiding experiments on image “Mandrill.”
is reminded that the CW algorithm is greedier in merging codewords. Therefore, with the same threshold, the CW algorithm should have a higher maximal capacity. That is why the two cutoffpoints where the maximal embedding capacities are reached are different. But this does not mean that the CW algorithm has better performance in terms of embedding capacity because the performance should be measured in terms of both embedding capacity and distortion. As we will discuss below, the PEC algorithm can still reach the same embedding capacity with a higher thresholdT while keeping the embedding distortion lower than that of the CW algorithm using a lower thresholdT.
Another way to look at the performance is to compare the maximal embedding capacity across a wide range of threshold values under the constraint that the embedding distortion should not go below a specific lower bound. Figures 11(a) and 11(b) show the curves of embedding capacity under the constraints that the embedding distortion should not go below the lower bound of 35 db and 30 db, respectively. At the beginning, the PSNR is lower than the lower bound due to the low capacity and hence the curves keep rising as the threshold increases, until the peaks of the curves are reached. The capacity starts to drop after the peaks are reached because as the thresholdTincreases, the sizes of the clusters become greater. As a result, embedding the same amount of data incurs higher distortion. That means that the lower bound of distortion will be reached when less data is embedded with greater T. In Figure11(a), the maximal
Figure9: Test images “Lena.”
Table1: The number of colours within the original and expanded colour tables with different thresholdT. Note that “Distortion due to expansion” is the distortion incurred after one virtual colour is assigned to one pixel in the original image.
Image Number of coloursbefore expansion Number of colours after expansion Expansion rate Distortion due to expansion
T=3 T=4 T=3 T=4 T=3 T=4
Hill 149509 163513 163993 9.3% 9.7% 64.21 dB 66.20 dB
Mandrill 662895 663023 663023 1.9% 1.9% 62.05 dB 66.20 dB
Table2: The size of the largest clusters before and after cluster expansion.
Image The size of the largest cluster before expansion
The size of the largest cluster after expansion
The size of the largest cluster after expansion
(T=3) (T=4)
Hill 64 128 128
Mandrill 64 64 64
Table3: Embedding capacity in terms of bit per pixel (bpp) before and after clustering.
T=3 T=4
Image The capacity without expansion
The capacity with expansion
The capacity without expansion
The capacity with expansion
Hill 3.74 4.25 4.80 5.02
Mandrill 4.05 4.05 5.05 5.06
Table4: Embedding distortion in terms ofPSNR(dB) before and after clustering.
T=3 T=4
Image Embedding image using unexpanded colour table
Embedding image using expanded colour table
Embedding image using unexpanded colour table
Embedding image using expanded colour table
Hill 38.22 38.82 35.69 35.37
Mandrill 38.27 38.21 35.16 35.14
Distortion comparison (threshold=20)
Chang’s method Proposed method 38
40 42 44 46 48 50
1000 2000 3000 4000 5000 6000 7000 8000 9000 10000
Embedding
d
ist
or
tion
(dB)
Embedding capacity (bits)
(a)
Chang’s method Proposed method
Embedding
d
ist
or
tion
(dB)
Embedding capacity (bits) 26
28 30 32 34 36 38
0.2 0.4 0.6 0.8 1 1.2 1.4 1.6 2
×104 1.8 Distortion comparison (threshold=60)
(b)
×103
0 1 2 3 4 5 6 7 8
0 14 28 42 56 70 84 98 112 126 140
Chang’s method Proposed method
Capacit
y
(bits)
Threshold
Capacity comparison (PSNR=35 dB)
(a)
×103
0 2 4 6 8
0 14 28 42 56 70 84 98 112 126 140
Chang’s method Proposed method
Capacit
y
(bits)
Capacity comparison (PSNR=30 dB)
Threshold 10
12
(b)
Figure11: Embedding capacity comparison between the PEC and CW algorithm when applied to Figure9with the threshold PSNR set to (a) 35 dB and (b) 30 dB.
9.5% and 23.3%, respectively, superior to that of the CW algorithm.
4. Analyses of PEC
4.1. Histogram Analysis and ε-Secure. The histogram of an image can effectively reveal the distribution of the colours or intensities, and thus any irregular distribution caused by the steganographic method can be easily detected [18]. In [15,16], the 3-dimensional RGB colour space is separated into spheres by the k-means clustering algorithm, and colours generated around the centre of the sphere are used for substitution in order to carry secret messages while the colours outside the sphere are not used in the stego-images. Moreover, within each sphere, the colours distribute sparsely and uniformly. As a result, a large number of gaps would appear between colours with high occurrences in the histograms of the stego-images. Such a phenomenon usually do not appear in natural images, therefore its appearance would attract the steganalyst’s attention. This is why histogram and histogram characteristic functions have been extensively used in measuring the security of stegonagraphic schemes [18–20]. By analysing the histogram of the stego-image, the attacker can easily detect the spheres in the form of aggregated clusters separated by large gaps in the histogram. These gaps allow the attacker to reconstruct the sphere/cluster configuration and even infer the hidden message. Compared to [15,16], the proposed PEC algorithm does not separate the 3-deminsional RGB colour for gener-ating colours. Instead, all the physical colours are preserved while some virtual colours are added to expand the clusters in order to increase embedding capacity without inflicting high distortion. Hence, the attacker cannot detect separated clusters in the histogram.
Katzenbeisser and Petitcolas [21] propose the statistical concept of ε-secure as a more strict security requirement based on the histogram analysis.ε-secure requires that, for steganography scheme to be deemed as secure, the Kullback-Leibler divergence(DKL) between the PDF (probability distri-bution function) of the original signal and the stego-signal must be less than a given thresholdε. TheKullback-Leibler divergence(DKL) can be described as follows:
DKL= +∞
−∞Po(z) log Po(z)
Ps(z)dz, (8)
where Po(z) and Ps(z) are the PDF of the original image
and the stego-images. In the proposed PEC algorithm, the
DKLbetween the images are about 0.001 to 0.02 (except the embedding result of the Airplane image, which is a particular example that the image contains over 80% homogenous area, allowing the PEC algorithm to expand the clusters with a greater expansion rate) depending on the content of the images. Table5demonstrates the KL divergence of the images. We can see thatDKLis always lower than 0.01 when T <13.
4.2. Characteristics of the PEC. There are three main advan-tageous aspects to the idea of the proposed PEC-based steganographic scheme.
Table5: KL divergence (DKL) of the images
Threshold
Image T=3 T=7 T=13 T=15
Lena 0.0023 0.0063 0.0084 0.0115
Mandrill 7.7189e−004 0.0050 0.0068 0.0083
Airplane 0.0092 0.0450 0.0645 0.0914
Peppers 0.0011 0.0053 0.0073 0.0093
imperceptibility. At first glance, distortion should increase proportionally as the embedding capacity gets higher through the addition of the virtual colours. However the cluster expansion algorithm can actually decrease the embedding distortion in terms of PSNR by shortening the average distance between the colours and the centroid of the cluster. According to the cluster expansion algorithm, clus-ters are expanded not by extending their boundaries outwards, but by increasing the population density around the centroids while leaving the boundary intact, thus reducing colour variation of each cluster.
(iii) The PEC-based steganography strengthens security. Ensuring the presences of all physical and virtual colours in the stego-image, the recipient can re-establish the same cluster configuration using the shared secret key K and distance threshold T. Sharing the large colour palette and the centroids of the clusters (as required in [15,16]) is no longer necessary. The reason the security of the PEC-based steganographic scheme is strengthened is twofold.
(a) Because there is no need to transmit extrain-formation, the chance of compromising the security of the scheme is reduced.
(b) Because of the fragility of the PEC-based steganographic scheme, modifications on the stego-image will inevitably change the colours of the pixels and thus lead to a different colour table. It is noted that the PEC algorithm is very sensitive to the initial colour table. With a different colour table, the PEC algorithm will produce a greatly different clustering configura-tion and wrong ordering of the colours within each cluster, which will prevent the hidden data being extracted by the attacker.
5. Conclusions
After studying some clustering-based steganographic schemes for colour images, we observed that the perform-ance of a scheme depends on the efficiency of the clustering algorithm. An efficient clustering algorithm should take the two conflicting factors of high embedding capacity and low embedding distortion into account simultaneously. In this paper, we have proposed a novel steganographic scheme using the Progressive Exponential Clustering (PEC) algorithm. This algorithm overcomes the limitation of the
traditional clustering-based steganographic schemes by seeking a balance between high embedding capacity and low embedding distortion. Meanwhile, this steganographic scheme employs a cluster expansion method, which further increases the capacity without sacrificing imperceptibility. Our experiments have proved that adding virtual colours in an adaptive manner to the colour table of images with significant low-frequency components can significantly increase the embedding capacity without inflicting distortion on the stego-images.
References
[1] C.-C. Chang and W.-C. Wu, “Hiding secret data adaptively in vector quantisation index tables,”IEE Proceedings: Vision, Image and Signal Processing, vol. 153, no. 5, pp. 589–597, 2006. [2] W.-C. Du and W.-J. Hsu, “Adaptive data hiding based on VQ compressed images,”IEE Proceedings: Vision, Image and Signal Processing, vol. 150, no. 4, pp. 233–238, 2003.
[3] J. Fridrich and R. Du, “Secure steganographic methods for palette images,” inProceedings of the 3rd Information Hiding Workshop, vol. 1768 ofLecture Notes in Computer Science, pp. 47–60, 2000.
[4] Y. Li and C.-T. Li, “Steganographic scheme for VQ compressed images using progressive exponential clustering,” in Proceed-ings of the IEEE International Conference on Video and Signal Based Surveillance (AVSS ’06), Sydney, Australia, 2006. [5] C.-C. Lin, S.-C. Chen, and N.-L. Hsueh, “Adaptive embedding
techniques for VQ-compressed images,”Information Sciences, vol. 179, no. 1-2, pp. 140–149, 2009.
[6] M. Niimi, H. Noda, E. Kawaguchi, and R. O. Eason, “High capacity and secure digital steganography to palette-based images,” in Proceedings of the International Conference on Image Processing (ICIP ’02), pp. 917–920, Rochester, NY, USA, September 2002.
[7] M. Niimi, H. Noda, E. Kawaguchi, and R. O. Eason, “Luminance quasi-preserving color quantization for digital steganography to palette-based images,” inProceedings of the International Conference on Pattern Recognition, pp. 251–254, August 2002.
[8] K. B. Raja, S. Siddaraju, K. R. Venugopal, and L. M. Patnaik, “Secure steganography using colour palette decomposition,” inProceedings of the International Conference on Signal Process-ing, Communications and Networking (ICSCN ’07), pp. 74–80, February 2007.
[9] W.-L. Tai and C.-C. Chang, “Data hiding based on VQ compressed images using hamming codes and declustering,”
International Journal of Innovative Computing, Information and Control, vol. 5, no. 7, pp. 2043–2052, 2009.
the International Conference on Image Processing (ICIP ’05), vol. 2, pp. 1090–1093, Genova, Italy, September 2005. [11] M.-Y. Wu, Y.-K. Ho, and J.-H. Lee, “An iterative method
of palette-based image steganography,” Pattern Recognition Letters, vol. 25, no. 3, pp. 301–309, 2004.
[12] M.-N. Wu, P.-A. Juang, and Y.-C. Li, “An efficient VQ-based data hiding scheme using voronoi clustering,” inProceedings of the 9th International Conference on Hybrid Intelligent Systems (HIS ’09), pp. 73–77, Shenyang, China, August 2009. [13] X. Zhang and S. Wang, “Analysis of parity assignment
steganography in palette images,” in Proceedings of the Knowledge-Based Intelligent Information and Engineering Sys-tems, vol. 3683 ofLecture Notes in Computer Science, pp. 1025– 1031, 2005.
[14] X. Zhang, S. Wang, and Z. Zhou, “Multibit assignment steganography in palette images,” IEEE Signal Processing Letters, vol. 15, pp. 553–556, 2008.
[15] G. Brisbane, R. Safavi-Naini, and P. Ogunbona, “High-capacity steganography using a shared colour palette,” IEE Proceedings: Vision, Image, and Signal Processing, vol. 152, no. 6, pp. 787–792, 2005.
[16] T. Seppannen, K. Makela, and A. Keskinarkaus, “Hiding information in color images using small color palettes,” in
Proceedings of the 3rd International Workshop on Information Security, pp. 69–81, Wollongong, Australia, 2000.
[17] A. K. Jain, M. N. Murty, and P. J. Flynn, “Data clustering: a review,”ACM Computing Surveys, vol. 31, no. 3, pp. 316–323, 1999.
[18] J. Fredrich and M. Goljan, “Practical steganalysis of digital images: state of the art,” in Security and Watermarking of Multimedia Contents IV, vol. 4675 ofProceedings of SPIE, pp. 1–13, San Jose, Calif, USA, January 2002.
[19] T. Pevn´y and J. Fridrich, “Multiclass detector of current steganographic methods for JPEG format,”IEEE Transactions on Information Forensics and Security, vol. 3, no. 4, pp. 635– 650, 2008.
[20] G. Xuan, Y. Q. Shi, J. Gao et al., “Steganalysis based on multiple features formed by statistical moments of wavelet characteristic functions,” inProceedings of the 7th Information Hiding Workshop, vol. 3727 of Lecture Notes in Computer Science, pp. 262–277, Springer, Barcelona, Spain, June 2005. [21] S. Katzenbeisser and F. A. P. Petitcolas, Eds.,Information