How polymers shape the
physicochemical
environment of the gut
Thesis by
Asher Preska Steinberg
In Partial Fulfillment of the Requirements for the degree of
Doctor of Philosophy
CALIFORNIA INSTITUTE OF TECHNOLOGY Pasadena, California
2019
ã 2019
ACKNOWLEDGEMENTS
There are so many people I have to thank for shaping me into the scientist and person I am today. First and foremost, I would like to thank my adviser, Rustem Ismagilov. Thank you for taking me into your lab and showing me the power of the scientific method. When I reflect on my experiences, Brandeis (my undergraduate institution) was the place where I discovered the joy of curiosity-driven science. Yet, I really had no clue how to answer the questions I asked. Here, in your lab at Caltech, I learned how to answer these questions using the scientific method. This is not to say that we are not curiosity-driven in the Ismagilov lab (because we certainly are), it is simply to say that you have stretched me beyond this; I am now not only curious but also crave meaningful questions. To that end, I would like to thank you for reminding me to be curious when I struggled and had lost my way.
I would like to thank my wonderful thesis committee (Zhen-Gang Wang, David Tirrell, Julie Kornfield) as a whole for pushing me to seek clean and unambiguous answers in the inherently messy problems I chose to take on during my PhD. My brother once told me that the first time he put on glasses the world was crisp, warm, and vibrant with color. This, for me, serves as a metaphorical description of a meeting with Zhen-Gang (my thesis chair) to discuss polymer physics. Zhen-Gang, thank you for showing me the wonders of polymer physics, for always having your door open to me, and for your warm words of wisdom. Dave, thank you for not only deeply probing the science that I conduct, but also asking if I am asking the right question. You are able to do this with a level of grace and precision I can only hope to one day emulate. Julie, thank you for always pushing me to think more deeply about my polymers. Your unabashed curiosity is contagious, and thank you for sharing some of that with me.
in our future adventures together. To Tasha Shelby, thank you for your curiosity, your wonderful writing, and your friendship. I would also like to thank all of my wonderful labmates; each and every one of you has given me scientific and/or emotional support as well as friendship over the years.
I have been lucky to have benefited from many wonderful support systems at Caltech. Thank you to both the Health Center and Counseling Center for keeping me healthy throughout my journey here. Thank you to Barb Catlin and the Caltech Jazz Band for everything! You have provided me with a “home away from home” here at Caltech. Thank you to Lee Coleman and the Caltech Meditation Mob for keeping me balanced every Tuesday. Of course, my life would have been a mess if there were not so many wonderful administrators at Caltech. Special thanks to Sohee Lee, Irina Meininger, Abigail McCann; without the three of you, I may have never been able to convene a committee meeting. Also, thanks to the wonderful staff of the animal facility and the present and past chemistry grad program administrators — Alison Ross and Agnes Tong.
A poet, I believe, once said, “The whole universe is in a glass of wine.” We shall never know in what sense he meant it for poets do not write to be understood, but it is true that if you look at a glass of wine closely enough you will see the entire universe … And if our small minds for some convenience divide this glass of wine, this universe, into parts – to physics, biology, geology, astronomy, psychology – remember Nature doesn’t know it, so we should put it back together and not forget, at last, what it is for. Let it give one final pleasure more; drink it up and forget about it all.
ABSTRACT
PUBLISHED CONTENT AND CONTRIBUTIONS
1. A. Preska Steinberg, S. S. Datta, T. Naragon, J. C. Rolando, S. R. Bogatyrev, R. F. Ismagilov. 2018. "High-molecular-weight polymers from dietary fiber drive aggregation of particulates in the murine small intestine." eLife. 8:e40387. DOI: 10.7554/eLife.40387
This article investigates the interactions between polymers and particulates in the murine small intestine. My role was as follows (text reproduced from page 85 of this thesis):
Co-designed all experiments and co-analyzed all experimental results; developed theoretical tools and performed all calculations; co-developed imaging analysis pipeline in ImageJ; developed computational tools for bootstrapping procedure; co-developed microscopy assay for examining luminal contents from mice gavaged particles used in Figure 2.1C and 1D; Co-performed, designed, and analyzed data from experiments involving oral administration of particles in Figure 2.1; performed, designed, and analyzed data from all ex vivo aggregation experiments in SI fluid in Figures 2.2, 2.3, 2.5-7, 2.S2, and 2.S5; performed, designed, and analyzed data from all GPC measurements in Figures 2.3, 2.5-7, and Tables 2.S1-7; performed, designed, and analyzed data from all in vitro aggregation experiments with PEG solutions in Figure 2.4D, Figure 2.4 – figure supplements 1-2, and with dietary fiber in Figure 2.7A; developed a computational approach for theoretical calculations in 2.4H and 2.4I and performed all calculations; performed, designed, and analyzed data from Western blots in Figures 2.5E, 2.6E, 2.S3, and 2.S4; helped supervise animal husbandry of MUC2KO colony; performed animal husbandry for WT mice on autoclaved diets in Figure 2.6 and 2.S5; performed animal husbandry for mice on pectin and Fibersol-2 diets in Figure 2.7; performed, designed, and analyzed all zeta potential measurements in Table 2.S8; performed pH measurements on luminal fluid in Figure 2.S2; co-interpreted results; co-wrote the paper.
2. S. S. Datta, A. Preska Steinberg, and R. F. Ismagilov. 2016 "Polymers in the gut compress the colonic mucus hydrogel." PNAS 113(26):7041-7046. doi:
10.1073/pnas.1602789113
This article investigates the interactions between polymers and the colonic mucus hydrogel. We find that polymers compress the colonic mucus hydrogel. My role was as follows (text reproduced from page 128 of this thesis):
and 3.S1; performed some of the ex vivo experiments and analyzed some of the results in Figures 3.2–4 and 3.S3–S7; codeveloped the theoretical model; cooptimized and coperformed calculations for the theoretical model and coanalyzed results in Figure 3.3; performed a sensitivity analysis for the theoretical model shown in Figure 3.S9; performed dynamic light scattering measurements of polymers and probes; designed and performed GPC measurements in Figure 3.S10; cowrote the paper.
3. A. Preska Steinberg, Z.-G. Wang, R. F. Ismagilov. 2019 “Food polyelectrolytes compress the colonic mucus hydrogel by a Donnan Mechanism”. Submitted.
This article investigates the interactions between charged polymers (polyelectrolytes) and the colonic mucus hydrogel. My role was as follows:
TABLE OF CONTENTS
Acknowledgements………...iii
Abstract ………vi
Published Content and Contributions………...vii
Table of Contents………. ix
List of Illustrations and/or Tables………x
Chapter I: Introduction ...1
The physiochemical environment of the gut ...1
Using polymer physics to understand gut physiology ...4
Thesis outline ...5
References ...7
Chapter II: High-molecular-weight polymers from dietary fiber drive aggregation of particulares in the murine small intestine ...11
Abstract ...11
Introduction ...11
Results ...12
Discussion ...40
Materials and Methods ...42
References ...59
Supplementary Information ...72
Chapter III: Polymers in the gut compress the colonic mucus hydrogel ...87
Abstract ...87
Significance Statement ...88
Introduction ...88
Results ...89
Discussion ...101
Materials and Methods ...102
References ...105
Supporting Information ...116
Chapter IV: Food polyelectrolytes compress the colonic mucus hydrogel by a Donnan mechanism ...140
Abstract ...140
Introduction ...141
Materials and Methods ...142
Results and Discussion ...145
Conclusions ...158
References ...161
LIST OF ILLUSTRATIONS AND/OR TABLES
Number Page
Figure 1.1: Schematic of “ideal” polymer chain. ...1 Figure 1.2 : Schematic of the gastrointestinal tract ...2 Figure 1.3 : Schematic of the two layer structure of colonic mucus ....3 Figure 2.1 : PEG-coated particles aggregate in the murine small intestine ...13 Figure 2.2 : PEG-coated particles aggregate in fluid from the murine small intestine ex vivo. ...16 Figure 2.3 : Gel permeation chromatography (GPC) of fluid from the small intestine and aggregation of PEG-coated particles in fractionated fluid from the SI ...19
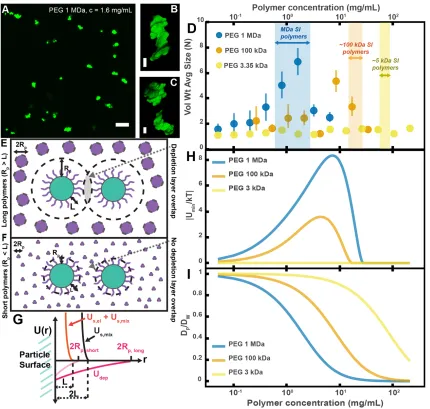
Figure 2.4 : Aggregation of PEG-coated particles in model polymer solutions show complex dependence on molecular weight (MW) and concentration of PEG ...26
Figure 2.4 – figure supplement 1 : Aggregation of PEG-coated particles in model polymer solutions with different pH ...28
Figure 2.4 – figure supplement 2 : Aggregation of PEG-coated particles in model polymer solutions from Figure 4D normalized by polymer overlap concentration ...29
Figure 2.5 : Quantification of the aggregation of particles in the small intestine in MUC2 knockout and wild-type mice ...32
Figure 2.6 : Quantification of the aggregation of particles in the small intestine of Immunoglobulin-deficient (Rag1KO) and wild-type mice ...35
Figure 2.7 : Quantification of aggregation of PEG-coated particles in the small intestine of mice fed different polymers from dietary fiber ...39
Figure 2.S1: Overview of image processing for fluorescent scanner images …….. ...72 Figure 2.S2: pH measurements of luminal fluid from different sections of the gastrointestinal tract ...73 Figure 2.S3: Ex vivo aggregation of 0.45 µm-filtered luminal from the small intestines of wild-type and MUC2 knockout mice ...74
Figure 2.S4: Western blots of 30 µm-filtered samples from the small intestine of wild-type and Rag1 knockout mice ...75
Figure 2.S5: Western blots of 30 µm-filtered samples from the small intestine of wild-type and Rag1 knockout mice ...76
Figure 2.S6: Ex vivo aggregation of 0.45 µm-filtered luminal from the small intestines of wild-type and Rag1 knockout mice ...77
Table 2.S1: Estimates of physical parameters of polymers from gel permeation chromatography of liquid fractions from the upper small intestine of MUC2 knockout and wild-type mice ...78
Table 2.S2: Estimates of physical parameters of polymers from gel permeation chromatography of liquid fractions from the lower small intestine of MUC2 knockout and wild-type mice ...79
Table 2.S3: Estimates of physical parameters of polymers from gel permeation chromatography of liquid fractions from the upper small intestine of Rag1 knockout and wild-type mice ...80
Table 2.S4: Estimates of physical parameters of polymers from gel permeation chromatography of liquid fractions from the lower small intestine of Rag1 knockout and wild-type mice ...81 Table 2.S5: Gel permeation chromatography of Fibersol-2 and pectin in phosphate-buffered saline ...81
Table 2.S7 : Estimates of physical parameters of polymers from gel permeation chromatography for liquid fractions from lower small intestine of pectin and Fibersol-2 fed mice ...83
Table 2.S8 : Zeta potential and NMR measurements of PEG-coated particles ….. ...84
Figure 3.1 : Polymers compress colonic mucus in vivo ...90 Figure 3.2 : Polymers compress colonic mucus ex vivo ...92
Figure 3.3 : Tunable compression of colonic mucus hydrogel can be qualitatively described by Flory-Huggins theory ...97
Figure 3.4 : Gut microbes can modulate mucus compression by modifying the polymeric composition of intestinal contents ...100
Figure 3.S1 : Images of murine epithelium in the xy and xz planes ………. ...129
Figure 3.S2 : False-color sideview showing WGA-stained adherent mucus hydrogel ...130
Figure 3.S3 : Co-localization of signal from microparticle probes and epithelium form different imaging modalities ...131
Figure 3.S4 : Overview of image processing of confocal sideviews ………. ...132
Figure 3.S5 : False-color sideviews of 3D stacks showing probes excluded from or penetrating the mucus hydrogel ...133
Figure 3.S6 : Sideview showing penetration of mucus hydrogel by polymers ….. ...134
Figure 3.S7 : Fluorescence profiles of test solutions deposited on mucus hydrogel, before and after washing ...135
Figure 3.S8 : Optical properties of polymer solutions do not appreciably affect z measurements ...136
Figure 3.S10 : Gel permeation chromatography of luminal contents from SPF and GF mice ...139
Figure 4.1 : Carboxymethyl cellulose compresses the colonic mucus hydrogel in vivo ...148
Figure 4.2 : Negatively charged CMC compress mucus ex vivo more than uncharged polymers ...150
Figure 4.3 : The extent of mucus compression plotted against the difference in osmotic pressure due to the added polymer ...155
Figure 4.4 : Increasing the ionic strength decreases the extent of polyelectrolyte-induced mucus compression, consistent with a Donnan mechanism ………. ...157
Figure 4.S1 : Description of image processing ...173 Figure 4.S2 : Compression with CMC is reversible ...174 Figure 4.S3 : Gel permeation chromatography measurements of charged and uncharged polymers ...175
Figure 4.S4 : Polymer contribution and ionic contribution to the osmotic pressure ...176
C h a p t e r 1
INTRODUCTION
1The physicochemical environment of the gut
Polymers are ubiquitous in nature. DNA and RNA are the polymers which encode life. These are far from the only polymers found in
organisms, as they are secreted as mucus, glycoproteins, proteoglycans, and extracellular matrices (to name a few examples). Polymers are regularly ingested by many animals for sustenance in the form of dietary fibers. In addition to the examples given above, humans also ingest polymers in the form of food additives and therapeutic polymers. Polymers are macromolecules (i.e., very large molecules). These macromolecules are chains of repeating molecular units, or monomers. Depending on the stiffness of the polymer and its interactions with the solvent, these macromolecules can take on different conformations in space, ranging from a jumble of monomers to a
random walk (depicted in Figure 1.1) to almost rod-like (1).
The motivation of this thesis is to understand how polymers in the human diet influence the physical structure of the gut through physicochemical interactions. By the “physical structure of the gut”, we mean this in the most literal sense; the physical constituents of the gut environment and their spatial distribution. This is illustrated in Figure 1.2. The physical constituents of the gut include particulates (e.g., microbes, food granules, and therapeutic
1 Sections of this chapter are adapted from a manuscript in preparation.
particles), dietary and secreted polymers (examples given in the preceding paragraph), the mucus layer, and the epithelium (2–6). By “physicochemical interactions”, we refer specifically to forces that arise and can be predicted from polymer thermodynamics. In the subsequent work, we focus on how polymers interact with two aspects of the physical structure of the gut: particulates and the colonic mucus hydrogel.
Particulates abound in the gut in the form of microbes, viruses, cell debris, particles which carry drugs, and food granules (2,4,7–9). It has been shown that the way in which these particulates are spatially structured is important to their function. In the case of therapeutic particles, it is thought that the aggregation or clumping of particles hinders their uptake at mucosal surfaces, impeding effective delivery (8,10) (see Figure 1.2 for an illustrated example of an “aggregate” of particulates). For microbes, aggregation is linked to their function in the gut. How aggregation influences microbial function appears to vary on a case by case basis. It has been shown that the aggregation of the pathogen Salmonella Typhimurium via a form of chemical agglutination promotes its clearance and protects against infection (11). Additional experimental evidence suggests that aggregation may promote clearance of other bacteria (11,12) and keeps microbes separated from the
epithelium (13). In contrast, recent experiments have suggested that in some instances bacterial aggregation can promote colonization (14). These are just a few examples which demonstrate how the spatial distribution of particulates can affect their function in the gut.
Mucus in the colon has a two-layer structure (15,16) (see Figure 1.3 for illustration). The inner layer is a polymer network (i.e., hydrogel) which is held together by chemical cross-links, physical entanglements,
and electrostatic interactions (17–19). The outer layer is a polymer solution, in which the polymers are mucins, and is where the microbiota resides (15,16). The primary mucin in both layers is MUC2, and the prevailing hypothesis in the literature is that this outer layer is formed due to proteolytic cleavages of MUC2 (15). This two layer structure is also found in germ-free mice (mice without microbes), suggesting that these proteases are endogenous (15).
Why the transition between the outer and the inner mucus layers appears to be so sharp in micrographs of colonic mucus remains unclear. Moreover, this two-layer structure is conserved across both rodents and humans (5).
The inner mucus layer in the colon (which will also be referred to in this thesis as the “colonic mucus hydrogel”) has been shown to play several key roles in shaping the gut environment. It mediates host-microbe interactions by acting as the physical barrier which separates microbes from the host (15,16). It has been demonstrated experimentally that
changes in the physical properties of this barrier, such as its mesh size and thickness, are correlated to changes in host health (20–22). Recent work has demonstrated that a thin mucus hydrogel is correlated with both microbial encroachment upon the epithelium and increased gut inflammation (22). In mouse models of colitis, the colonic mucus hydrogel has been shown to be more penetrable to bacteria, and humans with ulcerative colitis have mucus which is more penetrable to particles (20). Muc2-deficient mice, which do not secrete colonic mucus, have been shown to develop colitis and colon cancer (21,23).
Using polymer physics to understand gut physiology
one could re-write any section of this thesis in the language of either approach and should reach the same conclusions.
Continuing in the same vein, one way to contextualize this work is to think of the phenomena described in this work as forms of polymer-driven osmotic effects. In Chapter II, we find small intestinal polymers aggregate particles in a manner that is qualitatively consistent with polymer-induced depletion interactions. Polymer-induced depletion interactions arise when large polymers are excluded from the space between particles, leading to a difference in the osmotic pressure between the polymer solution and the space between particles (24–26). This acts as a driving force bringing particles together. In Chapters III and IV, we study the interactions between polymers and the colonic mucus hydrogel. One can think of the colonic mucus hydrogel as acting as a semi-permeable membrane for polymers where exclusion is on the basis of physical size, electrostatic interactions, and chemical interactions (27). This leads to an osmotic pressure difference between the polymer solution and mucus, resulting in compression. Overall, the described phenomena support the idea that polymers can influence gut physiology through simple, osmotic forces that stem from their physicochemical properties.
Thesis outline
This thesis will move longitudinally through the intestines, starting with the small intestine then moving to the large intestine.2 In all sections, we will combine in vivo and ex vivo mouse experiments with numerical calculations grounded in the statistical physics of polymers to understand the problems at hand. In Chapter II, we investigate the aggregation of particulates in the small intestine. We find that particulates aggregate spontaneously in luminal fluid from the small intestine. Our results suggest that mucins and immunoglobulins are not necessary for this aggregation to occur. Instead, we find that by feeding mice dietary fibers of different molecular weights, we can control aggregation. Our
2 The reader may notice that we are skipping over the cecum. Interestingly, the anatomy of the mouse cecum is very
References
1. Rubinstein M, Colby RH. Polymer Physics. New York: OUP Oxford; 2003.
2. Donaldson GP, Lee SM, Mazmanian SK. Gut biogeography of the bacterial microbiota. Nat Rev Microbiol [Internet]. 2015;14(1):20–32. Available from: http://www.nature.com/doifinder/10.1038/nrmicro3552
3. Hasler WL. Integrative Responses of the Gastrointestinal Tract and Liver to a Meal. In: Textbook of Gastroenterology, Fifth Edition. 2009. p. 1–14.
4. Goldberg M, Gomez-Orellana I. Challenges for the oral delivery of
macromolecules. Nat Rev Drug Discov [Internet]. 2003;2(4):289–95. Available from: http://www.nature.com/doifinder/10.1038/nrd1067
5. Johansson MEV, Sjövall H, Hansson GC. The gastrointestinal mucus system in health and disease. Nat Rev Gastroenterol Hepatol. 2013;10(6):352–61.
6. Turner JR. Intestinal mucosal barrier function in health and disease. Nat Rev Immunol [Internet]. 2009;9(11):799–809. Available from:
http://dx.doi.org/10.1038/nri2653
7. McGuckin MA, Lindén SK, Sutton P, Florin TH. Mucin dynamics and enteric pathogens. Nat Rev Microbiol [Internet]. 2011;9(4):265–78. Available from: http://dx.doi.org/10.1038/nrmicro2538
8. Maisel K, Ensign L, Reddy M, Cone R, Hanes J. Effect of surface chemistry on nanoparticle interaction with gastrointestinal mucus and distribution in the gastrointestinal tract following oral and rectal administration in the mouse. J Control Release. 2015;40(6):1301–15.
1995;49(2):98–104. Available from:
http://europepmc.org/abstract/MED/7743990
10. Maisel K, Chattopadhyay S, Moench T, Hendrix C, Cone R, Ensign LM, et al. Enema ion compositions for enhancing colorectal drug delivery. J Control Release [Internet]. 2015;209:280–7. Available from:
http://dx.doi.org/10.1016/j.jconrel.2015.04.040
11. Moor K, Diard M, Sellin ME, Felmy B, Wotzka SY, Toska A, et al. High-avidity IgA protects the intestine by enchaining growing bacteria. Nature [Internet]. 2017;544(7651):498–502. Available from:
http://www.nature.com/doifinder/10.1038/nature22058
12. Lukic J, Strahinic I, Milenkovic M, Nikolic M, Tolinacki M, Kojic M, et al.
Aggregation factor as an inhibitor of bacterial binding to gut mucosa. Microb Ecol. 2014;68(3):633–44.
13. Bergström JH, Birchenough GMH, Katona G, Schroeder BO, Schütte A, Ermund A, et al. Gram-positive bacteria are held at a distance in the colon mucus by the lectin-like protein ZG16. Proc Natl Acad Sci [Internet]. 2016;113(48):13833–8. Available from: http://www.pnas.org/lookup/doi/10.1073/pnas.1611400113
14. Donaldson GP, Ladinsky MS, Yu KB, Sanders JG, Yoo BB, Chou WC, et al. Gut microbiota utilize immunoglobulin A for mucosal colonization. Science (80- ) [Internet]. 2018;800(May):eaaq0926. Available from:
http://www.sciencemag.org/lookup/doi/10.1126/science.aaq0926
15. Johansson ME V, Phillipson M, Petersson J, Velcich A, Holm L, Hansson GC. The inner of the two Muc2 mucin-dependent mucus layers in colon is devoid of bacteria. Proc Natl Acad Sci U S A. 2008;105(39):15064–9.
organized by the MUC2 mucin, whereas the outer layer is a legislator of host-microbial interactions. Proc Natl Acad Sci U S A. 2011;108:4659–65.
17. Ambort D, Johansson ME V., Gustafsson JK, Nilsson HE, Ermund a., Johansson BR, et al. Calcium and pH-dependent packing and release of the gel-forming MUC2 mucin. Proc Natl Acad Sci. 2012;109(15):5645–50.
18. Verdugo P. Supramolecular dynamics of mucus. Cold Spring Harb Perspect Med. 2012;2(11).
19. Ambort D, Johansson ME V, Gustafsson JK, Ermund A, Hansson GC.
Perspectives on mucus properties and formation- lessons from the biochemical world. Cold Spring Harb Perspect Med. 2012;2(11).
20. Johansson ME V, Gustafsson JK, Holmen-Larsson J, Jabbar KS, Xia L, Xu H, et al. Bacteria penetrate the normally impenetrable inner colon mucus layer in both murine colitis models and patients with ulcerative colitis. Gut. 2014;63(2):281–91.
21. Bergstrom KSB, Kissoon-Singh V, Gibson DL, Ma C, Montero M, Sham HP, et al. Muc2 protects against lethal infectious colitis by disassociating pathogenic and commensal bacteria from the colonic mucosa. PLoS Pathog. 2010;6(5).
22. Chassaing B, Koren O, Goodrich JK, Poole AC, Srinivasan S, Ley RE, et al. Dietary emulsifiers impact the mouse gut microbiota promoting colitis and metabolic syndrome. Nature [Internet]. 2015;519(7541):92–6. Available from: http://www.ncbi.nlm.nih.gov/pubmed/25731162
23. Velcich A, Yang W, Heyer J, Fragale A, Nicholas C, Viani S, et al. Colorectal Cancer in Mice Genetically Deficient in the Mucin Muc2. Science (80- ) [Internet]. 2002;295(5560):1726–9. Available from:
24. Asakura S, Oosawa F. On interaction between two bodies immersed in a solution of macromolecules. J Chem Phys. 1954;22(1954):1255–6.
25. Asakura S, Oosawa F. Interaction between particles suspended in solutions of macromolecules. J Polym Sci. 1958;33:183–92.
26. Vrij A. Polymers at interfaces and the interactions in colloidal dispersions. Pure Appl Chem. 1976;48:471–83.
27. Lieleg O, Vladescu I, Ribbeck K. Characterization of particle translocation through mucin hydrogels. Biophys J [Internet]. 2010;98(9):1782–9. Available from: http://dx.doi.org/10.1016/j.bpj.2010.01.012
28. Nguyen TLA, Vieira-Silva S, Liston A, Raes J. How informative is the mouse for human gut microbiota research? Dis Model Mech. 2015;8(1):1–16.
C h a p t e r 2
HIGH-MOLECULAR-WEIGHT POLYMERS FROM DIETARY FIBER
DRIVE AGGREGATION OF PARTICULATES IN THE MURINE
SMALL INTESTINE
1. A. Preska Steinberg, S. S. Datta, T. Naragon, J. C. Rolando, S. R. Bogatyrev, R. F. Ismagilov. 2018. "High-molecular-weight polymers from dietary fiber drive aggregation of particulates in the murine small intestine." eLife. 8:e40387. DOI: 10.7554/eLife.40387
Abstract
The lumen of the small intestine (SI) is filled with particulates: microbes, therapeutic particles, and food granules. The structure of this particulate suspension could impact uptake of drugs and nutrients and the function of microorganisms; however, little is understood about how this suspension is re-structured as it transits the gut. Here, we demonstrate that particles spontaneously aggregate in SI luminal fluid ex vivo. We find that mucins and immunoglobulins are not required for aggregation. Instead, aggregation can be controlled using polymers from dietary fiber in a manner that is qualitatively consistent with polymer-induced depletion interactions, which do not require specific chemical interactions. Furthermore, we find that aggregation is tunable; by feeding mice dietary fibers of different molecular weights, we can control aggregation in SI luminal fluid. This work suggests that the molecular weight and concentration of dietary polymers play an underappreciated role in shaping the physicochemical environment of the gut.
Introduction
Little is understood about the state of these particles in the small intestine; do these particles exist as a disperse solution or as aggregates? An understanding of how particulate matter is structured as it moves through the SI would contribute to fundamental knowledge on a host of topics, such as how microbes, including probiotics and pathogens, function in the SI (6–10). Knowledge of how particle suspensions change during transit would also provide insight into how the uptake of drugs and nutrients is affected by the physiochemical properties of the SI environment (3,4). It would also give us better comprehension of how the SI acts to clear potential invaders and harmful debris (2,11).
Polymers abound in the gut in the form of secretions (e.g., mucins and immunoglobulins) and dietary polymers (e.g., dietary fibers and synthetic polymers). It is well known that host-secreted polymers can cause aggregation of particles via chemical interactions; for example, mucins (12–16), immunoglobulins (17–25), and proteins (26) can cause bacteria to aggregate via an agglutination mechanism. However, non-adsorbing polymers can also cause aggregation via purely physical interactions that are dependent on the physical properties of the polymers, such as their molecular weight (MW) and concentration (27– 33). Here, we investigate whether these physical interactions play a role in structuring particles in the SI. For this work, we study the interactions between polystyrene particles densely coated with polyethylene glycol (PEG) and the luminal contents of the SI. It has been demonstrated previously that PEG-coated particles have little or no chemical interactions with biopolymers (34,35), so using PEG-coated particles allows us to isolate and investigate only the interactions dominated by physical effects.
Results
PEG-coated particles aggregate in fluid from the murine small intestine
in the center of the gut lumen. In contrast, PEG-coated particles were sometimes found co-localized with carboxylate-coated particles and also penetrated mucus, distributing across the underlying epithelium of the SI as aggregates and single particles.
To evaluate the distribution of particulate suspensions in the SI, we suspended 1-µm-diameter fluorescent PEG-coated particles (see Materials and Methods for synthesis) in buffers isotonic to the SI and orally administered them to mice. We chose 1 µm-diameter particles because of their similarity in size to bacteria. We collected luminal contents after 3 h and confirmed using confocal fluorescence and reflectance microscopy that these particles aggregated with each other and co-aggregated with what appeared to be digesta (Figure 2.1C and D; Materials and Methods). On separate mice, fluorescent scanning was used to verify that particles do transit the SI after 3 h (Figure 2.1A and B; Materials and Methods).
Figure 2.1:PEG-coated particles aggregate in the murine small intestine (SI).(A and
Given the rich complexity of the SI, wherein particles co-aggregate with digesta and bacteria, and are subjected to the mechanical forces of digestion and transit (39), and other phenomena, we developed an ex vivo assay to characterize the structure of particles in luminal fluid from the SI of mice. As a simple starting point, we sought to understand interactions among particles of known chemistry and the luminal fluid of the SI. To minimize chemical interactions with the biopolymers of the SI, we again chose PEG-coated polystyrene particles. PEG coatings have been shown to minimize biochemical interactions between polystyrene particles and biopolymers in a variety of contexts (34,35), and thus PEG-coated particles are commonly used in drug delivery (3,38,40).
To create PEG-coated polystyrene particles for the ex vivo experiments, we took 1-µm-diameter carboxylate-coated polystyrene particles and conjugated PEG to the surface (Materials and Methods). We used NMR to verify that PEG coated the surface of the particles (see Materials and Methods and Table 2.S8). We found that by coating with PEG 5 kDa and then coating again with PEG 1 kDa to backfill the remaining surface sites on the particle allowed us to achieve a lower zeta potential than applying a single coat of PEG 5 kDa (Table 2.S8). We chose these particles for use in our assay. It has been suggested in the literature that a near-zero zeta potential minimizes the interactions particles have in biological environments (35).
the transit time for food through the SI, which can be as short as ~80 min in healthy humans (39) and ~60 min in mice (44). On longer timescales, peristaltic mixing could also play a role (39); during fasting, the migrating motor complex (MMC) cycle first consists of a period of quiescence for ~30-70 min, followed by a period of random contractions, then by 5 to 10 minutes in which contractions occur at 11-12 counts per minute (cpm) in the duodenum and 7-8 cpm in the ileum. After eating, MMC is substituted with intermittent contractions in the SI and waves can occur at a frequency of 19-24 cpm in the distal ileum 1-4 h later. We therefore chose to focus on aggregation at short timescales (~10 min) because we sought to understand the initial formation of aggregates before aggregation is influenced by mechanical forces such as shear due to peristaltic mixing and the transit of food.
To quantify the amount of aggregation in samples of luminal fluid, we developed a method to measure the sizes of all aggregates in solution using confocal microscopy (see Materials and Methods). From these datasets, we created volume-weighted empirical cumulative distribution functions (ECDFs) of all the aggregate sizes in a given solution. We used these volume-weighted ECDFs to compare the extent of aggregation in a given sample (Figure 2.2F and H). To test the variability of aggregation in samples collected from groups of mice treated under the same conditions, we compared the extent of aggregation in pooled samples taken from three groups, each consisting of three male mice on a standard chow diet. We plotted the volume-weighted ECDFs of each sample (Figure 2.2F and H) and observed that the variation among the groups under the same conditions appeared to be small compared with the differences between the samples and the control.
close to overlapping, again suggesting there was little variability among pooled samples treated under the same conditions (male mice on a standard chow diet).
Fractionation of SI fluids suggests polymers play a role in aggregation of PEG-coated particles
Given that polymers can aggregate particles and bacteria via several mechanisms (12–33), we hypothesized that biopolymers in SI luminal fluid are involved in the aggregation of our PEG-coated particles. We therefore sought to first quantify the physical properties of the polymers in the luminal fluid of the SI. To do this, we used a 0.45-µm filter to remove additional debris and ran samples from a group of three chow-fed mice on a gel permeation chromatography (GPC) instrument coupled to a refractometer, a dual-angle light scattering (LS) detector, and a viscometer (details in Materials and Methods). Chromatography confirmed that polymers were indeed present in the SI fluid (Figure 2.3A and D). Because we do not know the refractive index increment (dn/dc) of the polymers present in these samples and the polymers are extremely polydisperse, we cannot make exact calculations of the physical parameters of these polymers. We can, however, calculate estimated values by assuming the range of the dn/dc values to be about 0.147 for polysaccharides and about 0.185 for proteins and then dividing the sample into different fractions based on retention volume (estimates of concentration and MW of polymers are displayed on Figure 2.3A and
D). The estimates suggest that the SI is abundant in polymers with a range of MWs.
To qualitatively test our hypothesis that biopolymers in the SI were involved in the aggregation of our PEG-coated particles, we collected SI luminal fluid from a different group of three male, chow-fed mice. We performed an additional filtration step (0.45-µm) to further ensure the removal of any solid materials. This filtrate was then separated into aliquots and each aliquot was run through a different MW cut-off (MWCO) filter (see
data supported our hypothesis that polymers were involved in the aggregation of these particles.
Aggregation of PEG-coated particles in model polymer solutions shows complex dependence on the concentration and MW of polymers.
Before exploring the complex environment of the SI further, we sought to first understand how our PEG-coated particles behaved in simple, well-characterized polymer solutions with similar MW and concentrations to those polymers we found in the SI in the previous experiments (Figure 2.3A and D). It has been demonstrated that the aggregation of colloids and bacteria can be controlled by altering the concentration and size of the non-adsorbing polymers to which particles are exposed (27–33). In these controlled settings, particles aggregate due to what are known as depletion interactions (27–29). Many groups have focused on depletion interactions with hard-sphere-like colloids; they often use polymethylmethacrylate particles sterically stabilized with polyhydroxystearic acid, because these particles closely approximate hard-sphere-like behavior (45,46). In these scenarios, depletion interactions are often described as forces that arise when particles get close enough to exclude polymers from the space between them, resulting in a difference in osmotic pressure between the solution and the exclusion region, leading to a net attractive force (27–31). Others have instead chosen to describe the phase behavior of the colloid/polymer mixture in terms of the free energy of the entire system (33,47). Short-range attractions (polymer radius is ten-fold less than particle radius) between hard-sphere colloids induced by polymers have been described successfully in the language of equilibrium liquid–gas phase separation (48,49).
as the characteristic polymer size shrinks, the colloids cease to aggregate, a phenomenon referred to as “depletion stabilization.”
To test whether our PEG-coated particles behave similarly to what has been previously found in mixtures of polymers and sterically stabilized particles, we created polymer solutions with PEG at a range of polymer concentrations and MWs and measured the extent of aggregation in these polymer/particle mixtures (Figure 2.4A-D). We chose PEGs that have MWs similar to the MW of polymers we found naturally occurring in the SI (Figure 2.3A, D): 1 MDa, 100 kDa, and 3350 Da. Using PEGs with similar physical properties (i.e., MW, concentration) as a simple model of polymers found in the SI allows us to focus solely on physical interactions between the particles and polymers. We created PEG solutions in HBSS at mass concentrations similar to those measured for polymers in the SI (Figure 2.3A
and D) and imaged the polymer/particle mixtures after ~10 min. HBSS was chosen because it has a similar pH and ionic strength to that of the SI (59,60). At the high ionic strengths of these buffered aqueous solutions (~170 mM), any electrostatic repulsions that can occur between particles should be screened to length scales of order the Debye screening length ~0.7 nm (61,62), nearly an order of magnitude smaller than the estimated length of the surface PEG brush (~6.4 nm; see Materials and Methods for more details). We again chose to look at aggregation on short timescales (after ~10 min) because we sought to understand the initial formation of aggregates; in the SI, on longer timescales, aggregation will likely also be influenced by mechanical forces such as shear due to peristaltic mixing and the transit of food.
7.5 ± 0.3. For the HBSS used, &' = 7.6 ± 0.1 (See Materials and Methods), which matches that of the LSI but not the USI. We therefore conducted the same in vitro
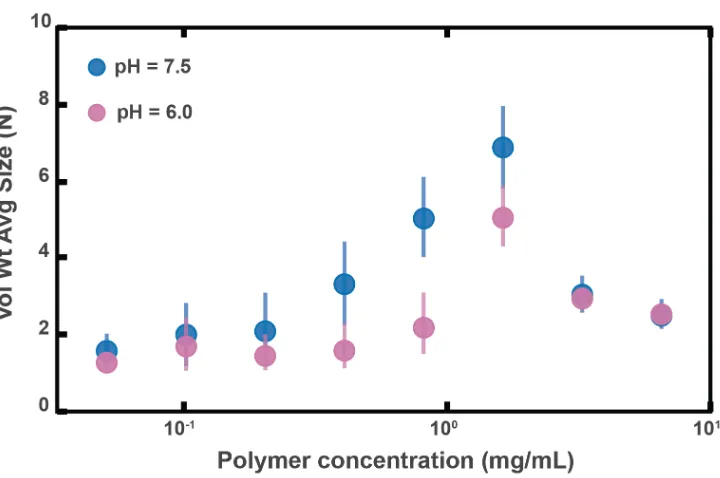
experiment for PEG 1 MDa in phosphate buffered saline with &' = 6.0 ± 0.1 (Materials and Methods and Figure 2.4 – figure supplement 1). We found some differences in the aggregation, but the overall trends were similar to before.
Overall, though our system is not at equilibrium at these short timescales, we found trends consistent with what has been observed in the literature for depletion interactions with sterically stabilized particles (50–58). At dilute polymer concentrations, the extent of aggregation increased with concentration. At higher polymer concentrations, the extent of aggregation began to decrease as the solutions begin to “re-stabilize.” Additionally, the extent of aggregation was greater for longer polymers. Interestingly, we found that the curves for the long polymers in Figure 2.4D could be collapsed by normalizing the polymer concentration by the overlap concentration (which denotes the transition between the dilute to semi-dilute polymer concentration regimes) for each respective polymer solution (Figure 2.4 – figure supplement 2). We next sought to describe the inter-particle potential using theory that combines depletion interactions with steric interactions.
We applied previously established theoretical frameworks that combine depletion interactions with steric interactions to better understand our system (50,54,58). To account for the depletion attractions between colloids we used the Asakura–Oosawa (AO) potential (Udep) (27–29):
1234(!) = 8
+∞ ;<! ! ≤ 0 −2@ΠBC D%B −!
2E
F
;<! 0 < ! < 2%B 0 ;<! ! > 2%B
(IJ. 2.1)
where Udep is given in joules, ΠP is the polymer osmotic pressure (in Pa), a is the radius of
the colloid (in m), RP is the characteristic polymer size (in m), and r is the separation
osmotic pressure, we used the following crossover equation for a polymer in a good solvent (63,64):
ΠB =
KLMNOP
QR SBT1 + U SB SB∗W
X.Y
Z (IJ. 2.2)
where ΠP is given in pascals, NAvo is Avogadro’s number, k is the Boltzmann constant, T
is the temperature (in kelvins), MW is the molecular weight of the polymer (in Da), SB is the polymer mass concentration (in kg/m3), and S
B∗ is the polymer overlap concentration (in kg/m3). This equation describes the polymer osmotic pressure well in both the dilute and semi-dilute regime.
For the characteristic polymer size, we used the concentration-dependent radius of gyration (31,65). This can be written as:
%B(SB) = %[(0) \
Q] KLMNOP
^ΠB
^SB _
`XF
(IJ. 2.3)
where %B(SB) is the concentration-dependent radius of gyration or the characteristic polymer size given in meters, Rg(0) is the radius of gyration (in m) at dilute concentrations
and ΠP is given by equation 2.2. The characteristic polymer size is given by the dilute
2.9 nm for PEG 1 MDa, 100 kDa, and 3350 Da, respectively. Using both the estimates of
Rg(0) and the MW of each polymer, we then estimated S4∗ for each polymer (63,71). We
estimated cp* = 1.6, 8.6, and 52.6 mg/mL for PEG 1 MDa, 100 kDa, and 3350 Da, respectively.
To account for steric interactions between the two grafted layers upon close inter-particle separations, we used equation 2.4 (50,52). For inter-particle separation distances between
L and 2L, where L is the length of the grafted layer, the steric interactions between the two grafted layers can be described using the Flory–Huggins free energy of mixing:
1a,cde(!) =
4@COP gX hikkkklFj
F
\1
2− m_ Dn − ! 2E
F
(IJ. 2.4)
where 1a,cde is the steric interaction energy due to mixing (given in joules), a is the particle radius (in m), gX is the volume of a water molecule (in m3), ikkkkFj is the average volume fraction of the grafted polymer (unitless), m is the Flory–Huggins interaction parameter for the grafted polymer and the solvent (unitless), and L is the length of the grafted layer (in m). For PEG in aqueous solvents, m = 0.45 (72). Our NMR measurements (see Materials and Methods for details) suggest that the grafting density of PEG is within the brush regime. We therefore use the Alexander–de Gennes approximation (63) and our NMR measurements to estimate the length of the grafted layer (L) as L ~ 6.4 nm and the average volume fraction to be ikkkk ~ Fj 0.43.
For inter-particle separations closer than L, one needs to account for elastic deformations of the grafted layers (50,57). This is far greater in magnitude than Udep, so one can simply
assume that at this point the potential is extremely repulsive. For inter-particle separations greater than L:
1(!) = p1a,cde1+ 1234 ;<! n < ! < 2n
Using this theoretical framework, we can build a physical intuition for the system (Figure 2.4E-G). Long polymers have depletion layers that extend out past the brush layer and overlap, inducing attractions between the particles (Figure 2.4E). For short polymers (RP < L), the depletion attractions are buried within the steric repulsions induced by the brush and there are effectively no attractions among the particles (Figure 2.4F). We can use this crossover to estimate the magnitudes of the minima in the inter-particle potentials for the three PEG solutions (Figure 2.4H). It should be noted that we have made several simplifications; for example, we do not consider interactions between free polymers and the grafted layer, which could lead to partial penetration of free polymers into the grafted layer or possible compression of the grafted layer by the free polymers (50,56,57). Despite such simplifications, we find that the calculated minima display similar concentration trends to the trends seen in the average aggregate sizes (Figure 2.4D). These calculations offer an explanation for why there is no aggregation of PEG-coated particles in solutions of PEG 3350.
Another factor that needs to be considered at the short timescales and low-volume fractions we are working at is aggregation kinetics (73–75). The probability that particles collide in solution is directly related to the diffusion coefficient and the volume fraction of the particles. As we increase the polymer concentration we increase the viscosity of the solution and decrease the diffusivity of the particles. In Figure 2.4I, we plot theoretical estimates of the diffusion coefficients of the particles against the concentrations of the PEG solutions. These diffusion coefficients were estimated using literature measurements, the Stokes–Einstein–Sutherland equation, and the Huggins equation for viscosity (63,68).
suggests that we should not expect short polymers to induce aggregation. Both trends are consistent with what we observe. Understanding how our PEG-coated particles behave in these so-called “simple” polymer solutions with similar physical properties to the intestinal polymers we detected (Figure 2.3A and D) informs the interpretation of the results of the next sections.
Figure 2.4 – figure supplement 1: Aggregation of PEG-coated particles in model polymer solutions with different pH. (A) Volume-weighted average sizes for serial dilutions of 1 MDa PEG solutions in a phosphate buffered saline solution with &' = 6.0 ± 0.1 (labeled pH = 6.0) and in Hank’s balanced salt solution (HBSS) with &' = 7.6 ± 0.1 (same data from Figure 2.4D). Volume-weighted average sizes are plotted on the vertical axis in terms of number of particles per aggregate (N) against polymer mass concentration (cp) in mg/mL. The vertical error bars are 95% empirical bootstrap CI (see Materials and Methods
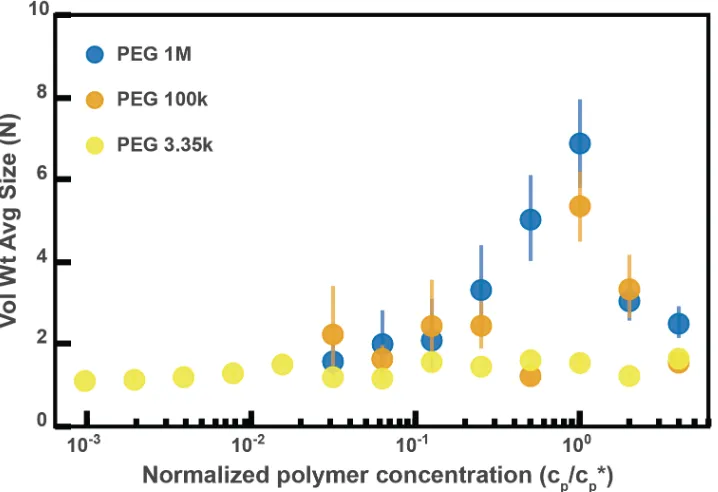
Figure 2.4 – figure supplement 2: Aggregation of PEG-coated particles in model polymer solutions from Figure 4D normalized by polymer overlap concentration.Volume-weighted average sizes for serial dilutions of 1 MDa PEG solutions in Hank’s balanced salt solution (HBSS). Volume-weighted average sizes are plotted on the vertical axis in units of number of particles per aggregate (N) against the “normalized polymer concentration.” The normalized polymer concentration is the polymer mass concentration (cp) in mg/mL divided by the overlap concentration of each polymer solution (cp*) in mg/mL. The overlap concentrations for PEG 1 MDa, 100 kDa, and 3350 Da are cp* = 1.6, 8.6, and 52.6 mg/mL, respectively. The vertical error bars are 95% empirical bootstrap CI (see Materials and Methods for bootstrapping procedure).
MUC2 may play a role in the aggregation of PEG-coated particles, but is not required for aggregation to occur
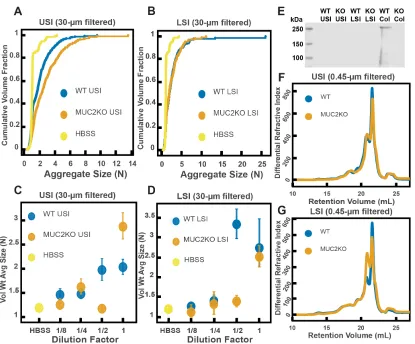
small intestine; however, because it is unclear how much Ca2+ is in the lumen of the upper small intestine, there could be soluble MUC2 in the upper small intestine. Additionally, the literature suggests that, based on the pH, there should be soluble MUC2 in the lower small intestine. We therefore tested if MUC2 drives aggregation in both the upper and lower small intestine. To do this, we compared the aggregation of our PEG-coated particles in samples from MUC2 knockout (MUC2KO) mice to samples from wild-type (WT) mice. To carefully preserve the native composition of the SI fluid, we used a protease-inhibitor cocktail when collecting the samples (see Materials and Methods). We confirmed mouse MUC2KO status via genotyping and Western blot (Figure 2.5E; Materials and Methods). The Western blot detected MUC2 in the colons of WT mice and not MUC2KO mice, as expected, however it did not detect a signal for MUC2 in the SI of either the WT or MUC2KO mice. We speculate that the lack of MUC2 signal in the SI of WT mice may be due to low levels of MUC2 present in the luminal contents of the SI.
We observed aggregation in samples from both the MUC2KO and WT mice (Figure 2.5 A-B). To test the strength of the aggregation effect in the different samples, we serially diluted the samples and measured the average aggregate size to see when the effect disappeared (Figure 2.5C-D). As explained in the previous section, we do not necessarily expect to see a linear decrease in aggregation with dilution. For simplicity, we will refer to the dilution factor at which aggregation begins to disappear as the “aggregation threshold.” We found differences in the aggregation threshold in the samples from MUC2KO and WT mice (Figure 2.5C-D), suggesting that although MUC2 is not required for aggregation to occur, it could play a role in the aggregation of PEG-coated particles.
and lower SI of MUC2KO and WT mice. We find that these estimates suggest there are some differences in the polymeric composition of the SI of these two groups.
Immunoglobulins may play a role in aggregation, but are not required for aggregation to occur
It has also been demonstrated that immunoglobulins can bind to bacteria and induce them to aggregate (17–25). We therefore wanted to test the hypothesis that immunoglobulins drive the aggregation of PEG-coated particles in the SI. To do this, we compared the aggregation of our PEG-coated particles in samples from groups of mutant mice that do not produce immunoglobulins (Rag1KO), to samples from groups of WT mice. Again, to carefully preserve the native composition of the SI fluid, we used a protease-inhibitor cocktail when collecting the samples (see Materials and Methods). Because Rag1KO mice are immunocompromised, they need be fed an autoclaved chow diet. To control any potential differences in diet, both the Rag1KO and WT mice were fed an autoclaved chow diet for 48 h before samples were collected.
The mice were confirmed to be Rag1KO via genotyping and Western blot (Figure 2.6E). According to the literature, IgA is abundant in the SI (79). As expected, we saw a signal for IgA in the upper and lower SI of WT mice. We also tested for less abundant immunoglobulins such as IgG and IgM (Figure 2.S4 and Figure 2.S5, respectively), but did not detect their presence in the luminal contents of either WT or KO mice.
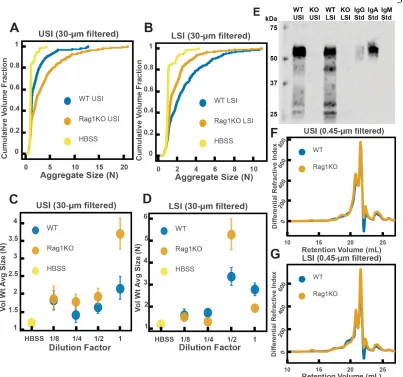
We observed aggregation in 30-µm-filtered samples from Rag1KO and WT mice (Figure 2.6A and B). To test the strength of the aggregation effect in the different samples, we serially diluted the samples and compared the volume-weighted average aggregate sizes at each dilution (Figure 2.6C and D). We found differences in the amount of aggregation between the Rag1KO and WT samples at different dilutions, suggesting that although immunoglobulins are not required for aggregation to occur, they could play a role in the aggregation of PEG-coated particles.
and Methods). The chromatograms from the refractometer (Figure 2.6F and G) suggested that the Rag1KO and WT samples were visually similar. We again made estimates of the physical parameters of the polymers in these samples (summarized in Tables 2.S3–S4). These estimates suggest that there are some differences in the polymeric composition of the SI of these two groups of mice.
To test whether these measured differences in polymeric composition correspond with differences in aggregation, we quantified aggregation in the 0.45-µm-filtered samples. We found that the undiluted samples for both groups displayed aggregation (Figure 2.S6A and
B). When we created serial dilutions of the samples we found that the levels of aggregation were similar (Figure 2.S6C and D). Taken together, the results suggest that immunoglobulins may play some role in aggregation, but the presence of immunoglobulins are not required for aggregation to occur.
Polymers in the diet control aggregation of PEG-coated particles in a manner consistent with depletion-type interactions
As described in Figure 2.4, the extent of aggregation can be controlled by altering the polymer size and concentration of the polymer solution. Furthermore, as pointed out above, SI fluid from mice fed autoclaved and non-autoclaved diets induced different levels of aggregation. We hypothesized that aggregation behavior would differ between mice fed polymers of different sizes—even if the polymers were composed of similar chemical monomers and were present at the same polymer mass concentration. We hypothesized that mice fed short polymers would exhibit less aggregation in the SI (i.e., short polymers reduce the strength of the effect because depletion attractions are reduced). We predicted that the converse would be true for long polymers (i.e., long polymers increase the strength of the effect because depletion attractions are increased).
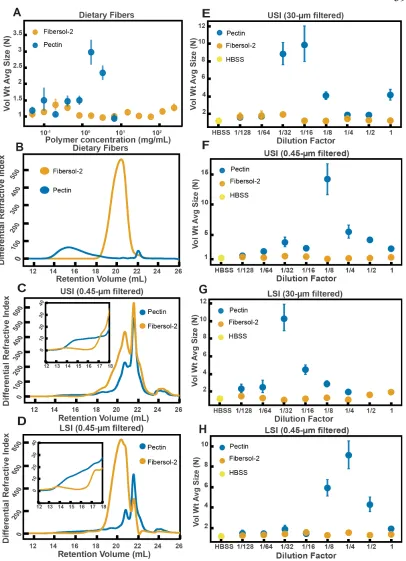
We first identified two candidate dietary carbohydrate polymers; Fibersol-2, a “resistant maltodextrin” composed of D-glucose monomers (80,81), with a MW of ~3500 Da (see Table 2.S5) and apple pectin, composed of D-galacturonic acid and D-galacturonic acid methyl ester monomers (82,83), with a MW of ~230 kDa (Table 2.S5). Before feeding mice these polymers, we first tested their effects on aggregation in vitro at various concentrations in buffer (Figure 2.7A). We found similar trends to the PEG solutions in Figure 2.4. Pectin at low (~0.05 to ~1 mg/mL) and very high mass concentrations showed little aggregation (~7 mg/mL) and showed the most aggregation at an intermediate concentration (~1.5 to ~3 mg/mL). Fibersol-2 did not induce much aggregation up to a mass concentration of ~240 mg/mL.
not re-ingest polymers from fecal matter via coprophagy. According to the literature, neither of these two polymers should be broken down in the SI (81,84,85). As before, all samples were collected with a protease-inhibitor cocktail.
As before, we created serial dilutions of the small intestinal luminal fluid and looked at the extent of aggregation in each sample. In the 30-µm-filtered samples from the upper SI we observed more aggregation in the pectin-fed mice compared with the Fibersol-2 fed mice (Figure 2.7E). For the undiluted 30-µm-filtered lower SI sample, the pectin-fed mice samples formed a gel-like material which we were unable to pipette and therefore could not use for aggregation experiments. This gelation is not too surprising considering that pectin can form a gel in certain contexts (83,86). We were able to dilute this gel four-fold and then compare the aggregation in serial dilutions of the pectin-fed LSI to the fed LSI. We found, again, more aggregation in the pectin-fed mice than the Fibersol-2-fed mice (Figure 2.7G).
form a gel or aggregates in solution (83,86). We note, therefore, that by 0.45-µm-filtering these samples we may be removing these structures and decreasing the concentration of pectin in our samples.
To test that these measured differences in polymeric composition are reflected in differences in aggregation, we tested aggregation in the 0.45-µm-filtered samples. We found that in both the upper and lower SI samples, the samples from the pectin-fed group showed more aggregation than the samples from the group fed Fibersol-2 (Figure 2.7F and
H). When we created serial dilutions of these samples, we found that the samples from the mice fed Fibersol-2 showed almost no aggregation at any concentration whereas the samples from pectin-fed mice showed aggregation. We also observed that we needed to dilute the 30-µm-filtered samples more to achieve the greatest extent of aggregation (Figure 2.7E and G). We speculate that this shift in the aggregation behavior between the 30-µm-filtered and 0.45-µm-filtered samples is due to some of the polymers being lost when 0.45-µm-filtering the samples as a result of the aforementioned self-association of pectin.
aggregate (N) against polymer concentration (mg/mL). The vertical error bars are 95% empirical bootstrap CI using the bootstrapping procedure described in Materials and Methods. (B) Chromatograms of apple pectin and Fibersol-2 in buffer. (C and D) Chromatograms of samples from the upper (E) and lower (F) SI of two separate groups of mice (fed pectin or Fibersol-2). (E-H) Volume-weighted average aggregate sizes (Vol Wt Avg Size) for serial dilutions of 30-µm-filtered samples from the upper (E) and lower (G) SI of two separate groups of mice (fed pectin or Fibersol-2) to the control (particles suspended in HBSS). (F and H) Serial dilutions of 0.45-µm-filtered samples from the same groups. The dilution factor is plotted on the horizontal axis, where a dilution factor of 1 is undiluted, and ½ is a two-fold dilution. The vertical error bars are 95% empirical bootstrap CI using the bootstrapping procedure described in Materials and Methods.
Discussion
This work shows that even PEG-coated particles, which have minimal biochemical interactions, form aggregates in the luminal fluid of the SI. It reveals a previously unknown way in which dietary polymers can impact, and be used to control, the structure of particles in the SI. We speculate that this phenomenon may play a role in the aggregation of other particles in the SI such as microbes, viruses, nanoparticles for drug delivery, and food granules. In these systems, other factors will also inevitably affect the formation of these aggregates (e.g. interactions with mucins and immunoglobulins); thus, it will be important to explore the interplay among all these factors. Another important next step is to investigate how mixing in the SI and the co-aggregation of different types of particles may affect aggregation. We speculate that the aggregation of particles in the SI could also have functional consequences, such as promoting colonization by microbes, affecting infection by pathogens, and altering clearance of microbes (2,6–8,10,11). Aggregation will also need to be considered when designing nanoparticles for drug delivery (3,4).
work needs to be done to understand the underlying mechanism, but surprisingly the observed aggregation behavior in the SI luminal fluid from mice fed dietary polymers of different sizes is qualitatively consistent with the aggregation behavior in simple PEG solutions, where aggregation is driven by depletion interactions. Overall, this suggests a simple dietary method for controlling aggregation in the gut. It will be important to extend this work to microbes and other particles commonly found in the gut and to measure the relative contributions of polymer-driven aggregation and chemical-driven aggregation. We note that mucins and immunoglobulins are polymers that can also self-associate into structures of very high MW (78,87,88), suggesting that they could cause aggregation via both physical and chemical mechanisms. Interestingly, during the review of this manuscript, a study was published with in vitro work done using model buffer solutions of mucins, DNA, and other biopolymers further implying that aggregation of bacteria by host-polymers can be depletion-mediated (89). In vivo, it will also be important to consider the effects of flow, as it has been shown that flow in non-Newtonian fluids can induce particle aggregation (90–92). In particular, studies have suggested that the combination of flow and polymer elasticity can lead to aggregation (93) and that shear thinning viscosity can influence aggregation as well (94). In our work, we neglected flow effects for simplicity and thus our findings are most applicable to the initial formation of aggregates before aggregation is influenced by mechanical forces due to peristaltic mixing and the transit of food. A rudimentary estimate of the Weissenberg number (see Materials and Methods), which weighs the contributions of elastic and viscous forces, yields Wi ~ 0.3 to 10, suggesting that elasticity-induced effects may play a role in the SI and will be an important direction to pursue in follow-up studies. If flow-induced clustering does occur in vivo, the literature suggests it would aid in the process, perhaps enhancing particle aggregation.
industrial food processing on MW of the dietary polymers present in foods, and which processing methods preserve or produce high-MW polymers that impact mucus compression (97) and particle aggregation in the gut.
Materials and Methods
Table 2.1: Key Resources Table Reagent type
(species) or resource
Designation Source or reference
Identifiers Additional information
MUC2KO, C57BL/6 mice (female)
MUC2KO Eugene Chang Lab provided initial breeding pairs which were provided to them from Leonard H. Augenlicht at the Department of Oncology of Albert Einstein Cancer Center Genotyping was performed by Transnetyx Inc.; Western blot was done to confirm lack of MUC2 (See Fig. 2.5E)
Rag1KO, C57BL/6 mice (male)
Rag1KO Provided by Mazmanian Lab at Caltech
Western blot
was done to confirm lack of IgA as
explained in the text (See Fig. 2.6E) C57BL/6 mice (all male except for WT controls in MUC2KO experiments in Figure 5 and S3)
WT The Jackson
Laboratory
antibody MUC2 polyclonal antibody
Biomatik Cat No:
(rabbit host) antibody Li-Cor
IRDye 800CW Goat Anti-Rabbit IgG
Li-Cor P/N
925-32211
antibody Li-Cor IRDye 800 CW Goat Anti-Mouse IgG
Li-Cor P/N
925-32210
antibody Li-Cor IRDye 800 CW Goat Anti-Mouse IgM
Li-Cor P/N
925-32280
antibody Goat Anti-Mouse IgA-unlabeled
SouthernBiotech Cat No: 1040-01
antibody Li-Cor IRDye 800 CW
Donkey Anti-Goat IgG
Li-Cor P/N
925-32214
chemical compound, drug
apple pectin Solgar Inc. "Apple pectin powder"; SOLGB70120 00B chemical compound, drug
Fibersol-2 Archer Daniels Midland/Matsutani LLC Product code: 013100, Lot #: CY4P28540 chemical compound, drug USP grade sucrose Sigma-Aldrich chemical compound, drug Protease inhibitor cocktail Roche cOmplete, Mini, EDTA-free Protease-Inhibitor cocktail, Roche chemical compound, drug PEG 100kDa
Dow POLYOX
chemical compound, drug
PEG 1 MDa
Dow POLYOX
WSR N-12K
chemical compound, drug
PEG 3350 Bayer MiraLAX
chemical compound, drug Hanks' Balanced Salt Solution (without calcium, magnesium, phenol red) GE Healthcare
Life Sciences Product code: SH30588.02
software, algorithm 3D aggregate analysis pipeline
This paper; source code available through Dryad Description in Materials and Methods; source code provided on Dryad
other
mesh-bottom (or wire-bottom) floors
Lab Products, Inc. P/N: 75016
other 1-μm
diameter PEG 5kDa-coated polysytrene beads
This paper Description of
synthesis in Materials and Methods
other 1-μm
diameter PEG 5kDa-coated polysytrene beads with PEG 1 kDa "back-filling"
This paper Description of
synthesis in Materials and Methods
other standard
chow diet
PicoLab PicoLab
Rodent Diet 20; Product #5053
other autoclaved chow diet
PicoLab Laboratory
Autoclavable Rodent Diet 5010
Details of animals used
All mice were male or female specific pathogen free (SPF) C57BL/6 mice between 8-16 weeks old. Mice on a standard, solid chow diet were given food and water ad libitum.
Immunoglobulin-deficient (Rag1KO) mice were maintained on an autoclaved chow diet due to their immunocompromised status. The control group of WT mice used as a comparison to this group was maintained on the same autoclaved chow diet for 48 h before euthanasia. Genotyping of MUC2 deficient (MUC2KO) and Rag1KO mice was done by Transnetyx (Transnetyx, Inc., Cordova, TN, USA). Mice given only apple pectin (Solgar, Inc., Leonia, NJ, USA) with sucrose (USP grade, Sigma-Aldrich, St. Louis, MO, USA) or Fibersol-2 (Archer Daniels Midland/Matsutani LLC, Chicago, IL, USA) with sucrose were first raised on a standard chow diet and given water ad libitum, then were maintained on a restricted diet consisting of only 2% apple pectin + 5% sucrose or 2% Fibersol-2 + 5% sucrose for 24 h. For those 24 h, these mice were kept on mesh-bottom cages to prevent the re-ingestion of polymers from the standard chow diet via coprophagy. The MUC2KO colony was raised and maintained by the Ismagilov Lab. The Rag1KO mice were provided by the Mazmanian lab (Caltech). All other mice were from Jackson Labs (The Jackson Laboratory, Bar Harbor, ME, USA). All animal experiments were approved by the California Institute of Technology (Caltech) Institutional Animal Care and Use Committee (IACUC) and the U.S. Army’s Animal Care and Use Review Office (ACURO). Mice were euthanized via CO2 inhalation as approved by the Caltech IACUC in accordance with the American Veterinary Medical Association Guidelines on Euthanasia (98).
Oral administration of particles