New Classification System with Application to
Schistosomiasis Control
Casey Olives1,2, Joseph J. Valadez3*, Simon J. Brooker4,5, Marcello Pagano2
1Department of Biostatistics, University of Washington, Seattle, Washington, United States of America,2Department of Biostatistics, Harvard University, Boston, Massachusetts, United States of America,3Department of International Health, Liverpool School of Tropical Medicine, Liverpool, United Kingdom,4Faculty of Infectious and Tropical Diseases, London School of Hygiene and Tropical Medicine, London, United Kingdom,5Kenya Medical Research Institute-Wellcome Trust Research Programme, Nairobi, Kenya
Abstract
Background: Originally a binary classifier, Lot Quality Assurance Sampling (LQAS) has proven to be a useful tool for classification of the prevalence ofSchistosoma mansoniinto multiple categories (#10%,.10 and,50%,$50%), and semi-curtailed sampling has been shown to effectively reduce the number of observations needed to reach a decision. To date the statistical underpinnings for Multiple Category-LQAS (MC-LQAS) have not received full treatment. We explore the analytical properties of MC-LQAS, and validate its use for the classification ofS. mansoniprevalence in multiple settings in East Africa.
Methodology: We outline MC-LQAS design principles and formulae for operating characteristic curves. In addition, we derive the average sample number for MC-LQAS when utilizing semi-curtailed sampling and introduce curtailed sampling in this setting. We also assess the performance of MC-LQAS designs with maximum sample sizes ofn= 15 andn= 25 via a weighted kappa-statistic usingS. mansonidata collected in 388 schools from four studies in East Africa.
Principle Findings:Overall performance of MC-LQAS classification was high (kappa-statistic of 0.87). In three of the studies, the kappa-statistic for a design withn= 15 was greater than 0.75. In the fourth study, where these designs performed poorly (kappa-statistic less than 0.50), the majority of observations fell in regions where potential error is known to be high. Employment of semi-curtailed and curtailed sampling further reduced the sample size by as many as 0.5 and 3.5 observations per school, respectively, without increasing classification error.
Conclusion/Significance:This work provides the needed analytics to understand the properties of MC-LQAS for assessing the prevalance ofS. mansoniand shows that in most settings a sample size of 15 children provides a reliable classification of schools.
Citation:Olives C, Valadez JJ, Brooker SJ, Pagano M (2012) Multiple Category-Lot Quality Assurance Sampling: A New Classification System with Application to Schistosomiasis Control. PLoS Negl Trop Dis 6(9): e1806. doi:10.1371/journal.pntd.0001806
Editor:J. Russell Stothard, Liverpool School of Tropical Medicine, United Kingdom
ReceivedJanuary 3, 2012;AcceptedJuly 17, 2012;PublishedSeptember 6, 2012
Copyright:ß2012 Olives et al. This is an open-access article distributed under the terms of the Creative Commons Attribution License, which permits unrestricted use, distribution, and reproduction in any medium, provided the original author and source are credited.
Funding:CO and MP were supported in part by grant 1R01AI097015-01A1 from the National Institutes of Health. CO received additional support from the Biostatistics, Epidemiologic and Bioinformatic Training in Environmental Health Training Grant T32 ES015459. SJB was supported by a Senior Research Fellowship (098045) from the Wellcome Trust. JJV received funding from the Liverpool School of Tropical Medicine. The funders had no role in study design, data collection and analysis, decision to publish, or preparation of the manuscript.
Competing Interests:The authors have declared that no competing interests exist.
* E-mail: [email protected]
Introduction
Schistosomiasis is a tropical disease caused by infection with
Schistosomaparasitic worms. The disease burden of schistosomiasis is greatest in sub-Saharan Africa (SSA) which shoulders 85% of the global burden [1,2], with school-age children as well as adolescent girls and women of childbearing age suffering the greatest consequences of infection [3,4]. The two main species responsible for schistosomiasis in SSA areSchistosoma haematobium, which causes urinary schistosomiasis, and S. mansoni, responsible for intestinal schistosomiasis.
The World Health Organization (WHO) recommends a three-way classification (#10%, .10 and ,50%, $50%) of the prevalence of schistosome infection to determine appropriate
interventions for school-age children [4,5]. These classifications are generally made using classical statistical approaches with data collected in parasitological surveys of between 250 and 500 children in five to ten schools per ecological zone (about 50 children per school) [6,7]. However, this recommendation is based on logistical concerns more so than statistical ones. Sampling 50 children in multiple schools may be financially prohibitive and there is a need for rapid assesment methods for defining the distribution of infection in order to target control [8]. For identifying communities/schools with high prevalences of S. haematobiumthe WHO recommends the use of questionnaires of self-reported blood in urine or parasitological tests [9]. Concerns about the lack of a reliable questionnaire approach forS. mansoni
the use of lot quality assurance sampling (LQAS), to reduce the sampling effort required to assess the prevalence and distribution ofS. mansonibased on parasitological surveys [10,11].
A classification tool, LQAS has been used in a variety of settings to identify program areas as either ‘‘acceptable’’ or ‘‘unaccept-able’’ with respect to a preestablished target [12,13]. As early as 2001, Rabarijaonaet alutilized LQAS to classify the prevalence of
S. mansoni[14,15]. More recently, a number of studies have been published which utilize LQAS to provide a three-way classification of disease. In 2003, Myattet alused LQAS to provide a ternary classification of the prevalence of active trachoma in Malawi [16]. In order to provide a finer classification, Myatt specified two classic LQAS sampling plans with the goal of classifying areas as low/not low and high/not high. Areas classified as both ‘‘not low’’ and ‘‘not high’’ were classified as moderate. In addition, Myattet al
allowed for early stopping in the sampling procedure contigent upon reaching a maximum allowable number of failures in the sample. Brookeret al went on to apply this three-way LQAS to identify schools with a high prevalence ofS. mansoniin Uganda, finding that an LQA sample size fo 15 (n = 15) provided reliable classification of infection prevalence [8]. This study showed that the use of an LQAS-based classification system in high transmis-sion settings could drastically reduce the cost of treatment when compared both to the conventional survey method and to blanket treatment without prior screening. These studies demonstrate that LQAS can be used to provide a more precise classification than the traditional method.
The Brookeret almultiple classification scheme was evaluated by simulation from a large database of 202 Ugandan schools. While this represents an important step toward validating 3-way LQAS, the results are entirely contingent upon the data in the database and therefore provide little insight into how the same method will perform when applied to different regions with even minor deviations in the underlying distribution of disease. Moreover, the simulation approach to validation gives little guidance for designing a survey where prior information is either sparse or unavailable. If a three-way classification LQAS system is to be used in other settings, it is important to understand the statistical underpinnings of the methodology and provide guide-lines for designing such surveys in other settings or for other diseases.
The primary aim of the current work is the development of a unified Multiple Category-LQAS tool (MC-LQAS) and the validatation of its use in multiple setting in East Africa. Specifically, we outline the theoretical underpinnings of
MC-LQAS system, focusing on classification into one of three categories, and provide guidelines for choosing design parameters. Next, we present the theoretical aspects of sequential sampling as employed by researchers in the field [8,16,17,18]. Sequential LQAS, known in the statistical literature as semi-curtailed sampling, allows for potential reduction in the sample size required to make a decision without impacting classification error. A worked example of the tool to assess the prevalence ofS. mansoni
in 388 schools in Kenya, Uganda, and Tanzania is given [19,20,21]. The primary design examined is that used by Brooker
et al[8] and we discuss the analytical properties of this approach. Finally, we validate the multiple classification system against the standard approach to classification and show that the use of an LQAS based system can substantially reduce the necessary sample size, while providing valid information for selecting the appropri-ate intervention strappropri-ategy.
Methods
LQAS
Traditional LQAS calls for a random sample of n binary observations from a ‘‘lot’’. If the number of successes in the sample,
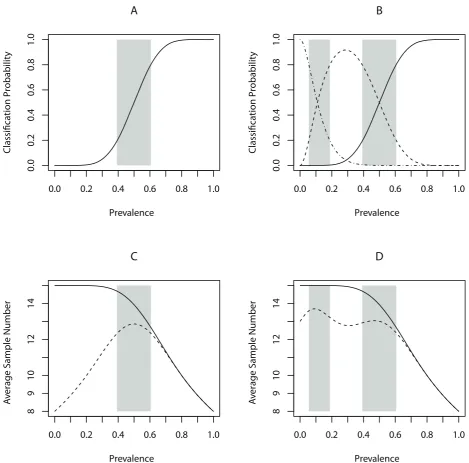
X, is less than or equal to a predefined decision rule,d, the locale is classified as unacceptable. Otherwise, the locale is classified as acceptable. The word ‘‘success’’ is a statistical convention but typically denotes a failure to meet an established criterion or receive an intervention. In the case of sampling forS. mansoni, the number of successes are cases ofS. mansoniinfection. If the number of infected cases exceeded a pre-determined level, then the lot is rejected and the school/community is identified as in need of mass treatment. A succinct summary of any LQAS design is the Operating Charac-teristic (OC) curve [22]. The OC curve depicts the probability of an acceptable classification against the true underlying prevalence,p. We assume thatprepresents the proportion in a given population with infection, such asS. mansoniinfection. An example of an OC curve is given in Figure 1A withn = 15andd = 7.
The choice of the sample size and decision rule are critical, as they determine the expected classification error in the procedure. Generally,nanddare chosen so that the probability of incorrectly classifying a locale as having low prevalence is less than or equal to
aand the probability of incorrectly classifying a locale as having high prevalence is less than or equal to b. In many cases, practitioners associate the labels ‘‘low’’ and ‘‘high’’ with values of the prevalence below and above some value,p*, respectively. In practice, classification probabilitites are evaluated at upper and lower thresholdspUandpL, and the value ofp*serves little purpose aside from informing the choice of these two parameters. For an appropiately chosen design, the values of the OC curve atp = pU
andp = pLwill be approximately equal to some predefined values 12a and b, respectively. For example, the design depicted in Figure 1A is chosen so that at pL= 0.40 and pU= 0.60, the probability of an acceptable classification is less than or equal to
b= 0.20to the left ofpLand greater than or equal to12a= 0.80, to the right ofpU.
Due to the monotonicity of the OC curve, it follows that for any
p beyond the upper or lower thresholds, the probability of committing an error is no greater thanaorb.
Pr (XvdDpU)~
X
d{1
x~0
n x !
px
U(1{pU)n
{x
ƒa
Pr (X§dDpL)~ Xn
x~d
n x !
pxL(1{pL)n
{xƒb Author Summary
The control of schistosomiasis calls for rapid and reliable classification tools. This study evaluates the performance of one such tool, Lot Quality Assurance Sampling (LQAS) for assessing the prevalence of S. mansoni in African schoolchildren. We outline the design considerations and introduce novel sequential sampling plans for Multiple Category-LQAS. We use data from 388 schools in Uganda, Kenya, and Tanzania to assess the performance of LQAS as a tool for classification ofS. mansoniinfection into one of three classes:#10%,.10 and,50%,$50%. Our findings suggest that an LQAS-based multiple classification system performs as well as the World Health Organization recommended methods at a fraction of the sampling effort. Our work validates LQAS as a rapid assessment tool and extends it to allow investigators to apply the method to control other infectious diseases.
An additional property of the OC curve is that it makes explicit the values of pfor which LQAS runs a risk that is higher than the maximum ofaandb; the value of the OC curve increases fromb
to12aaspincreases frompLtopU. The area betweenpLandpUis
commonly referred to as the ‘‘grey region’’. Thus a locale which truly has prevalence p such that pL,p,pU will be classified as acceptable with probability somewhere in the range (b, 12a) (assumingb,12a).
MC-LQAS
The MC-LQAS procedure extends basic LQAS by classifying a sample against multiple decision rules. In the following we develop MC-LQAS for three-way classification although the method is
generalizable to more than three categories. For three-way classification, we must choose a total of two decision rules, d1
and d2. If the number of successes, X, out of a total of n
observations is less than or equal tod1, classify the prevalence as low. If X is greater than d2, classify the prevalence as high. Otherwise, classify the prevalence as medium, the middle category.
Analogous to the OC curve, for a specific design we can plot the probability of classification into each of the three categories against
pto succinctly summarize the MC-LQAS design. Figure 1B shows the OC curve for a three-way classification procedure withn = 15, d1= 1, d2= 7. Note that this is a simple extension of the two-way design discussed previously where we now allow for the
Figure 1. Operating Characteristic curves and Average Sample Number for LQAS and MC-LQAS.A) Operating Characteristic curve for LQAS design with n = 15,d = 7, anda=b= 0.20; B) Operating Characteristic curves for low (dashed-dotted), medium (dashed), and high (solid) categories for MC-LQAS design with n = 15, d1= 1, d2= 7, andd1=d1=d1=d1= 0.20; C) Average Sample Number for semi-curtailed (solid) and curtailed (dashed) LQAS with n = 15 and d = 7; D) Average Sample Number for semi-curtailed (solid) and curtailed (dashed) MC-LQAS with n = 15, d1= 1, and d2= 7.
‘‘unacceptable’’ category to be parsed into ‘‘moderate’’ and ‘‘low’’, thus making explicit the connection between this development and that of Myattet aland Brookeret al[8,16]. Of note is the bell-shape of the curve for classification into the moderate category. The lack of monotonicity for this curve is one characteristic of MC-LQAS which sets it apart from LQAS and plays an important role with respect to choosing a design.
As with LQAS, in practice we choose to control for potential misclassification at predetermined thresholds, which we callpL1,
pU1, pL2, andpU2. These should be chosen so thatpL1,p1*,pU1
andpL2,p2*,pU2, and in practice it oftentimes makes sense to set
p1* = pL1and p2* = pU2. To control for the amount of misclassi-fication, we choose d1 and d2 so that the probability of correct
classification remains high at these thresholds. That is, choose the decision rules so that
Pr (Xƒd1DpL1)§1{d1
Pr (d1vXƒd2DpU1)§d1and Pr (d1vXƒd2DpL2)§1{d3 Pr (Xwd2DpU2)§1{d4
whered1, d2, d3and d4 reflect the acceptable levels of potential
error determined by the investigator. This is directly analogous to choosing upper and lower thresholds,pLandpU, in classical
two-way LQAS with the notable exception of the moderate category, where we see that it is important to control for the possible error at two locations. This has to do with the aforementioned bell shape of the moderate OC curve. The lack of monotonicity makes it so that one must control for error at bothpU1andpL2.
We note that in the above formulation, we have ignored possible misclassification into the extreme categories. Depending on the distance between thresholds, misclassification into a non-contiguous category can be minimal for even small samples. Hence, for moderate sample sizes, we only worry about four possible misclassifications, which are those misclassifications into contiguous classes.
Curtailed and Semi-Curtailed Designs
In certain situations, it is possible to reduce the sample size needed to reach a decision by ‘‘sampling to the decision rule’’. For example, suppose we define a traditional LQAS plan with a sample size n = 15 and d = 7. Suppose further that during data collection we find that the first eight observations are successes. At this point, we need not sample further to know the resulting classification will be acceptable. The analytical properties of this type of sampling are neither well-documented nor well-understood in the public health literature. However, this process is referred to as semi-curtailed sampling in the statistics literature where it has been in use for the past fifty years [23,24,25]. The main benefit of this type of sampling is the potential to reduce the overall number of observations, or the Average Sample Number (ASN), required to reach a decision.The semi-curtailed ASN is plotted as a function of the prevalence with n = 15 and d = 7 in Figure 1C and its derivation provided in the Appendix S1. A feature of semi-curtailed sampling is that it preserves the OC curve, which means that the expected error rates are not affected [25]. Thus, there seems to be little drawback to employing semi-curtailed sampling when feasible to reduce the sample size.
Indeed, one can benefit even more by adopting a curtailed
sampling plan [23]. That is, one can terminate sampling either if the number of successes is too great or too few at a given point. To continue with our example, suppose instead that the first eight observations are failures. In this case, it is not possible to observe more than seven successes in the remaining observations, and
sampling can also cease. The curtailed ASN plotted as a function of the prevalence withn = 15andd = 7is plotted in Figure 1C and its derivation is included in the Appendix S1. Once again, the employment of curtailed sampling does not affect the OC curve.
The notion of curtailed sampling is easily extended to MC-LQAS. For example, MC-LQAS also allows for the potential of early stopping by sampling to the decision rule, or semi-curtailed sampling. For example, when utilizing an MC-LQAS design with
n = 15, d1= 1 and d2= 7, sampling can terminate with a high classification as soon as the number of successes excedes seven. The ASN for MC-LQAS when employing semi-curtailed sampling is equal to the ASN in traditional LQAS.
The curtailed version of MC-LQAS is slightly different than its traditional counterpart in that it allows for early stopping for low, moderate, or high classifications. Continuing with our example, if the first thirteen observations are failures, then it follows that the lot will be classified as low irrespective of the remaining observations. Likewise, if in the first twelve observations are four successes and eight failures, then sampling can stop with a moderate classification, as neither low nor high classifications are possible at this point. The semi-curtailed and curtailed ASNs for an MC-LQAS design withn = 15,d1= 1, andd2= 7are plotted as a function of the prevalence in Figure 1D. We note that the functional form of the ASN under curtailed sampling will generally be bi-model, which reflects the two areas of uncertainy or grey regions. It follows for the same reasons as in the traditional LQAS setting that the OC curves for MC-LQAS are not affected by sequential sampling of this nature. Proofs of these results are given in the Appendix S1.
Application to Prevalence ofS. mansoniin East African Schools
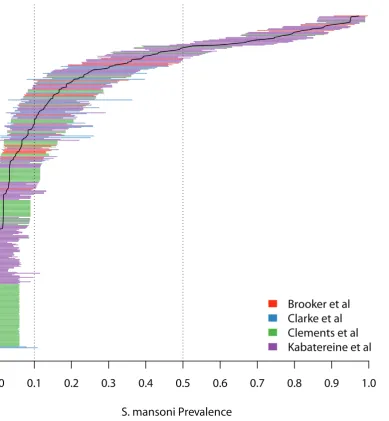
In the following, we consider S. mansonidata reported in four different studies; two in Kenya [19,21], one in Uganda [26], and one in Tanzania [20]. In each study, a sample of school children in multiple schools were randomly selected to provide stool samples which were examined microscopically for the ova of S. mansoni, hookworm,Ascaris lumbricoides, andTrichuris trichiura. The number of schools sampled ranges from 21 [19] study to 199 [26] with school sample sizes as low as 21 and as high as 202. In Figure 2, the estimated prevalence ofS. mansoniin each of the 388 schools, along with 95% exact binomial confidence intervals, are plotted for each of the four studies.
We use these data to assess the performance of the MC-LQAS design withn = 15,d1= 1, andd2= 7and compare with expected
performance. This design differs slightly from that which was utilized in the 2005 Brooker study, whered1= 2[8]. Our current choice reflects a 2006 change in WHO guidelines which shifted the lower programmatic threshold from 20% to 10% [5]. Note that decision rules d1= 1 and d2= 7 corresponds to prevalence decision thresholds of 6.7% and 46.7%, respectively. To choose upper and lower thresholds, we assume that the desired probability of correct classification should be greater than or equal to 0.80 uniformly (i.e.d1=d2=d3=d4= 0.20). Under this assumption, we
can solve for the upper and lower thresholds, yieldingpL1= 0.055,
pU1= 0.188, pL2= 0.392, andpU2= 0.606. Additionally, to assess the impact of increasing the sample size on classification agreement, we consider an MC-LQAS design withn = 25,d1= 2
and d2= 12. Using the same approach, we identified upper and lower thresholds of pL1= 0.062, pU1= 0.164, pL2= 0.417, and
pU2= 0.583for this design.
We generate 1000 MC-LQAS classifications of each school in the sample by repeatedly ‘‘sampling down’’ the individual data to 15 or 25 students and classifying each school based on these
observations. To compare the classifications resulting from MC-LQAS with those that result from binning the full sample prevalence, we calculate for each simulation the weighted kappa statistic, which measures agreement between classification meth-ods across locations [27]. We report the mean kappa statistic and interquartile range (IQR) across the 1000 simulations. In addition, we calculate the ASN in each simulation when employing both semi-curtailed and curtailed sampling plans and report the mean ASN and IQR across the 1000 simulations. Lastly, we calculate the proportion correctly classified as a function of the full sample prevalence. All simulations were conducted using R statistical software, version 2.11.1 [28].
Results
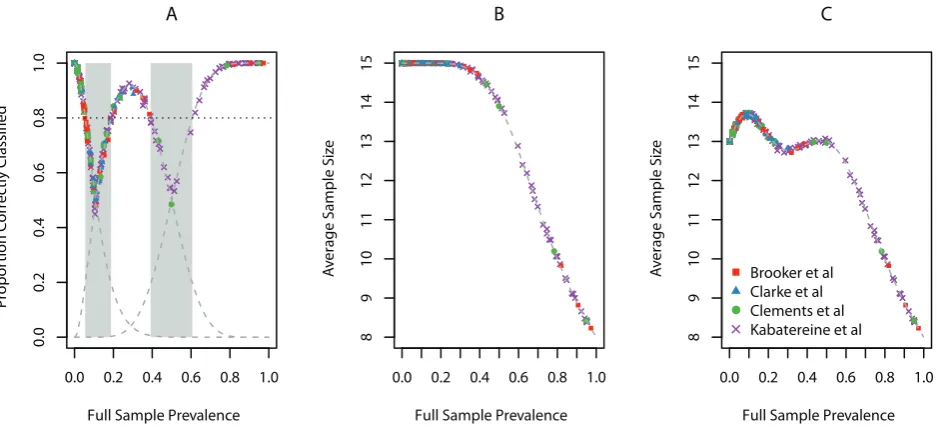
Figure 3A displays the average proportion of schools correctly classified as a function of the full sample prevalence. For expository purposes, we overlay the OC curve for this design, noting that the simulation results and expected curves coincide. Likewise, we display the average ASN under semi-curtailed
(Figure 3B) and curtailed (Figure 3C) sampling as a function of the full sample prevalence and overlay the expected ASN curves. Once again, these quantities coincide, as expected.
The results of our simulation study are presented in Table 1. The overall agreement between the MC-LQAS with a sample size of 15 and full sample classifications was 0.87 (IQR: 0.86–0.89). Although not everyone agrees on the interpretation of the kappa statistic, values greater than 0.60 are commonly interpretted as implying ‘‘substantial’’ agreement, whereas values greater than 0.80 are thought to imply ‘‘almost perfect’’ agreement. For three of the four studies, the agreement between the MC-LQAS and the full sample classifications was high (k.0.75) [27]. On average the use of the MC-LQAS procedure resulted in either substantial or almost perfect agreement with these data.
The notable exception was the Clarkeet alstudy from Kenya, where the kappa statistic was 0.46 (IQR: 0.34–0.58) whenn = 15. Of the four studies, the Clarke et al study had the fewest observations and fewest schools. Furthermore, of the 21 schools sampled in this study, 13 schools had full sample prevalence lying within one of the two grey regions where potential error is known
to be high (in comparison with 13 of 25, 20 of 143, and 49 of 199 in the Brooker, Clements, and Kabatereine studies, respectively). Thus, this MC-LQAS design is expected to be sub-optimal for this type of underlying distribution of prevalences. One might improve performance by increasing the sample size. The kappa statistics for all studies slightly increased when using a sample of size 25 (Table 1), although agreement in the Clarke study remained low with a kappa statistic of 0.52 (IQR: 0.39–0.62).
The ASN for a maximum sample size of n = 15 when utilizing curtailed and semi-curtailed sampling was 12.90 (IQR: 12.87– 12.94) and 14.50 (IQR: 14.49–14.52), respectively. When the maximum sample size was increased to n = 25, the ASN for curtailed and semi-curtailed sampling increased to 21.54 (IQR: 21.50–21.59) and 24.2 (24.14–24.18), respectively.
Discussion
This work outlines a unified and systematic approach to designing Multiple Category-LQAS classification systems with
application to the prevalence of S. mansoni in schoolchildren. Through simulation and using real data, we show it performs as well as existing methods in practice for classification of the prevalence of infection at a fraction of the sampling effort. Furthermore, for the first time in the public health literature, we have elucidated the theoretical properties of ‘‘sampling to the decision rule’’, or semi-curtailed sampling, in LQAS, and extended these notions to multiple classification. Our validation study shows that an MC-LQAS design withn = 15,d1= 1, andd2= 7provides classifications in near perfect agreement with the standard ‘‘binning’’ approach, yet using less than half as many observations. As expected, agreement between MC-LQAS and full sample classifications tends to be the worst for prevalences lying within the grey region (as found in the Clarke study), where the risks of classification error are high.
Our findings resonate with empirical results pointing to the reliability and potential cost-reduction associated with using LQAS for rapid assessment of S. mansoni [8]. Recent research suggests that an LQAS-based approach may also perform better
Figure 3. School-based simulation results.For simulation with n = 15, d1= 1, and d2= 7, (A) average proportion of correctly classified schools with expected Operating Characteristic curves overlaid (dashed grey), (B) Average Sample Number when utilizing semi-curtailed sampling with expected Average Sample Number overlaid (dashed grey), and (C) Average Sample Number when utilizing curtailed sampling with expected Average Sample Number overlaid (dashed grey).
doi:10.1371/journal.pntd.0001806.g003
Table 1.Kappa-statistic, Curtailed Average Sample Number, and Semi-curtailed Average Sample Number in four studies for two different MC-LQAS designs.
n = 15, d1= 1, d2= 7 n = 25, d1= 2, d2= 12
SS (#
Schools) k-statistic Curtailed ASN Semi-Curtailed ASN k-statistic Curtailed ASN Semi-Curtailed ASN
All Studies 25246 (388) 0.875 (0.864–0.885) 12.902 (12.871–12.936) 14.504 (14.487–14.523) 0.897 (0.888–0.907) 21.538 (21.486–21.593) 24.158 (24.137–24.180)
Brooker et al 1739 (25) 0.774 (0.723–0.830) 12.892 (12.760–13.040) 14.255 (14.200–14.320) 0.822 (0.780–0.874) 21.263 (21.000–21.520) 23.730 (23.640–23.800)
Clarke et al 1093 (21) 0.459 (0.341–0.576) 13.371 (13.190–13.571) 14.991 (15.000–15.000) 0.518 (0.394–0.615) 21.859 (21.524–22.202) 24.997 (25.000–25.000)
Clements et al 8617 (143) 0.763 (0.722–0.808) 13.119 (13.091–13.147) 14.909 (14.895–14.923) 0.808 (0.771–0.844) 22.100 (22.042–22.161) 24.847 (24.832–24.860)
Kabatereine et al
13797 (199) 0.901 (0.889–0.912) 12.698 (12.648–12.749) 14.196 (14.166–14.231) 0.920 (0.910–0.931) 21.139 (21.055–21.216) 23.631 (23.588–23.678)
Point estimates are mean and quantities in parentheses represent the inerquartile range over 1000 simulated datasets. doi:10.1371/journal.pntd.0001806.t001
than sophisiticated geostatistical modeling strategies with respect to correct classification, although at a higher cost per high prevalence school correctly classified [11]. Thus, while we have shown that MC-LQAS is a reliable tool for classification, investigators should continue to take care to choose the evaluative approach which best suits a given situation.
A limitation of this study is the lack of consideration for diagnostic sensitivity and specificity. The standard method for diagnosis ofS. mansoniis the Kato-Katz method, which has been criticized for having low sensitivity that varies depending on the intensity of infection in an individual [29,30]. Some studies have found sensitivities as low as 0.60, which is a serious violation of the perfect diagnostic test assumption. Methods for estimating the prevalence ofS. mansoniin the presense of variable sensitivity and infection intensity is an area of ongoing research [31].
A shortcoming of our study is that we ignore the underlying distribution of prevalence. In the event that prior information on the level or distribution of p is available, Olives and Pagano provide Bayesian methods for choosing the sample size and decision rule for traditional LQAS [32]. Olives discusses the same approach in the context of multiple classification in [33], providing the basis for incorporating complex disease dynamics into the model. Although ignoring prior information does not impact the viability of our results, it is expected that incorporating this extra information would improve expected performance.
A strength of our study is the principled treatment of curtailed and semi-curtailed sampling in LQAS. The ASN is a largely ignored piece of information that program managers can utilize to inform their choice of LQAS design. Note that curtailed sampling plans allow for early stopping with a classification of moderate prevalence, in addition to low and high. This is in contrast to other sequential LQAS designs used for multiple category classification in the literature, such as those used to classify transmitted HIV drug resistance [34]. In the context of the classification of S. mansoni prevalence, the use of curtailed designs will ultimately require fewer stool samples to be analyzed via microscopy. The reduction in sample size will be most pronounced in high prevalence schools, where as few as eight slides may need to be read before reaching a decision. Unfortunately in many cases, slides will be prepared for all participants and sent to the laboratory for microscopic inspection. Thus these savings are likely to be less pronounced in the field than in the laboratory. For other
diseases, such as malaria and urinary schistosomiasis, where rapid diagnositc tests and dipsticks (for haematuria) are the modes of diagnosis, the use of curtailed sampling may be of more importance in the field.
Further work is required to evaluate the use of MC-LQAS for sampling for several infections; for example the collection of stool samples to diagnose S. mansoni infection and urine samples to diagnoseS. haematobium, using either dipsticks for the detection of haematruia or the urine filatration technique. How such an integrated approach compares to the use of questionnaire surveys forS. haematobiumalso needs to be investigated.
LQAS as a tool has come to be associated with simplicity and versatility. MC-LQAS maintains these attributes so as to be useful to a wider audience of practitioners. Here we consider the case of
S. mansoni, and show that as a tool for classification of the prevalence of infection, MC-LQAS is both reliable and adapa-table. However, just as LQAS has had extensive use in multiple areas in health, we anticipate that this work will have implications reaching well beyond schistosomiasis for other infectious diseases, such as malaria. The design we describe allows for easy adaptation to other circumstances.
Supporting Information
Appendix S1 Derivations of ASN and preservation of OC curves under curtailed and semi-curtailed sampling for MC-LQAS.
(DOCX)
Acknowledgments
We thank Archie Clements, Alan Fenwick and Narcis Kabatereine for providing access to their data.
Author Contributions
Conceived and designed the experiments: CO JJV MP. Performed the experiments: CO MP. Analyzed the data: CO MP. Contributed reagents/ materials/analysis tools: CO SJB JJV MP. Wrote the paper: CO SJB JJV MP. Responsible for the primary statistical development of methods and implementation: CO. Provided technical support and advisement of statistical development: MP. Provided data and expert advisement for application to schistosomiasis: SJB. Provided context and expert advise-ment for LQAS design and impleadvise-mentation: JJV.
References
1. Lustigman S, Prichard RK, Gazzinelli A, Grant WN, Boatin BA, et al. (2012) A Research Agenda for Helminth Diseases of Humans: The Problem of Helminthiases. PLoS Negl Trop Dis 6: e1582.
2. Steinmann P, Keiser J, Bos R, Tanner M, Utzinger J (2006) Schistosomiasis and water resources development: systematic review, meta-analysis, and estimates of people at risk. Lancet Infect Dis 6: 411–25.
3. Utzinger J, Bergquist R, Shu-Hua X, Singer BH, Tanner M (2003) Sustainable schistosomiasis control–the way forward. Lancet 362: 1932–1934.
4. WHO Expert Committee (2002) Prevention and control of schistosomiasis and soil-transmitted helminthiasis. World Health Organ Tech Rep Ser 912: i–vi, 1– 57, back cover.
5. WHO (2006) Preventive chemotherapy in human helminthiasis. Coordinated use of antihelminthic drugs in control interventions: a manual for health professionals and programme managers. Geneva: WHO.
6. Bennett S, Wood S, Liyanage WM, Smith DL (1991) A simplified method for cluster-sampling surveys of health in the developing world. World Health Statistics Quarterly 44: 98–106.
7. Montresor A, Crompton DWT, Bundy DAP, Hall A, Savioli L (1998) Guidelines for the Evaluation of Soil-transmitted helminthiasis and schistoso-miasis at the community level. WHO.
8. Brooker S, Kabatereine NB, Myatt M, Stothard JR, Fenwick A (2005) Rapid assessment ofSchistosoma mansoni: the validity, applicability and cost-effectiveness of the Lot Quality Assurance Sampling method in Uganda. Trop Med Int Health 10: 647–658.
9. WHO (1995) The schistosomiasis manual. Geneva.
10. Brooker S, Kabatereine NB, Gyapong JO, Stothard JR, Utzinger J (2009) Rapid mapping of schistosomiasis and other neglected tropical diseases in the context of integrated control programmes in Africa. Parasitology 136: 1707–1718. 11. Sturrock HJW, Gething PW, Ashton R, Kolaczinski JH, Kabateriene NB, et al
(2011) Planning schistosomiasis control: investigation of alternative sampling strategies for Schistosoma mansoni to target mass drug administration of praziquantel in East Africa. International Health 3: 165–175.
12. Robertson SE, Valadez JJ (2006) Global review of health care surveys using Lot Quality Assurance Sampling (LQAS), 1984–2004. Soc Sci Med 63: 1648– 1660.
13. Dodge HF, Romig HG (1944) Sampling Inspection Tables: Single and Double Sampling. New York: John Wiley & Sons.
14. Rabarijaona LP, Andriamaroson BJ, Ravaoalimalala VE, Ravoniarimbinina P, Migliani R (2001) Identification of communities endemic for urinary bilharziosis by the ‘‘Lot Quality Assurance Sampling’’ method in Madagascar. Arch Inst Pasteur Madagascar 67: 41–45.
15. Rabarijaona LP, Boisier P, Ravaoalimalala VE, Jeanne I, Roux JF, et al. (2003) Lot Quality Assurance Sampling for screening communities hyperendemic for Schistosoma mansoni. Trop Med Int Health 8: 322–328.
16. Myatt M, Limburg H, Minassian D, Katyola D (2003) Field trial of applicability of Lot Quality Assurance Sampling survey method for rapid assessment of prevalence of active trachoma. Bull World Health Organ 81: 877–885. 17. Greenland K, Rondy M, Chevez A, Sadozai N, Gasasira A, et al. (2011)
18. Pezzoli L, Tchio R, Dzossa AD, Ndjomo S, Takeu A, et al. (2011) Clustered lot quality assurance sampling: a tool to monitor immunization coverage rapidly during a national yellow fever and polio vaccination campaign in Cameroon, May 2009. Epidemiol Infect: 1–13.
19. Clarke SE, Jukes MCH, Njagi JK, Khasakhala L, Cundill B, et al. (2008) Effect of intermittent preventive treatment of malaria on health and education in schoolchildren: a cluster-randomised, double-blind, placebo-controlled trial. Lancet 372: 127–138.
20. Clements ACA, Lwambo NJS, Blair L, Nyandindi U, Kaatano G, et al. (2006) Bayesian spatial analysis and disease mapping: tools to enhance planning and implementation of a schistosomiasis control programme in Tanzania. Trop Med Int Health 11: 490–503.
21. Brooker S, Miguel EA, Waswa P, Namunyu R, Moulin S, et al. (2001) The potential of rapid screening methods forSchistosoma mansoniin western Kenya. Ann Trop Med Parasitol 95: 343–351.
22. Valadez JJ (1991) Assessing child survival programs in developing countries: testing Lot Quality Assurance Sampling. Cambridge: Harvard University Press. 23. Cohen AC (1970) Curtailed attribute sampling. Technometrics 12: 295–298. 24. Girshick MA, Mosteller F, Savage LJ (1946) Unbiased estimates for certain
sampling problems with applications. Ann Math Stat 17: 13–23.
25. Patil GP (1963) Note on the equivalence of the binomial and inverse binomial acceptance plans and acknowledgement. Technometrics 5: 119–121.
26. Kabatereine NB, Brooker S, Tukahebwa EM, Kazibwe F, Onapa AW (2004) Epidemiology and geography ofSchistosoma mansoniin Uganda: implications for planning control. Trop Med Int Health 9: 372–380.
27. Cohen J (1968) Weighted kappa: nominal scale agreement with provision for scaled disagreement or partial credit. Psychol Bull 70: 213–220.
28. R Development Core Team (2010) R: A Language and Environment for Statistical Computing. Vienna, Austria: R Foundation for Statistical Computing. ISBN 3-900051-07-0, http://www.R-project.org/.
29. Bergquist R, Johansen MV, Utzinger J (2009) Diagnostic dilemma in helminthology: what tools to use and when. Trends Parasitol 25: 151–156. 30. Vlas SJD, Engels D, Rabello AL, Oostburg BF, Lieshout LV, et al. (1997)
Validation of a chart to estimate trueSchistosoma mansoniprevalences from simple egg counts. Parasitology 114 (Pt 2): 113–121.
31. Mitchell S, Pagano M (2012) Pooled Testing for Effective Estimation of the Prevalence ofSchistosoma mansoni. Am J Trop Med Hyg: Conditionally Accepted for Publication.
32. Olives C, Pagano M (2010) Bayes-LQAS: classifying the prevalence of global acute malnutrition. Emerg Themes Epidemiol 7: 3.
33. Olives C (2010) Improving LQAS for monitoring and evaluation of health programs in resource-poor settings. Harvard University.
34. Myatt M, Bennett DE (2008) A novel sequential sampling technique for the surveillance of transmitted HIV drug resistance by cross-sectional survey for use in low resource settings. Antivir Ther 13 Suppl 2: 37–48.