Volume 2007, Article ID 64102,20pages doi:10.1155/2007/64102
Research Article
A Comprehensive Noise Robust Speech Parameterization
Algorithm Using Wavelet Packet Decomposition-Based
Denoising and Speech Feature Representation Techniques
Bojan Kotnik and Zdravko Kaˇciˇc
Faculty of Electrical Engineering and Computer Science, University of Maribor, Smetanova ul. 17, 2000 Maribor, Slovenia
Received 22 May 2006; Revised 12 January 2007; Accepted 11 April 2007
Recommended by Matti Karjalainen
This paper concerns the problem of automatic speech recognition in noise-intense and adverse environments. The main goal of the proposed work is the definition, implementation, and evaluation of a novel noise robust speech signal parameterization algo-rithm. The proposed procedure is based on time-frequency speech signal representation using wavelet packet decomposition. A new modified soft thresholding algorithm based on time-frequency adaptive threshold determination was developed to efficiently reduce the level of additive noise in the input noisy speech signal. A two-stage Gaussian mixture model (GMM)-based classifier was developed to perform speech/nonspeech as well as voiced/unvoiced classification. The adaptive topology of the wavelet packet decomposition tree based on voiced/unvoiced detection was introduced to separately analyze voiced and unvoiced segments of the speech signal. The main feature vector consists of a combination of log-root compressed wavelet packet parameters, and autore-gressive parameters. The final output feature vector is produced using a two-staged feature vector postprocessing procedure. In the experimental framework, the noisy speech databases Aurora 2 and Aurora 3 were applied together with corresponding standard-ized acoustical model training/testing procedures. The automatic speech recognition performance achieved using the proposed noise robust speech parameterization procedure was compared to the standardized mel-frequency cepstral coefficient (MFCC) feature extraction procedures ETSI ES 201 108 and ETSI ES 202 050.
Copyright © 2007 B. Kotnik and Z. Kaˇciˇc. This is an open access article distributed under the Creative Commons Attribution License, which permits unrestricted use, distribution, and reproduction in any medium, provided the original work is properly cited.
1. INTRODUCTION
Automatic speech recognition (ASR) systems have become indispensable integral parts of modern multimodal man-machine communication dialog applications such as voice-driven service portals, speech interfaces in automotive nav-igational and guidance systems, or speech-driven applica-tions in modern offices [1]. As automatic speech recogni-tion systems are evolurecogni-tionally moving from controlled lab-oratory environments to more acoustically dynamic places, noise robustness criteria must be assured in order to main-tain speech recognition accuracy above a sufficient level. If a recognition system is to be used in noisy environments it must be robust to many different types and levels of noise, categorized as either additive/convolutive noises, or changes in the speaker’s voice due to environmental noise (Lom-bard’s effect) [1,2]. Two large groups of noise robust tech-niques are commonly used in modern automatic speech
strategies are necessary to implement a frame-dropping prin-ciple and to discard noise-only frames, (4) effective feature postprocessing algorithms should be applied to transform feature vectors to the lower-dimensional space, to decorre-late elements in feature vectors, and to enhance the accuracy of the classification process.
This article presents a novel noise robust speech param-eterization algorithm, shortly denoted as WPDAM, using joint wavelet packet decomposition and autoregressive mod-eling. The proposed noise robust front-end procedure pro-duces solutions for all the four noise robust speech param-eterization issues mentioned above and should, therefore, achieve better automatic speech recognition performance in comparison with the standardized mel-frequency cepstral coefficient (MFCC) feature extraction procedure [5,6].
MFCCs [7], derived on the basis of short time Fourier transform (STFT) and power spectrum estimation, have been used to date as fundamental speech features in almost every state-of-the-art speech recognition system. Neverthe-less, many authors have reported on the drawbacks of the MFCC speech parameterization technique [1, 8–12]. The windowed STFT was one of the first transforms to provide temporal information about the frequency content of sig-nals [13,14]. The STFT-based approach has, due to con-stant analysis window length (typically 20–32 milliseconds), fixed time-frequency resolution and is, therefore, not op-timized to simultaneously analyze the nonstationary and quasi-stationary parts of a speech signal with the same ac-curateness [15–18].
Speech is a highly dynamic process. A multiresolutional approach is needed in order to achieve reliable representa-tion of the speech signal in the time-frequency plane. In-stead of using fixed-resolution STFT, a wavelet transform can be used to efficiently represent the speech signal in the time-frequency plane [17,18]. Wavelet transform (WT) has become a popular tool in many research domains. It de-composes data into a sparse, multiscale representation. The wavelet transform, with its flexible time-frequency resolu-tion is, therefore, an appropriate tool for the analysis of sig-nals having both short high-frequency bursts and long quasi-stationary components [19].
Examples of WT usage in the feature extraction process can be found in [8,10,20]. The wavelet packet decomposi-tion tree (WPD), which tries to mimic the filters arranged in the Mel scale, in a similar fashion to that achieved by the MFCC has already been used in [21]. It is shown that the usage of WPD prior to the feature extraction stage leads to a performance improvement in the automatic speaker identifi-cation system [9,21] or automatic speech recognition system when compared to the baseline MFCC system [9]. Optimal structure for the WPD tree using an entropy based measure has been proposed [15,22] in the research area of signal cod-ing. It has been shown that entropy based optimal coding provides compact coding of the signals, while losing a mini-mum of the useful information [23].
Different denoising strategies based on speech signal rep-resentation using wavelets can be found in literature [18,19,
21,24–27]. One of the objectives of the proposed noise
ro-bust speech parameterization procedure is also the develop-ment of a computationally efficient improved alternative— a denoising algorithm based on modified soft threshold-ing strategy with the application of time-frequency adaptive threshold and adaptive thresholding strength.
The rest of this article is organized as follows: Sections
2–9 provide, together with its subsections, a detailed de-scription of all processing steps applied in the proposed noise robust feature extraction algorithm WPDAM. The au-tomatic speech recognition performance of the proposed al-gorithm is evaluated using Aurora 2 [28–30] and Aurora 3 [31–34] databases and compared to the ETSI ES 201 108 and ETSI ES 202 050 standard feature extraction algorithms [5,30,35].Section 10gives a description of the performed experiments, corresponding results and discussions. The per-formance comparison to other complex front ends, as well as the computational requirements will also be provided. Fi-nally,Section 11concludes the paper.
2. DEFINITION OF PROPOSED ALGORITHM WPDAM
Input speech signal Framing of the input speech signal High-pass filtering procedure
Speech signal preemphasis Wavelet packet decomposition
(7 levels) Noise estimation +
preliminary additive noise reduction on level 5 of the WPD Reconstruction of denoised speech
signal Autoregressive modeling Computation of LPCC parameters
Speech/non-speech classifier feature vector
Classifier GMM 1
GMM model:“speech” GMM model:“nonspeech”
Smoothing and comparing of output probabilities
Classification result:G[m] Inverse AR filtering procedure
Cumulantsγ3andγ4for voicedness parameterϑestimation
Voiced/unvoiced classifier feature vector
Classifier GMM 2 GMM model:“voiced”
GMM model:“unvoiced”
Smoothing and comparing of output probabilities
Classification result:Z[m]
Determination of the adaptive parameters for thresholding Application of modified soft
thresholding Wavelet packet tree adaptation
procedure Wavelet packet decomposition parameters
Root-log compression characteristic
Primary feature vector based on AR and “root-log” compressed wavelet packet parameters
First and second order derivatives Statistical reduction of acoustical mismatch
Liner discriminant analysis Final output feature vector
Classification result:
G[m]
Classification result:
Z[m]
Estimation of the LDA transformation matrix
LDA matrix
Figure1: Block diagram of proposed noise robust speech parameterization algorithm WPDAM.
statistical classification. The only difference is a modification of the input feature vector, which is constructed from autore-gressive parameters with an added special voiced/unvoiced feature. The voicing feature is represented by the ratio of the higher-order cumulants of the LPC residual signal. The main wavelet-based denoising procedure uses a more advanced time-frequency adaptive threshold determination procedure. The speech/nonspeech decision and principles of minimum statistics are also used. Once the threshold is determined, the thresholding process is performed. The two modified soft thresholding characteristics are introduced: piecewise lin-ear modified soft thresholding (preliminary denoising) and smoothed modified soft thresholding characteristic (primary speech signal denoising).
The primary features are represented by the wavelet packet decomposition parameters of the denoised input speech signal. The parameters are estimated on the basis of the wavelet packet decomposition tree’s adaptive topology, using voiced-unvoiced decision. The wavelet packet param-eters are compressed using the proposed combined root-log compression characteristics. The primary feature vector con-sists of a combination of compressed wavelet packet param-eters, and of autoregressive parameters. The global frame en-ergy of the denoised input speech signal is also added, as the last element of the primary feature vector. Next, the dynamic features—the first- and second-order derivatives of the
stat-ical elements—are also added to the final feature vector. The first step in the feature vector postprocessing consists of a procedure for the statistical reduction of the acoustical mis-match between the training and testing conditions. The final output feature vector is computed using linear discriminant analysis (LDA).
The proposed noise-robust feature extraction proce-dure consists of training and testing phases. In the training phase, the statistical GMM models (speech/nonspeech and voiced/unvoiced GMMs), the parameters for statistical mis-match reduction, and LDA transformation matrix need to be estimated before the actual usage of the proposed algorithm in the feature extraction process.
3. INPUT SPEECH SIGNAL PREPROCESSING
PROCEDURE
speech signal does not contain useful information in the fre-quency band from 0 to 70 Hz and, therefore, the frefre-quency content in that band can be strongly attenuated. A Chebby-shev infinite impulse response (IIR) filter of type 1 was con-structed in order to achieve a fast transit from the stop to passband of the proposed low-order highpass filter. The pro-posed filter has a passband ripple of, at most, 0.01 dB.
The perceptual loudness of the human auditory system depends on the frequency contents of the input sound wave. It is commonly known that the unvoiced sounds contain less energy than the voiced segments of speech signals [2]. How-ever, the correct and accurate detection and classification of unvoiced phonemes is also of crucial importance when achieving the highest automatic speech recognition results [1,20]. Therefore, speech pre-emphasis techniques were in-troduced to improve the acoustic modeling and classifica-tion process of the unvoiced speech signal segments [13,14]. The MFCC standardized feature extraction procedure ETSI ES 201 108 [5] uses the first-order pre-emphasis filter, as de-scribed in the transfer functionHP(z)=1−αz−1. A new
pre-emphasis filter HPREEMPH(z) is proposed for the presented
WPDAM. The proposed pre-emphasis filter does not mod-ify the frequency content of the input signal in the frequency region from 0 to 1 kHz. For the frequencies from 1 kHz up to 4 kHz (the sampling frequency of fS =8 kHz is presumed) the amplification of the input speech signal is progressively increased and achieves its maximum at 3.52 dB, at a fre-quency of 4 kHz.
4. WPD-BASED SPEECH SIGNAL
DENOISING PROCEDURE
The environmental noises surrounding the user of the voice-driven applications represent the main obstacle to achieve a higher degree of automatic speech recognition accuracy [1,24, 36–39]. Modern automatic speech recognition sys-tems are based on a statistical approach using hidden Markov models and, therefore, their efficiency depends on the de-gree of acoustical match between training and testing envi-ronments [1,14]. If the training of acoustical models is per-formed using studio-quality speech with the highest SNR, and if, in practical usage, the input speech signal is cap-tured in a low SNR environment (interior of driven car on the highway, e.g.), then a significant degradation of the speech recognition performance is to be expected. However, it should be noted that increased SNR does not lead always to the improvements in the ASR performance. Therefore, the main goal of presented additive noise reduction principles is the reduction of acoustic mismatch between the training and testing environments [1].
4.1. Definition of the WPD applied in the proposed denoising procedure
Discrete-time implementation of the wavelet transform is defined as the iteration of the two-channel filterbank, fol-lowed by a decimation-by-two unit [16–18]. Unlike the dis-crete wavelet transform (DWT), which is obtained by
iterat-REMEZ32 - frequency response of the lowpass decomposition filter
−80
−60
−40
−20
0 20
M
ag
nitude
(dB)
0 0.1 0.2 0.3 0.4 0.5 0.6 0.7 0.8 0.9 1
Normalized frequency (×πrad/sample)
(a)
REMEZ32 - frequency response of the lowpass decomposition filter
−2000
−1500
−1000
−500
0
Phase
(deg)
0 0.1 0.2 0.3 0.4 0.5 0.6 0.7 0.8 0.9 1
Normalized frequency (×πrad/sample)
(b)
Figure2: Frequency response of the REMEZ32.
ing on the lowpass branch only, the filterbank tree can be iterated on either branch at any level, resulting in a tree-structured filterbank called a wavelet packet filterbank tree [18]. In the proposed noise robust feature extraction WP-DAM, aJ-level WPD algorithm is applied to decompose the high-pass filtered and pre-emphasized signaly[n,m], where nandmare the sample and the frame indexes, respectively.
−0.5 −0.4 −0.3 −0.2 −0.1 0
0.1
0.2
0.3
0.4
0.5
Amp
li
tu
d
e
10 20 30 40 50 60 70 80 90
Time (samples)
Mother wavelet corresponding to REMEZ32
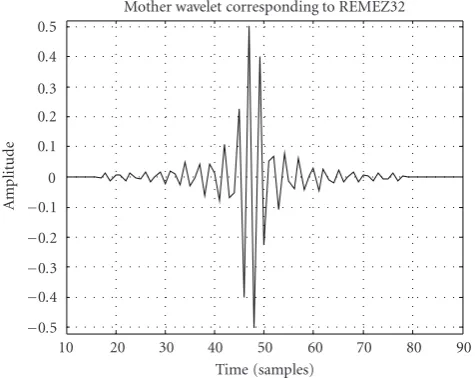
Figure3: Wavelet function REMEZ32.
0 500 1000 1500 2000 2500 3000 3500 4000
Frequ
enc
y
(H
z)
0 0.2 0.4 0.6 0.8 1 1.2 1.4 1.6 1.8 2
Time (s)
G[m]=1 G[m]=1
Figure4: Time-frequency representation of speech signal with de-noted voice activity detection borders.
4.2. The definition of proposed time-frequency adaptive threshold
The main goal of the proposed WPD-based noise reduc-tion scheme is achievement of the strongest possible signal-to-noise ratio (SNR) improvement at lowest additional sig-nal distortion [21,25,27,36,42]. The compromising solu-tion is achievable only with accurate time-frequency adap-tive threshold estimation procedure, and with definition of efficient thresholding algorithm.
Figure 4shows a speech signal spectrogram with added voice activity decision borders. It is evident from this spec-trogram that, even in the speech region (G[m]=1), not all of the frequency regions contain useful speech information. Therefore, it can be speculated that the noise spectrum can
be effectively estimated not only in the pure-noise regions (G[m]=0) but also inside the speech regions (G[m]=1). The main principles of this minimum statistics approach [38] will be used in the development of the proposed thresh-old determination procedure. The presented noise reduction procedure only operates on output nodes of the lowest level of the wavelet packet decomposition tree, which is defined here by j = 7. The adaptive threshold Tkj[m] determina-tion method is performed as follows. For each framemof the input speech signaly[m,n], the Donoho’s [25] threshold DTkj[m] is computed at every outputkof the lowest wavelet packet decomposition levelj:
DTkj[m]=σkj[m]
2 logNkj,
whereσkj[m]=γ 1 MAD
MedianWkjx[m,n]. (1)
When the SNR of the input noisy speech signal y[n] is rel-atively low (SNR< 5 dB), high inter-frame fluctuations in the threshold value result in additional distortion of the de-noised speech signal, which are similar to musical noises— artefacts known in spectral subtraction algorithms [19,36,
38]. These abrupt changes in inter-frame threshold values can be reduced using the following first-order autoregressive-smoothing scheme:
DTkj[m]=(1−δ) DTkj[m] +δDTkj[m−1], (2)
where the smoothing factorδhas a typical value from the in-terval (0.9, 1.0]. The final time-frequency adaptive threshold Tkj[m] is produced using the smoothed Donoho’s threshold DTkj[m], and voice activity decisionG[m] as follows.
(i) If the current framemdoes not contain useful speech information (G[m] = 0), then the proposed time-frequency adaptive thresholdTkj[m] is equivalent to the value of the smoothed Donoho’s threshold
Tkj[m]=DTkj[m], ifG[m]=0. (3)
(ii) If the current framemcorresponds to the speech seg-mentS of the input signal (G[m] = 1 andm ∈ S), then the threshold Tkj[m] is determined using the minimum-statistic principle: inside the speech seg-mentS, the intervalI of the length ofDframes is se-lected, whereI=[m−D/2,m+D/2], andI⊆S. For the framem, wavelet packet decomposition levelj, and nodek, the thresholdTkj[m] corresponds to the
min-imal smoothed Donoho’s threshold value DTkj[m], wheremruns over all values from the intervalI:
Tkj[m]=Min m∈I
DTkj[m],
whereI=
m−D 2,m+
D 2
, I⊆S.
The proposed time-frequency adaptive threshold Tkj[m] is used, together with the proposed modified soft thresholding algorithm (presented in the following subsection), to reduce the level of additive noise in the input noisy speech signal y[n,m].
4.3. Modified soft thresholding algorithm
The selection of the thresholding characteristics has strong impact on the quality of the denoised output speech sig-nal [25,27]. Detailed analysis of well-known hard and soft thresholding techniques showed that there are two main rea-sons why the distortion of the denoised output speech sig-nal occurs [21]. The first reason is the strong discontinuity of the input-output thresholding characteristics, and the sec-ond reason is setting to zero those coefficients, the absolute values of which are below the threshold. Most of the speech signal’s energy is concentrated at lower frequencies (voiced sounds), whereas the unvoiced low-energy segments of the speech signal are mainly located at higher frequencies [2,43]. The wavelet coefficients of the unvoiced speech are, due to its lower amplitude, more masked by surrounding noise and, therefore, they are easily attenuated by inappropriate thresh-olding operations such as hard or even soft threshthresh-olding [27]. In the proposed smoothed modified soft thresholding tech-nique, special attention is dedicated to unvoiced regions in-side the speech signal and, therefore, those wavelet coeffi -cients, the absolute values of which lie below the threshold value, are treated with special care. The proposed smoothed modified soft thresholding function has a smooth, nonlinear attenuating shape for the wavelet packet coefficients, the ab-solute values of which lie below the threshold. The smoothed modified soft thresholding function is defined by the follow-ing equation:
IFWx[n]> Tkj, THEN Ws[n]=Wx[n] ELSE
Ws[n]=Tj k
signWx[n]1 ρkj
1+ρkj|W(x[n])|/T
j k−1 .
(5)
For greater readability, the frame indexmwas discarded from the equation above. The adaptive parameter ρkj[m] in (5) defines the shape of the attenuation characteristic for the wavelet packet coefficients, the absolute values of which lie below the thresholdTkj[m]. The adaptive parameterρkj[m] is determined as follows:
ρkj[m]=θmaxWkj
x[m,n]
Tkj[m] . (6)
The global constantθis estimated on the basis of an analysis of the minimum mean square error (MMSE)e[n] between the clean speech signals[n] and the estimated clean speech signals[n]:e[n]=s[n]−s[n]. The clean speech signal must be known in order to estimate the parameterθ. Therefore,
−1000 −800 −600 −400 −200 0 200 400 600 800 1000
Output
seq
u
enc
e
W
(x
[
m
,
n
])
T=400
−1000−800−600−400−200 0 200 400 600 800 1000
Input sequenceW(x[m,n])
Input-output characteristics of the smoothed modified soft thresholding
r=30
r=600
Figure5: Two smoothed modified soft thresholding transfer char-acteristics.
the speech database Aurora 2 [29] was applied inρkj[m] es-timation procedure, where the time-aligned clean and noisy signals of the same utterance are available. As evident from (6), the attenuation factorρkj[m] depends on the threshold valueTkj[m], as well as on the maximum absolute value of the wavelet coefficient found in the wavelet packet coefficient sequenceWkj(x[m,n]). By applying the presented smoothed modified soft thresholding operation, better quality of out-put denoised speech is expected especially in unvoiced re-gions, as in the cases of classical hard and soft threshold-ing techniques. The illustrative diagram inFigure 5 repre-sents the two smoothed modified soft thresholding charac-teristics at two different values for adaptive parameterρkj[m]: ρkj[m] = 30 andρkj[m] = 600. At lower values for the pa-rameter ρkj[m], the attenuation of wavelet coefficients be-comes less aggressive and, therefore, those wavelet coeffi -cients with absolute values below the threshold are better preserved. Therefore, the information contained in lower-valued coefficients (probably in unvoiced regions) is retained better. In order to make the following steps possible, a partial reconstruction of the denoised signal is needed. Namely, in
Section 6the adaptive topology of the wavelet packet decom-position tree will be utilized. Therefore, the denoised speech signal up to the level j = 4 has to be reconstructed using already mentioned REMEZ32 reconstruction filter.
5. SPEECH ACTIVITY AND VOICED/UNVOICED
DETECTION
Preprocessed input speech signal
Voice activity detection feature vector (10)
GMM 1
No Yes
log(Probspeech)>log(Probnonspeech)?
GMM classifier “speech/nonspeech”
Current frame contains noise/sil
Voicedness detection feature vector (11)
GMM 2
No Yes
log(Probvoiced)>log(Probunvoiced)?
GMM classifier “voiced/unvoiced”
Current frame is unvoiced Current frame is voiced
Current frame contains speech 0
0.2 0.4 0.6 0.8 1
−256 0 256
0 0.2 0.4 0.6 0.8 1
−256 0 256
Figure6: Two-stage GMM-based statistical classification procedure.
speaker and speaking style independence, low computa-tional and memory requirements, high operating speed (at least real-time operation), and reliable operation without a-priori knowledge about the environmental-noise character-istics [1,28,44–46]. The most problematic requirement of the VAD algorithm is robustness to different noises, SNRs, and adaptation of the VAD parameters to changing environ-mental characteristics [1,44,47]. The computationally most efficient VAD algorithms are based on signal energy estima-tion principles, zero crossing computaestima-tion, or the LPC resid-ual signal analysis [44–46]. Due to the strong dynamics of the energy levels in the speech signal, and due to the difficult determination of the speech/nonspeech decision threshold, a new statistical-model-based voice activity detection strat-egy, slightly similar to the approach in [48], is applied in the proposed algorithm. In the first step, a preliminary additive noise reduction procedure is performed at the level j = 5 of the wavelet packet decomposition tree. Then, a denoised speech signal is reconstructed using wavelet packet recon-struction. In the second step, the VAD features are extracted and the two-stage statistical classifier is applied. In the first stage of the statistical classification, each framemof the input signal is declared as speech or nonspeech. In the second stage, each speech frame is further declared as voiced or unvoiced. For voiced/unvoiced detection, a slightly modified feature vector is applied, as in the case of speech/nonspeech detec-tion. The two statistical classifiers used in speech/nonspeech and voiced/unvoiced detections are based on Gaussian mix-ture models (GMM) [49]. The speech/nonspeech decision is used in the proposed primary noise reduction procedure. The voice/unvoiced decision is used in the adaptation pro-cess of the wavelet packet decomposition tree to extract the
wavelet packet speech parameters. Under the presumption that energy-independent features are selected in the VAD procedure, the proposed VAD algorithm is robust against high variation of the input speech signal’s energy. Further-more, as GMM models are trained using speech data from many speakers, the proposed GMM-based voice activity de-tection procedure is robust against the speaker variability (speaking style, gender, age, etc.).
5.1. Feature vector definitions for speech activity and voicing detection
To achieve successful detection of speech frames in the input noisy speech signal using statistical classifier, dis-criminative features must be chosen, which enable good speech/nonspeech discrimination. The human speech pro-duction process can be mathematically well described by the usage of lower-dimensional autoregressive modeling [1, 2,
16]. Therefore, in the proposed statistical speech/nonspeech classification process, a feature vector composed of 10 lin-ear predictive cepstral coefficients (LPCC) will be applied. These 10 LPCC coefficients will be computed using an au-toregressive model of the order 12 [12, 50, 51]. In the voiced/unvoiced classification procedure, another voicing feature will be added to the proposed feature vector of 10 LPCC elements, composed only of a feature vector of 11 ele-ments.
reconstructed. The 12-order autoregressive modeling is ap-plied and 10 LPCC features are extracted for each framemof the input speech signal. The vector of 10 LPCC elements is used in the speech/nonspeech classification procedure. The following paragraph describes the definition of the proposed voicing parameterϑ, used as the 11th feature element in the feature vector for the voiced/unvoiced classification process.
An analytical sinusoidal model of speech signal produc-tion was presented in [46]. The analytical model of speech signal can be simplified into the following notation:
s[n]= Q
q=1
Aqcosn−n0
q f0+ϕq, (7)
wheren0represents the speech onset time,Qis the number
of harmonically related sinusoids with amplitudes ofAqand with phases ϕq. The fundamental frequency of the speech is denoted by f0. The LPC residual error signal, denoted by e[n], can be defined, using the followingP-order inverse au-toregressive (AR) filter:
e[n]=s[n] + P
i=1
ais[n−i], (8)
wheren =0, 1,. . .,N−1 ands[n]=0 ifn <0. The num-ber of samples in the current frame is represented byN, and npresents the sample index in the framem. On the basis of a simplified sinusoidal model of the speech signal, the fol-lowing properties can be observed [46]: (1) the LPC residual signal of the stationary voiced speech is a deterministic sig-nal, composed ofQsinusoids with equal amplitudesAq, and harmonically related frequencies, (2) the LPC residual sig-nal of the unvoiced speech can be represented as a harmonic process composed ofQsinusoids with randomly distributed phasesϕq.
The LPC residual signal of the noise with Gaussian dis-tribution has the properties of the white Gaussian noise [46]. This important property of the LPC residual signal is used together with the well-known properties of higher-order cu-mulants. Namely, the cumulants of order cgreater than 2 (c >2) are equal to zero for the white Gaussian process [46]. In other words, higher-order cumulants are immune to white Gaussian noise. The primarily used higher-order cumulants are of the third orderγ3(skewness) and fourth order
(kurto-sis)γ4cumulants, which are determined using the following
notation:
γ3=E
e3[n]= 1 N
N−1
n=0
e[n]3,
γ4=E
e4[n]−3Ee2[n]2
=N1 N−1
n=0
e[n]4−3
1 N
N−1
n=0
e[n]2
2 .
(9)
It was shown in [46], that the skewnessγ3, and the
kurto-sisγ4of the LPC residual signal depend only on the number
of harmonically related components, and on the energy of
the analyzed signals[n]. The signal’s energy influence on the voiced/unvoiced classification should be discarded. There-fore, the voicing parameterϑwill be defined as an energy-eliminating ratio between the third (skewness) and fourth (kurtosis) order cumulants, which depend only on the num-ber of harmonicsQin the analyzed speech signal [46]:
ϑ= γ23 γ3/2
4
= 9(Q−1)2
8Q(4/3)Q−4 + 7/6Q3/2. (10)
The above equation has a drawback, namely that it can be-come undetermined if the number of harmonicsQin the in-put signal is zero (Q=0): this is the case when there is only a white Gaussian noise or unvoiced speech signal on the input. This condition rarely occurs due to variations in the cumu-lant estimates. Nevertheless, in the computation procedure, the following limitation is taken into account: ifQ=0, then the voicing parameterϑ = 0. The number of harmonicsQ is computed by counting the local maxima of the LPC-based spectrum.
5.2. Statistical classifier for speech activity and voicing detection
A two-stage statistical classifier is applied in the proposed noise robust speech parameterization algorithm to per-form speech/nonspeech and voiced/unvoiced classifications.
Figure 6shows a block diagram of the proposed two-stage statistical classifier. In the first stage, speech/nonspeech de-tection is performed for each frame mof the input signal. Then, in the second stage, each previously detected speech frame is further classified as voiced or unvoiced. The two sta-tistical classifiers are based on the Gaussian mixture model-ing (GMM) of input data. Durmodel-ing the trainmodel-ing phase, sep-arate estimations of the speech and nonspeech frames were performed using the training part of the speech database. Similarly, the voiced and unvoiced GMM models were esti-mated. These four GMM models were then used to classify data from each new input signal frame. It was discovered that the usage of 32 continuous density Gaussian mixtures re-sulted in the best classification results. The training of GMM models was performed using the tools HInit (initial GMM parameter estimation using Viterbi algorithm), and HRest (implementation of the Baum-Welch iterative training pro-cedure to find the optimal parameters of the GMM model with respect to the given input training data set), which are part of the HTK toolkit [49]. In the test phase, for each frame of the input signal, the emission probabilities of the corre-sponding GMM models are computed using the input fea-ture vector. For example, if the voice activity detection of the framemis performed, the speech and nonspeech GMM models are evaluated using the input LPCC feature vector of the framem. As a result, two output log probabilities (called also emission probabilities in HMM-based ASR systems) are computed: log(ProbSPEECH[m]) and log(ProbNONSPEECH[m]).
• First stage: voice activity detectionG[m]: ∀m,wheremis the input signal frame:
IF:log(ProbSPEECH[m])>log(ProbNONSPEECH[m])
THEN:G[m]=1,the framemcontains speech ELSE:G[m]=0,the framemdoes not contain speech
• Second stage: voiced/unvoiced detectionZ[m]: Under conditionG[m]=1:
IF:log(ProbVOICED[m])>log(ProbUNVOICED[m])
THEN:Z[m]=1,the framemcontains voiced speech ELSE:Z[m]=0,the framemcontains unvoiced speech
Algorithm1
two log probabilities are computed: log(ProbVOICED[m]) and
log(ProbUNVOICED[m]). The final binary classification results, G[m] andZ[m] are determined inAlgorithm 1.
As evident, there is no need to define some special dis-tance measure for speech/nonspeech and voicing classifica-tion: the two output probabilities of the GMM models are just simply compared to each other. Short pauses can often appear inside the spoken words in some cases. These short pauses usually appear before or after the stop phonemes, and can be misclassified as nonspeech segments. These misclas-sifications can decrease the performance of the automatic speech recognition system. To reduce the influence of possi-ble fluctuations in the VAD output decision, the GMM emis-sion log-probabilities log(ProbX[m]) are smoothed prior to
generation of final decisionsG[m] andZ[m]. Smoothing is performed using the following first-order autoregressive low-pass filter:
logProbX[m]
=
(1−δ) logProbX[m]
+δlogProbX[m−1]
. (11)
The input speech data must be time labelled in order to train the GMM models. In the proposed procedure only the or-thographic transcriptions were initially available. A forced Viterbi alignment procedure was applied to construct the corresponding time labels.
6. THE ADAPTIVE TOPOLOGY OF THE WAVELET
PACKET DECOMPOSITION TREE
Many different possibilities exist for representing a speech signal in the time-frequency plane, by the usage of the wavelet packet decomposition. It is possible to select different wavelet-packet decomposition topologies, or various param-eter sets [9,10,15,20]. The proposed noise robust speech pa-rameterization algorithm, WPDAM, exploits the advantages of the multiresolutional analysis provided by the wavelet packet decomposition of the speech signal. Furthermore, with the aim of improving the accuracy of the proposed speech representation in the time-frequency plane against the short time Fourier transform, the time and the frequency resolutions of the proposed speech signal analysis could be
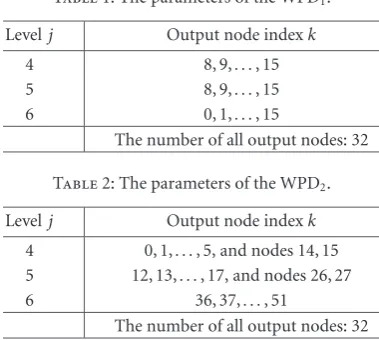
Table1: The parameters of the WPD1.
Levelj Output node indexk
4 8, 9,. . ., 15
5 8, 9,. . ., 15
6 0, 1,. . ., 15
The number of all output nodes: 32
Table2: The parameters of the WPD2.
Levelj Output node indexk
4 0, 1,. . ., 5, and nodes 14, 15 5 12, 13,. . ., 17, and nodes 26, 27 6 36, 37,. . ., 51
The number of all output nodes: 32
adapted to the characteristics of the speech signal. The ba-sic speech units—phonemes—can be roughly divided into two main sets: voiced and unvoiced [1,43]. It is already well-known that voiced speech is mainly concentrated in the low-frequency region, whereas the unvoiced speech has most of its spectral energy located at higher frequencies of the speech spectrum [43]. In the proposed WPD scheme the overall di-vision of phonemes into the two main groups is exploited, as well as the spectral characteristics of both of them. The pro-posed WPD tree topology adaptation algorithm utilizes the output decision of the statistical voiced/unvoiced classifier Z[m]. On the basis of the two possible characterizations of the current speech framem: framemcontains voiced speech ifZ[m] = 1, or the framemcontains the unvoiced speech ifZ[m]=0, one of the two empirically determined wavelet packet decomposition tree topologies is selected:
IF Z[m]=1: the topology WPD1is applied,
IF Z[m]=0: the topology WPD2is applied. (12)
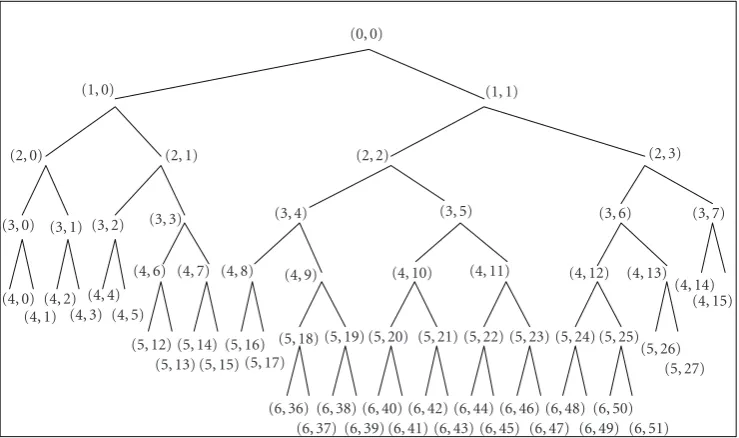
Figure 7 presents the definition of the WPD tree topology used to analyze voiced segments of the input speech signal. The wavelet packet parameters are calculated for the 32 out-put nodes of the corresponding 6-level wavelet packet de-composition tree. The relations between indexeskof the out-put nodes and corresponding decomposition levelsjare rep-resented inTable 1. The frequency resolution of the wavelet packet decomposition tree can be determined for each WPD leveljusing the following equation:
Δf[j]=2(fSj+1), (13)
where fSrepresents the sampling frequency. Using the pro-posed WPD1topology, better frequency resolution at lower
frequencies of the analyzed speech signal is achieved. There-fore, better description of the voiced segments of the speech signal is expected.
The opposite is true with the application of wavelet packet decomposition topology WPD2, which is used to
(0, 0)
(1, 1) (1, 0)
(2, 0) (2, 1) (2, 2) (2, 3)
(3, 0) (3, 1) (3, 2) (3, 3) (3, 4) (3, 5) (3, 6) (3, 7)
(4, 0) (4, 1) (4, 2) (4, 3) (4, 4) (4, 5) (4, 6) (4, 7) (4, 8)
(4, 9) (4, 10)
(4, 11) (4, 12)
(4, 13) (4, 14)
(4, 15)
(5, 0) (5, 1) (5, 2) (5, 3) (5, 4) (5, 5) (5, 6) (5, 7) (5, 8)
(5, 9) (5, 10)
(5, 11) (5, 12)
(5, 13) (5, 14)
(5, 15)
(6, 0) (6, 1)
(6, 2) (6, 3)
(6, 4) (6, 5)
(6, 6) (6, 7)
(6, 8) (6, 9)
(6, 10) (6, 11)
(6, 12) (6, 13)
(6, 14) (6, 15)
Figure7: Topology WPD1: voiced segments.
(0, 0)
(1, 1) (1, 0)
(2, 0) (2, 1) (2, 2) (2, 3)
(3, 0) (3, 1) (3, 2) (3, 3) (3, 4) (3, 5) (3, 6) (3, 7)
(4, 0) (4, 1)
(4, 2) (4, 3)
(4, 4) (4, 5)
(4, 6) (4, 7) (4, 8) (4, 9) (4, 10) (4, 11) (4, 12) (4, 13)
(4, 14) (4, 15)
(5, 12) (5, 13)
(5, 14) (5, 15)
(5, 16) (5, 17)
(5, 18) (5, 19) (5, 20) (5, 21) (5, 22) (5, 23) (5, 24) (5, 25) (5, 26)
(5, 27)
(6, 36) (6, 37)
(6, 38) (6, 39)
(6, 40) (6, 41)
(6, 42) (6, 43)
(6, 44) (6, 45)
(6, 46) (6, 47)
(6, 48) (6, 49)
(6, 50) (6, 51)
Figure8: Topology WPD2: unvoiced segments.
resolution at higher frequencies is increased and, there-fore, the parameterization of the unvoiced segments of the speech signal is improved. The empirically defined wavelet packet decomposition tree topology WPD2, used to analyze
unvoiced segments of the speech signal, is represented in
Figure 8. In this case the wavelet packet parameters are also computed for the 32 output nodes of the decomposition tree. The WPD2parameters are described inTable 2.
The presented optimal topologies WPD1 and WPD2 were determined with the analysis of average spectral en-ergy properties of voiced and unvoiced speech segments of
the studio quality database (TIDIGITS). This analysis shows for example that for unvoiced speech segments there is no benefit if nodes (4, 14), (4, 15), (5, 26), and (5, 27) are de-composed further (seeFigure 8). Namely, it was discovered that the most important spectral region of majority of con-sonants is up to around 3400 Hz [2]. This frequency is also a bandwidth limit in the PSTN telephone network.
7. WPD-BASED SPEECH PARAMETERS
A variety of different possibilities for selecting appropriate speech-describing features exist within the frame of WPD-based signal analysis [9,10,20]. In the proposed WPDAM, the basic WPD-based features will correspond to the energies of the wavelet packet sequences, computed on the terminal (output) nodes of the proposed wavelet packet decomposi-tion tree (WPD1 or WPD2). The idea behind the usage of the energy as a main feature is motivated by the findings in the domain of psychoacoustics [1,2,16]. Namely, the fun-damental speech processing information of human auditory system consists of the amount of speech energy located in the particular frequency subband [2]. The energies are computed with the application of the following equation:
Ekj[m]= 1 Nkj
Nkj−1
n=0
Wkjs[m,n]2
, (14)
where Wkj(s[m,n]) denotes wavelet packet decomposition sequence of the nodek on the level j, and of the length of Nkj, computed for the noise-reduced speech signal s[m,n]. Therefore, the computed energy parametersEkj[m] represent the results of the WPD-based multiresolutional speech signal analysis.
7.1. The combined root-log compression characteristics
The logarithmic (log) compression characteristic is the most frequently used parameter compression mode in speech pa-rameterization algorithms to reduce the dynamics of param-eters (like filterbank energies compression prior to the DCT calculation in the MFCC extraction procedure) [7]. Never-theless, some authors reported about the usage of exponen-tial (or root) compression characteristics instead of log com-pression, and achieved better automatic speech recognition performance under noisy conditions [52]. In the presented noise robust speech parameterization algorithm the com-bined root-log compression characteristics is proposed as:
Pkj[m]= ⎧ ⎪ ⎪ ⎨ ⎪ ⎪ ⎩
r
Ekj[m], ifEkj[m]< B,
logEkj[m], ifEkj[m]≥B.
(15)
If the value of the energyEkj[m] is lower than the value of the predefined breakpointB, then the root compression of the degreer is used, otherwise the logarithmic compression characteristic is applied. The values ofr andBmust be ap-propriately determined in (15) in order to achieve smooth contour of the compression characteristic. First, the value of r is selected with respect to the condition that the two (root and log) characteristics are intersecting exactly at the break-pointB:
logB=x∧√rB=x−→
logB=B1/r,
−→r= log(B) loglog(B).
(16)
The breakpoint B is set to 1% of the maximum value of the uncompressed wavelet packet energy parameter Ekj[m], determined on the basis of the training part of the speech database (Aurora 2).
8. PRIMARY FEATURE VECTOR BASED ON JOINT WPD
AND AUTOREGRESSIVE MODELING
The primary feature vectorx[m], proposed in the presented noise robust speech parameterization procedure, is defined as a concatenation of 10 linear predictive cepstral coefficients (LPCC)aLPCC[m], and of the 33 root-log compressed
param-eters of the wavelet packet decompositionP[m]:
x[m]=aLPCC[m],P[m]
. (17)
The autoregressive modeling of speech signal provides a good description of the speech production system and en-compasses information about the spectral envelope of the speech signal. These low-dimensional parameters are espe-cially well-defined if the speech signal is voiced and periodic (quasiperiodic) [11, 12, 50, 51]. The most important dis-criminant information about voiced phonemes is the shape of the spectral envelope, as well as the position and the mag-nitude of the particular formant [1,12,50].
The speech information contained in the LPCC coeffi -cientsaLPCC[m] can be well supplemented with the
informa-tion carried by the wavelet packet parametersP[m]. Namely, the WPD provides multiresolutional analysis of the speech signal and, therefore, the parameters P[m] also provide a good description of unvoiced segments of the speech signal (seeFigure 8). The parameters, constructed on the basis of the autoregressive model are combined together with wavelet packet decomposition parameters, to build a primary feature vector, which provides better parameterization of speech sig-nal than the separate use of the above-mentioned two param-eterization modes.
The primary feature vectorx[m], constructed using the proposed noise robust speech parameterization algorithm, contains 43 elements in total: there are 10 LPCC parame-tersaLPCC[m], already computed in the voice activity
detec-tion stage (seeSection 5.1), as well as 33 root-log compressed wavelet packet decomposition parametersP[m]. Before the feature vector postprocessing procedure is carried out, the primary feature vectorx[m] is supplemented with dynami-cal coefficients—with its firstΔ[m] and second orderΔΔ[m] derivatives [49].
9. FEATURE VECTOR POSTPROCESSING PROCEDURE
(i) To reduce the acoustical mismatch between the train-ing and testtrain-ing environments.
(ii) Reduction in the dimensionality of the feature vec-tors and, therefore, the increase in accuracy of the acoustical modeling [18]. Nevertheless, with the usage of lower-dimensional features, the computational and memory requirements are also reduced.
(iii) To increase the discriminativity between different clas-sification data classes (phonemes). This leads to im-mediate enhancement of the automatic speech recog-nition accuracy.
(iv) Decorrelation of the feature vectors’ elements, which enables the usage of the diagonal covariance matri-ces in the hidden Markov modeling promatri-cess. The us-age of diagonal covariances also reduces the compu-tational and memory requirements of the automatic speech recognition system [14,49].
9.1. Acoustic mismatch reduction between the training and testing environments using a statistics-based transformation
Automatic speech recognition algorithms based on hidden Markov models assume that the training and testing materi-als correspond to the same data distribution. Increase in the acoustical mismatch between the training and testing envi-ronments proportionally reduces the classification accuracy [4]. The main purpose of the presented acoustic mismatch reduction procedure is the definition of the transformation, which will assure similarity between the training and test-ing data distributions. To simplify the problem, the simple Gaussian data distribution will be assumed in the following derivations. Furthermore, contamination by additive noise is assumed:
x=s+η. (18)
In (18)s denotes the feature vector of the clean speech,η is the feature vector of additive noise, andx represents the feature vector of the noisy speech signal. Assuming that the vectorssandηcorrespond to the Gaussian data distribution, then the estimated clean-speech feature vectoracan be de-rived from the feature vector of the noisy speechxusing the following equation:
a=β(x) +α=β(s+η) +α, (19)
whereα(biasing factor) andβ(scaling factor) are free vari-ables that need to be determined. The feature vectorsaand sshould correspond to the same Gaussian data distribution: their mean values and variances must be equal:
a=s, σ2
a=σs2. (20)
The simple Gaussian distribution is completely determined by its mean value and variance. It will be shown that (19) is valid, if the free variablesαandβare determined as
β= 1 1 +σ2
η/σs2
, α=s(1−β)−βη. (21)
Firstly, the variance of the feature vectora will be defined using the following equation:
(a−a)2=β(s+η)−β(s+η)2
=β2(s−s) + (η−η)2
=β2(s−s)2+ 2(s−s)(η−η) + (η−η)2.
(22)
The speech signalsand the additive noiseηare uncorrelated, therefore, (22) can be written in the following form:
σ2
a=β2
σ2
s +ση2. (23)
If the properties of (20) are taken into consideration, the variableβcan be defined as
σ2
a =σs2=β2
σ2
s +ση2
=⇒β= σs σ2
s +ση2
= 1
1 +σ2 η/σs2
. (24)
The variableαis defined using (19) and (20):
s=a=β(a+η) +α=⇒α=s(1−β)−βη. (25)
The mean values and variancess,η,σ2
s, andση2, used to
de-termine the parametersαandβwere estimated using the Au-rora 2 database, where both the speech and noisy versions of the same utterances are available. The estimation ofαandβ is performed only once using the Aurora 2 noisy speech ut-terances with the SNRs of 10 dB. Once estimated, the twoα andβparameters were used in all other cases (including the Aurora 3 database).
9.2. Linear discriminant analysis (LDA)
Additionally, linear discriminant analysis (LDA) is applied to transform the higher dimensional feature vectora[m] to the lower-dimensional final output feature vectorb[m], and to simultaneously increase the centroid distances of theK dis-crimination classes. This is in order to reduce the computa-tional load of the automatic speech recognition system and to enhance the classification process. The basic idea of LDA is to reduce the variances within the classes, whereas the vari-ances between the classes should be as large as possible [54]. The following steps describe the LDA processing procedure.
Determination of LDA classes
LDA transformation
Once theKclasses are determined, the LDA transformation matrixΩis computed using the procedure defined in [53]. After taking into account the subtraction of the global mean value (mean feature vectorm), the final output feature vector is computed using LDA transform:
b[m]=ΩTa[m]−m. (26)
The dimensionality of the final output feature vector is re-duced using the above-described procedure from the initial 129 elements (feature vectora[m]) to 39 elements (b[m]). This feature vector dimension is most commonly used in many of modern ASR systems. The final output feature vec-torsb[m], produced using the presented WPDAM, are used in the acoustic HMM training procedure, as well as in the robust ASR performance evaluation procedures.
10. EXPERIMENTAL FRAMEWORK AND RESULTS
Connected digit recognition experiments were performed using the Aurora 2 [29] and Aurora 3 [31–34] databases, which were designed to evaluate the performance of fea-ture extraction algorithms under different noisy and acous-tic mismatch conditions. The standard training and testing procedures that have been specified by the Aurora group for standardizing distributed speech recognition (DSR) front end were used together with the HTK hidden Markov model toolkit [30, 35, 49]. The whole word acoustic models are composed of 16 emitting states, each of 3 mixtures per state (with the exception of the silence model which used 3 emit-ting states and 6 mixtures per state) [30,35]. The automatic speech recognition performance of the WPDAM was evalu-ated by a comparison with the standard baseline MFCC front ends, which were also determined by the Aurora DSR group [29,30,35].
Description of Aurora 2 and Aurora 3 databases and experiments
Aurora 2: The speech data in Aurora 2 database [29] is a derivative of the TI-DIGITS database. 8440 utterances (con-nected digits) were chosen for clean-condition training. On the other hand, for the multiconditional training, the same 8440 utterances were divided into 20 subsets with 422 utter-ances. The 20 subsets represented 5 different noise scenarios (suburban train, babble, car, exhibition noise, and clean sce-nario). These noises were added to each subset at SNRs of 20, 15, 10, and 5 dB. Three different test sets were defined to simulate the matched acoustic condition (set A), mismatched acoustic condition (set B), and the mismatched channel con-dition (set C). 4004 digit strings were first selected from the test part of TI-DIGITS, and then four subsets with 1001 ut-terances were obtained.
The test set A consists of 28028 utterances obtained by the addition of four types of noises (the same noises as in the multiconditional training procedure) at SNRs 20, 15, 10, 5,
Table3: Baseline ETSI ES 201 108 absolute overall Aurora 3 perfor-mance (% accuracy).
Condition ETSI ES 201 108 MFCC Baseline (% acc.)
WM 91.04%
MM 78.05%
HM 51.16%
Overall ACC 76.52%
0,−5 dB, and clean (no noise) condition to all subsets. There was a high match between test set A and the multiconditional training procedure because this test set used the same noises as multiconditional training.
The second test set, set B, was constructed in a similar way to set A. The only difference was that there were four different kinds of noise (restaurant, street, airport, and train station). Therefore, there was a mismatch between the train-ing and testtrain-ing conditions.
The third test set, set C, was created to simulate a mis-matched channel characteristic. Set C contained 2 out of 4 subsets each with 1001 utterances. Speech and noise (subur-ban train, and street) were filtered by a MIRS filter before be-ing added to result in SNRs of∞, 20, 15, 10, 5, 0, and−5 dB. MIRS is a frequency response that simulates the characteris-tic of narrowband telephone terminal devices [33].
Aurora 3:The four languages (subsets), Finnish, Spanish, German, and Danish of Aurora 3 databases are taken from the corpora recorded as part of the SpeechDat-Car project [31–34]. These are real-condition recordings recorded whilst driving cars, using a close-talking microphone and a hands-free microphone. Three train/test configurations were de-fined for each of the four subsets separately: the well-matched condition (WM), the medium miswell-matched condi-tion (MM), and the highly mismatched condicondi-tion (HM). In the WM case, 70% of the entire data was used for training and the remaining 30% for testing. Therefore, the training test contained all the variability that appears in the test set. In the MM case, only hands-free microphone data was used for both training and testing. In the HM case, the training data consisted of close microphone recordings while testing was performed using distance-talking microphone data.Table 3
presents the Aurora 3 baseline absolute ASR performance of the standardized MFCC feature extraction procedure ETSI ES 201 108 [5].
10.1. Separate evaluation of particular WPDAM processing steps
Speech signal preprocessing
Comparison between the automatic speech recognition re-sults shows that the proposed speech parameterization pro-cedure, which consists of high-pass and pre-emphasis fil-tering, produces an 0.82% higher average absolute perfor-mance than in the case where no preprocessing is applied. It is also noticeable that classical first-order pre-emphasis [5] produces 0.46% lower absolute performance than the pro-posed preprocessing procedure. Additionally, it was shown that the proposed pre-emphasis procedure has greater influ-ence on the automatic speech recognition performance than high-pass filtering.
Wavelet packet decomposition
The presented noise robust speech parameterization algo-rithm WPDAM uses a wavelet packet decomposition to rep-resent the speech signal in the time-frequency plane. The performances of the two different filter types were com-pared, namely, the well-known Daubechies wavelet DB16, and the proposed finite impulse response filter REMEZ32 constructed on the basis of the Parks-McClellan procedure (Remez exchange algorithm [16,41]). The results prove the hypothesis that the most important properties of the decom-position filters applied in the WPD-based speech parameter-ization procedure are good separability between pass- and stop-bands (narrow transition band), and relative high atten-uation in the stop band. Namely, the proposed REMEZ32 fil-ter has the steepest transit from the pass- to stop band when compared to the DB16. The DB16 has a wider transition band, and, therefore, worse frequency separability, resulting in the DB16 producing the lowest automatic speech recogni-tion performance. Nevertheless, the DB16 also enables per-fect reconstruction and is therefore very useful for coding purposes, but when used in feature extraction, it causes fre-quency component mixing due to its gradual transit from the pass to stop band.
WPD based additive noise reduction
As described in Section 4, the level of additive noise can be reduced effectively in the wavelet packet decomposition domain using thresholding techniques with time-frequency adaptive threshold. It can be stated that the continuity of the thresholding function has an important impact on the qual-ity of the WPD-based denoised speech signal. Namely, it can be observed that in the case of the classical hard threshold-ing technique a 2.37% lower average absolute speech recog-nition performance is achieved than in the case of classical soft thresholding technique. The impact of the threshold de-termination technique was also investigated. When using the time-frequency adaptive threshold, a 2.49% higher average absolute performance is achieved than with the usage of a universal Donoho’s threshold and modified smoothed soft thresholding (compare WPDAM and UT-SMT). Namely, the speech signal is a very dynamic process with highly non-stationary frequency content and, therefore, the threshold
used in the noise reduction algorithm must be adaptive at the time—as well as in the frequency dimension.
Voice activity and voiced/unvoiced detection
The accurate voice activity and voiced/unvoiced detections are essential processing steps in the WPDAM. Namely, the two output decisions are applied to estimate the parameters of the denoising procedure, as well as to perform the WPD topology adaptation. The automatic speech recognition re-sults show that the proposed GMM-based statistical VAD classifier achieves a 0.56% better average absolute perfor-mance than the energy-based VAD, defined in the standard ETSI ES 202 050 [6]. The differences in the performances of
both VAD approaches become increasingly noticeable under medium and highly acoustical mismatched conditions. The usage of the proposed GMM-based voiced/unvoiced clas-sification procedure achieves a 1.48% higher absolute av-erage performance than in the case of pure energy based voiced/unvoiced decision. It can be stated that energy-based approaches are very sensitive to increasingly acoustic mis-matching conditions.
Adaptive topology of the wavelet packet decomposition tree
The highest automatic speech recognition performance is achieved in the case of adaptive WPD topology. Using only the fixed topology WPD1 a 6.11% better absolute
auto-matic speech recognition performance is achieved than with application of the fixed topology WPD2 only. The reason
for this lies in the nature of the speech itself, which con-tains higher amounts of voiced phonemes than unvoiced. Namely, the topology WPD2accommodates the analysis of
unvoiced speech. Therefore, voiced speech is, in the process of acoustic modeling, statistically more important than the unvoiced. But this fact should not be misinterpreted. The ac-curate identification and recognition of unvoiced speech is also very important, in order to achieve higher automatic speech recognition performances. Namely, this is the main advantage of the proposed noise robust speech parameteri-zation algorithm WPDAM, which uses adaptive topology of the wavelet packet decomposition tree, and voiced/unvoiced detection. Therefore, the voiced, as well as unvoiced speech-segments can be accurately analyzed.
The proposed combined root-log compression characteristics
Table4: Aurora 3 performance evaluation of WPDAM.
Subset
Finnish acc. % Spanish acc. % German acc. % Danish acc. % Avg. acc. Rel. improv. Condition
WM 95.77 95.61 94.93 92.71 94.76 41.16
MM 90.03 93.02 89.24 78.95 87.81 46.47
HM 86.85 90.12 90.15 73.53 85.16 69.28
Overall accuracy 91.53 93.33 91.74 83.10 89.93 —
Relative improv. 53.27 55.39 47.92 43.62 — 50.05%
Table5: Aurora 2 performance evaluation of WPDAM: multiconditional training.
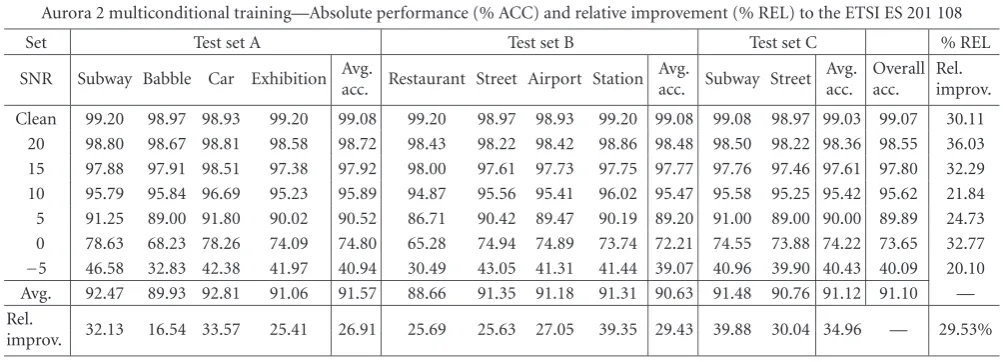
Aurora 2 multiconditional training—Absolute performance (% ACC) and relative improvement (% REL) to the ETSI ES 201 108
Set Test set A Test set B Test set C % REL
SNR Subway Babble Car Exhibition Avg.acc. Restaurant Street Airport Station Avg.acc. Subway Street Avg.acc. Overallacc. Rel.improv.
Clean 99.20 98.97 98.93 99.20 99.08 99.20 98.97 98.93 99.20 99.08 99.08 98.97 99.03 99.07 30.11 20 98.80 98.67 98.81 98.58 98.72 98.43 98.22 98.42 98.86 98.48 98.50 98.22 98.36 98.55 36.03 15 97.88 97.91 98.51 97.38 97.92 98.00 97.61 97.73 97.75 97.77 97.76 97.46 97.61 97.80 32.29 10 95.79 95.84 96.69 95.23 95.89 94.87 95.56 95.41 96.02 95.47 95.58 95.25 95.42 95.62 21.84 5 91.25 89.00 91.80 90.02 90.52 86.71 90.42 89.47 90.19 89.20 91.00 89.00 90.00 89.89 24.73 0 78.63 68.23 78.26 74.09 74.80 65.28 74.94 74.89 73.74 72.21 74.55 73.88 74.22 73.65 32.77 −5 46.58 32.83 42.38 41.97 40.94 30.49 43.05 41.31 41.44 39.07 40.96 39.90 40.43 40.09 20.10 Avg. 92.47 89.93 92.81 91.06 91.57 88.66 91.35 91.18 91.31 90.63 91.48 90.76 91.12 91.10 — Rel.
improv. 32.13 16.54 33.57 25.41 26.91 25.69 25.63 27.05 39.35 29.43 39.88 30.04 34.96 — 29.53%
Feature vector definition based on joint wavelet packet decomposition and autoregressive modeling
The primary feature vector is in the proposed noise robust speech parameterization procedure WPDAM, constructed using a combination of autoregressive parameters and com-pressed wavelet packet decomposition parameters. With the proposed primary feature vector, better automatic speech recognition (89.93%) is achieved than in those cases where the autoregressive parameters (89.59%) and compressed wavelet packet decomposition parameters (89.69%) are used separately, and independently. Both complementary speech parameterizations, therefore, together enable a better de-scription of the information contained in the speech signal and, thus, also higher automatic speech recognition accuracy.
Feature vector postprocessing
The last processing step applied in the WPDAM is feature vector postprocessing. It was shown that the proposed statis-tical modeling procedure decreases the average speech recog-nition accuracy (−0.25%) in the case of well-matched condi-tions, but in the case of medium-mismatched or highly mis-matched acoustic conditions, the automatic speech recogni-tion is increased (+0.49% and +1.21%, resp.). An automatic speech recognition performance reduction of 0.58% is ob-served with the application of PCA (principal component
analysis) instead of LDA. Better automatic speech recogni-tion performance is achieved with the applicarecogni-tion of LDA, due to its better class discriminability.
10.2. WPDAM Aurora 3 performance evaluation
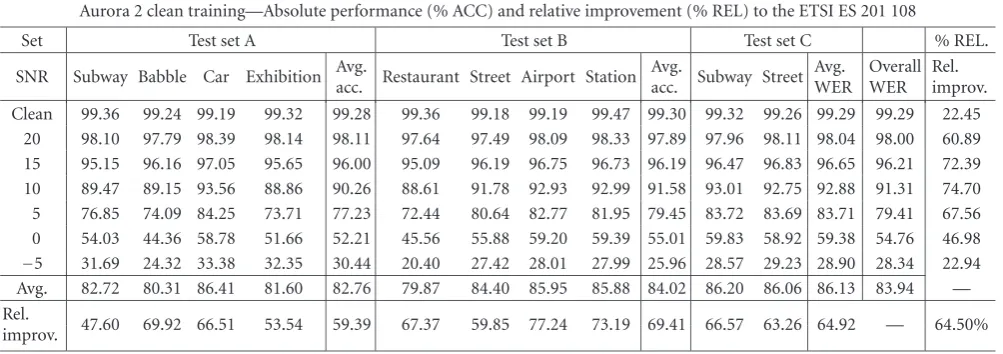
Table6: Aurora 2 performance evaluation of WPDAM: clean training.
Aurora 2 clean training—Absolute performance (% ACC) and relative improvement (% REL) to the ETSI ES 201 108
Set Test set A Test set B Test set C % REL.
SNR Subway Babble Car Exhibition Avg.acc. Restaurant Street Airport Station Avg.acc. Subway Street Avg.WER OverallWER Rel.improv.
Clean 99.36 99.24 99.19 99.32 99.28 99.36 99.18 99.19 99.47 99.30 99.32 99.26 99.29 99.29 22.45 20 98.10 97.79 98.39 98.14 98.11 97.64 97.49 98.09 98.33 97.89 97.96 98.11 98.04 98.00 60.89 15 95.15 96.16 97.05 95.65 96.00 95.09 96.19 96.75 96.73 96.19 96.47 96.83 96.65 96.21 72.39 10 89.47 89.15 93.56 88.86 90.26 88.61 91.78 92.93 92.99 91.58 93.01 92.75 92.88 91.31 74.70 5 76.85 74.09 84.25 73.71 77.23 72.44 80.64 82.77 81.95 79.45 83.72 83.69 83.71 79.41 67.56 0 54.03 44.36 58.78 51.66 52.21 45.56 55.88 59.20 59.39 55.01 59.83 58.92 59.38 54.76 46.98 −5 31.69 24.32 33.38 32.35 30.44 20.40 27.42 28.01 27.99 25.96 28.57 29.23 28.90 28.34 22.94 Avg. 82.72 80.31 86.41 81.60 82.76 79.87 84.40 85.95 85.88 84.02 86.20 86.06 86.13 83.94 — Rel.
improv. 47.60 69.92 66.51 53.54 59.39 67.37 59.85 77.24 73.19 69.41 66.57 63.26 64.92 — 64.50%
to the relatively small training set defined for the medium-mismatched condition.
10.3. WPDAM Aurora 2 performance evaluation
Table 5shows the absolute automatic speech recognition ac-curacy achieved using the proposed WPDAM procedure on the Aurora 2 speech database, with a multiconditional train-ing procedure. It is evident from the table that, in the cases of speech-alike noises such as babble and restaurant, the low-est average speech recognition accuracy is achieved (ACC= 89.93% and 88.66%, resp.). It is commonly agreed that the competing speech noise represents, due to the highly non-stationary nature of the speech signal, one of the most dif-ficult noise scenarios [39]. Namely, background speech has fast-changing spectral content, which is also very similar to the primary speech signal [1, 39]. It should be noted that the influence of competing speech is very hard to elimi-nate in one-channel systems. Even a human would have a major problem listening and understanding low-SNR bab-ble speech using one ear only [2]. When using the WP-DAM an overall absolute Aurora 2 multiconditional perfor-mance improvement of 4.07% is achieved, when compared to the standardized MFCC feature extraction procedure ETSI ES 201 108 [5]. It is also evident fromTable 5that, in the case of multiconditional training, a relative improvement of 29.53% is achieved in comparison to the baseline system. The partial results show the highest relative improvements for highly mismatched test sets C (REL = 34.96%) and B (REL = 29.43%). As expected, the lowest improvement is achieved under babble noise condition (REL = 16.54%). This result also confirms the assumption that the compet-ing speaker noise represents one of the most difficult noisy conditions. Similar critical conditions are exhibition, street, and restaurant. In opposition to the above-mentioned noise types, the following are less critical and, therefore, better relative improvements can be achieved with them: station (REL=39.35%), subway (REL=32.13%), and car (REL= 33.57%).
Table 6shows the automatic speech recognition results of the WPDAM using the Aurora 2 database with clean train-ing procedure. The acoustic mismatch between the traintrain-ing and testing environments is, in this case, very high. There-fore, this experiment shows a higher performance improve-ment by the WPDAM against the baseline feature extraction procedure ETSI ES 201 108, as an experiment using mul-ticonditional training. An absolute overall improvement of 25.88% is observed. Nevertheless, the overall performance of the proposed WPDAM is, in the case of clean training (83.94%), still lower than in the case of multiconditional training (91.10%). However, the difference between the two training modes is, when using the WPDAM, smaller (7.16%) than the difference between the two training modes achieved with the standardized algorithm ETSI ES 201 108 (28.97%). This result proves that when using the WPDAM, the acoustic mismatch between the training and testing environments is efficiently reduced.Table 6also shows the relative improve-ment achieved using the WPDAM on the Aurora 2 database, and with a clean training procedure. Much higher relative performance improvements are observed due to higher ini-tial mismatch between training and testing environments. The total overall relative improvement of 64.50% is achieved when using the proposed noise robust speech parameteriza-tion procedure. The best partial result is achieved for the test set B (REL = 69.41%). It can also be observed that the av-erage relative improvement increases with respect to the de-grading of the SNR. It reaches its maximum at SNR=10 dB (REL = 74.70%). With further degradation of the SNR, the average relative improvement decreases gradually and achieves 22.94% at the SNR= −5 dB.
10.4. Performance comparison of WPDAM against ETSI ES 202 050 (AFE)