Circumstellar Disks
Thesis by
Colette V. Salyk
In Partial Fulfillment of the Requirements
for the Degree of
Doctor of Philosophy
California Institute of Technology
Pasadena, California
2009
c
2009
Colette V. Salyk
Acknowledgements
This thesis would not exist right now if not for my incredible family, friends and mentors.
I would like to thank my many great teachers and mentors at MIT, especially Jim Elliot, who kept
pushing me forward, despite years of stubbornness, and without whom I literally would not be at
Caltech today. I would also like to thank all of my scientific collaborators here at Caltech, especially
Andy, Joanna, Adwin and Klaus, and the great planetary science and GPS staff, especially Leticia,
Irma, Mike, Sarah and Dian. And, most importantly, I would like to thank Geoff for believing in me
when I didn’t believe in myself, and for always encouraging me in my quest for work-life balance,
and beautiful Hawaiian hikes.
The number of great friends I’ve made at Caltech continues to amaze me, and it’s to them that I
owe my sanity. I want to especially thank my crew of office-mates: Kevin, Kris, Xin, Emma, Sloane,
Kaveh, Sonja and Meg (yes, I’ve been here a long time!), my old roommate Emily — who adopted
a good number of us as younger siblings, and others in the 2003 bunch, including Ravi and Carl.
And, I want to thank the incredible group of Caltech women who have been my inspiration over the
years, including Ashley, Gretchen, Margarita and Amy. And lastly, to Rem, for inspiring me, for
always asking the hard questions, and for being my partner in my escape from the world of concrete.
Finally, and most importantly, I would like to thank my whole family, and especially my mom,
dad and brother. Growing up in a family that will do anything to further their children’s education
is a privilege I will forever be grateful for. To my dad, for teaching me about photosynthesis and
circuits, multiple times, at 2 AM before exams. To my mom, for buying me math workbooks instead
of dolls. And to my brother, for reminding me that, no matter how much success I may have in life,
Abstract
Planets, now known to be common companions of nearby stars, are believed to originate in
cir-cumstellar disks—disks of gas and dust that form around collapsing protostars. Because of their
small angular size, disks in nearby star-forming regions are difficult to spatially resolve. However,
since radial temperature gradients are set up by the luminous central star, the peak wavelength of
blackbody emission is a proxy for disk location, and spectroscopic observations can thus be used
to study disk structure. In this thesis, I present spectroscopic observations of circumstellar disks
obtained with the Keck Near Infrared Spectrograph (NIRSPEC) and the Spitzer Space Telescope
Infrared Spectrograph (IRS).
High-resolution (R∼25000) M-band spectra have been obtained with NIRSPEC for over 100 circumstellar disks. CO vibrational emission in the M-band is nearly ubiquitous from classical,
optically thick disks, and can be used to examine the disks’ inner structure and gas content. The
emission is consistent with high temperatures and densities, and small emitting areas, suggesting
that it originates at small disk radii—a few AU or less. An analysis of CO lineshapes shows that the
CO gas is truncated at or near the dust sublimation radius for low and mid-mass stars but at larger
radii for more luminous stars. CO emission is also present from many transitional disks—disks in
which the inner regions have been depleted of small dust grains—demonstrating that many of their
inner disks have significant quantities of gas. Although the formation mechanism for transitional
disks is not yet known, gas-rich inner disks are consistent with formation via tidal clearing by a
giant planet.
Spitzer-IRS spectra have been obtained for 82 disks, as part of the Cores to Disks (c2d) legacy
vapor and other gaseous molecules, including OH, HCN, C2H2, and CO2, are detected from∼40% of disks. Excitation temperatures for the molecular species of∼500 K or higher and emitting radii of a few AU suggest an origin in the planet-forming regions of the disks. There are no strong correlations
between detection rates or line equivalent widths and stellar or disk parameters. However, molecular
detection rates are correlated with each other, and with disk color, suggesting a dependence on disk
structure. Unlike for classical disks, transitional disks show no evidence for H2O, OH, or any organic
molecules, perhaps because these molecules are easily photodissociated in the optically thin inner
Contents
Acknowledgements v
Abstract vii
List of Figures xiii
List of Tables xvii
1 Introduction 1
2 Molecular Gas in the Inner 1 AU of the TW Hya and GM Aur Transitional Disks 7
2.1 Abstract . . . 7
2.2 Introduction . . . 8
2.3 Observations . . . 9
2.4 Results . . . 10
2.4.1 Line Widths . . . 10
2.4.2 Excitation Diagrams . . . 11
2.5 Discussion . . . 14
3 High-Resolution 5 µm Spectroscopy of Transitional Disks 19 3.1 Abstract . . . 19
3.2 Introduction . . . 20
3.3 Description of Sample . . . 22
3.5 Overview of Spectra . . . 27
3.6 The 5µm Continuum . . . 28
3.6.1 Fitting Method . . . 29
3.6.2 Veiling Results . . . 31
3.7 H I Recombination Lines . . . 34
3.8 CO Emission Line Shapes . . . 35
3.8.1 Constructing Line Composites . . . 35
3.8.2 Inner Radii . . . 36
3.9 Rotation Diagrams . . . 38
3.9.1 Model Description . . . 40
3.9.2 Model Fits . . . 40
3.9.3 The Special Case of HD 141569 A and SR 21 . . . 41
3.9.4 Discussion of Rotation Diagram Results . . . 42
3.10 Discussion . . . 44
4 CO Rovibrational Emission: A Probe of Inner Disk Structure 69 4.1 Abstract . . . 69
4.2 Introduction . . . 70
4.3 Observations and Reduction . . . 72
4.4 Sources and Spectra . . . 73
4.5 Emission Line Structure . . . 74
4.5.1 Constructing Line Composites . . . 74
4.5.2 Emission Line Features . . . 75
4.5.3 Deriving Inner Radii . . . 76
4.6 Results . . . 77
5 H2O and OH Gas in the Terrestrial Planet-Forming Zones of Protoplanetary
Disks 99
5.1 Abstract . . . 99
5.2 Introduction . . . 100
5.3 Observations . . . 100
5.4 Results . . . 101
5.4.1 Spitzer-IRS . . . 101
5.4.2 NIRSPEC . . . 102
5.5 Discussion . . . 104
6 Spitzer-IRS Spectroscopy of Protoplanetary Disks: H2O, OH, and Organics 111 6.1 Abstract . . . 111
6.2 Introduction . . . 112
6.3 Observations . . . 113
6.4 Data Reduction . . . 114
6.5 Results . . . 115
6.5.1 Overview and Detection Statistics . . . 115
6.5.2 Colors . . . 117
6.5.3 Equivalent Widths . . . 119
6.5.4 Models . . . 120
6.5.4.1 Description of Model . . . 120
6.5.4.2 H2O Models . . . 121
6.5.5 Other Molecular Models . . . 121
6.6 Discussion . . . 123
7 Final Thoughts and Future Work 151
List of Figures
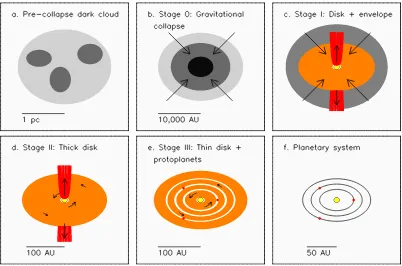
1.1 A schematic diagram of the major stages of star and planet formation . . . 4
1.2 Observational classes identified via spectral energy distributions . . . 5
1.3 Spectral Energy Distributions of a classical circumstellar disk and several types of
evolved disks . . . 6
2.1 Excerpts of the NIRSPEC spectra of TW Hya and GM Aur . . . 16
2.2 Rotation diagrams for TW Hya and GM Aur . . . 17
3.1 30/13µm flux ratios and distance-normalized 1.3 mm fluxes for the disks in our sample, as well as for four canonical debris disks . . . 48
3.2 Spectra of the fourteen transitional disks in our sample, plus one of our photospheric
standards, in the 1st M-band order . . . 49
3.3 A close-up of CO lines longward of P(25) . . . 50
3.4 A histogram showing the numbers of disks with CO and Pfβ detections, neither CO nor Pfβ detected, or Pfβ but no CO . . . 51 3.5 A comparison between CO line flux and M-band continuum excess . . . 52
3.6 Comparison of veiling-derived excess flux and that derived from both photometry and
stellar models . . . 53
3.7 Excess fluxes and disk models for LkCa 15, GM Aur, and TW Hya . . . 54
3.10 A comparison of several relevant disk radii: Rcorot,Rsub,Rdust,RCO,RSA, andRtrans 57
3.11 Rotation diagrams for the CO emission sources . . . 58
3.12 χ2 plots of temperature and column density in our rotation diagram fits . . . . 59
3.13 Mdisk againstNCO . . . 60
3.14 M˙ againstN—the gas column density . . . 61
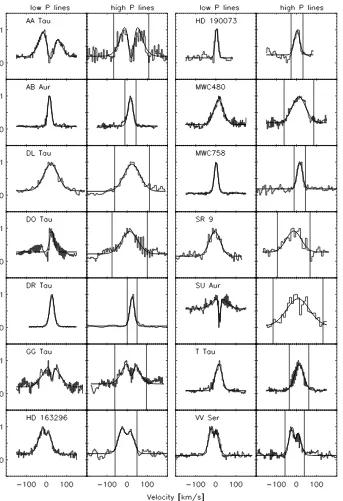
4.1 NIRSPEC spectra of T Tauri star DR Tau and Herbig Ae star AB Aur . . . 88
4.2 Composite emission lines, with one- or two-Gaussian fits . . . 89
4.3 Composite emission lines for sources in which only one of the M-band orders was observed with COv=1→0 emission . . . 90
4.4 CO inner radius against corotation radius . . . 91
4.5 CO inner radius against luminosity . . . 92
4.6 CO inner radius against dust inner radius . . . 93
4.7 Relationships between all relevant disk radii: the disk corotation radius, the dust sub-limation radius, the dust inner radius and the CO inner radius . . . 94
4.8 RCO/Rsub againstLacc/L⋆ . . . 95
5.1 Spitzer-IRS spectra of DR Tau and AS 205 A . . . 107
5.2 NIRSPEC L-band spectra of DR Tau and AS 205 A . . . 108
5.3 NIRSPEC CO emission spectra and rotation diagrams for DR Tau and AS 205 A . . 109
6.1 Continuum determination for two disks . . . 125
6.2 Data, best-fit molecular models, and residuals . . . 126
6.3 Spectra for a varied sample of disks . . . 127
6.4 Detections and non-detections as a function of S/N . . . 128
6.5 Detection fractions as a function of spectral type . . . 129
6.6 Detections and non-detections of H2O and [Ne II] on a color-color diagram . . . 130
6.7 [Ne II] equivalent width versusn13−30color . . . 131
6.9 Correlations between H2O model-fit parameters . . . 133
6.10 Molecular ratios from this work, compared to previous results and other environments 134
6.11 Sample model results for CO2 and C2H2. . . 135
7.1 Spectra for a sample of circumstellar disks, and a photospheric standard star, in the
L- and M-bands . . . 155
7.2 NIRSPEC spectrum of a circumstellar disk showing evidence for H2O, OH, and HCN 156
List of Tables
2.1 Line Fluxes . . . 18
3.1 Summary of Observations . . . 62
3.2 Our Sample: Stellar and Disk Properties . . . 63
3.3 Summary of SED Fitting: Results from the Literature . . . 64
3.4 Veiling Results . . . 65
3.5 H I Recombination Equivalent Widths . . . 66
3.6 CO Inner Radii . . . 67
3.7 Excitation Diagram Fit Results . . . 68
4.1 Summary of Observations . . . 96
4.2 Line Widths (FWHM) . . . 97
4.3 Stellar Parameters . . . 98
5.1 Fits to NIRSPEC Data . . . 110
6.1 Stellar Parameters . . . 136
6.2 Disk Parameters . . . 138
6.3 Detection Statistics . . . 140
6.4 Parameter–Detection Statistics Correlations . . . 141
6.5 Colors . . . 142
6.6 Settling–Detection Statistics . . . 144
6.8 Parameter–Equivalent Width Correlations . . . 147
6.9 Color–Equivalent Width Relationships . . . 148
Chapter 1
Introduction
How did the solar system form? Are other planetary systems created in the same way? Is our
solar system ordinary, or a great cosmic coincidence? These are a few of the overarching questions
that have motivated the work in this thesis. Until recently, attempts to answer these questions
were based solely on our own solar system. However, with the advent of advanced astronomical
techniques in the mid-20th century, it became possible to search for and study the birth of planetary
systems besides our own. In particular, a set of young stars was identified with characteristics of
‘youth’, including high variability, outflow signatures, high lithium abundances, large luminosities,
and a physical association with nebulosity (Herbig, 1962). It later became apparent that young stars
were commonly surrounded by circumstellar (a.k.a. protoplanetary) disks composed of small dust
particles and gas (Cohen et al., 1989; Strom et al., 1989; Beckwith et al., 1990). These so-called
T-Tauri (low-mass) or Herbig Ae/Be (mid-mass) stars, and their disks, are the focus of this work.
Circumstellar disks are believed to be the birthplaces of planetary systems, and early solar
system analogs. As such, they have become the subject of much study since their discovery. In the
past 50 years, as the result of observations across many wavelengths, and with many techniques,
a standard sequence of star-formation and planet-formation stages has emerged. Star formation
begins via gravitational collapse of dense clouds in the interstellar medium. As a result of angular
momentum conservation, they develop circumstellar disks as they collapse. The star and disk enter
an extended phase during which mass is transferred from the disk to the star, and is ejected via
accretion onto the star and planets, and photoevaporation. Finally, after the primordial disk has
dissipated, dusty debris disks can be formed via collisions between planetesimals. This sequence is
shown schematically in Figure 1.1. The various stages of star and planet formation can be linked to
observational classes, typically identified via spectral energy distributions (SEDs)—shown in Figure
1.2. T-Tauri stars correspond to Class II objects.
Although this simple theoretical progression does a good job of explaining the major evolutionary
stages of star formation, the actual process is much more complex. In particular, the great variety of
planetary systems that has been discovered to date (Mayor et al., 2004; Marcy et al., 2005) suggest
that there are a multitude of outcomes to the planet-formation process. In addition, there may
be multiple paths by which circumstellar disks proceed from an optically thick (T-Tauri) stage to
a largely optically thin planetary debris-disk stage. Figure 1.3 shows a classical circumstellar disk
SED compared to several types of evolved disks. The circumbinary disk has a completely cleared
few-AU inner region, the transitional disk has an inner region depleted of small dust grains, the
gapped disk has an inner annulus that has been depleted of small grains, and the depleted disk has
been depleted of material at all disk radii.
Unfortunately, detailed observations of circumstellar disks remain challenging to obtain, because
at a distance of 50–150 pc, even disks in the closest star-forming regions are unresolved with
con-ventional imaging techniques. One solution to this difficulty is to use spectroscopic resolution in
lieu of spatial resolution. There are several ways in which spatial information can be obtained from
spectra. Circumstellar disks have radial and vertical temperature gradients created by the central
star. Thus, each solid particle in the disk emits as a blackbody with temperature directly related to
location, and wavelength becomes a proxy for disk location. It is this relationship that is exploited
in the interpretation of disk SEDs. In the case of disk gas, each molecular or atomic transition has
a unique excitation temperature, such that each transition originates in a unique region of the disk.
Also, since the material in the disk is rotating around the central star subject only to Kepler’s laws
and disk pressure gradients (Lynden-Bell and Pringle, 1974), velocity, and hence, redshift, can also
with chemical information to provide even more information about the disk environment. With
spectroscopy, therefore, the challenge is to take the wealth of information obtained and relate it
back to disk models.
In this work, I will utilize the spectroscopic techniques described above to study the
terrestrial-planet-forming regions (within a few AU of the central star) of circumstellar disks. In Chapters 2 and
3, I will discuss high-resolution spectroscopic observations of CO gas from transitional disks—disks
with inner clearings that may be caused by the gravitational influence of a young giant planet. In
Chapter 4, I will discuss the use of CO lineshapes to study the inner disk structure of both T Tauri
and Herbig Ae/Be disks. Data for Chapters 2–4 were obtained with the Near Infrared Spectrograph
(NIRSPEC) at Keck Observatory. Finally, in Chapters 5 and 6, I will discuss observations of gaseous
H2O, OH, and organic molecules from inner disks. Data for Chapters 4 and 5 were obtained with
Chapter 2
Molecular Gas in the Inner 1 AU
of the TW Hya and GM Aur
Transitional Disks
This chapter, with minor differences, was published in its entirety under the same title with authors
C. Salyk, G. A. Blake, A. C. A. Boogert, and J. M. Brown in The Astrophysical Journal, 2007,
Volume 655, pp. L105–L108.
2.1
Abstract
We report the detection of CO rovibrational emission from the circumstellar disks around TW Hya
and GM Aur. These T Tauri stars have significant mid- to far-IR dust emission but a relative
deficit in the near-IR, indicating the presence of an optically thick outer disk but a reduced surface
density of small dust grains in the inner disk. Kinematic fits to the resolved emission lines yield
inner emission radii of 0.2+−..405AU for TW Hya and 0.3+−..215AU for GM Aur, thus the CO v=1→0 emission arises from within the tenuous inner disk. By considering the amount of dust necessary to
shield CO from dissociation, we demonstrate that these emission radii are consistent with the inner
disk dust populations predicted by SED modeling and K-band interferometry. Rotation diagram
analyses yield temperatures that are consistent with our kinematic fits, as well as densities that
imply dynamically significant amounts of gas in the inner disk and a gas:small-dust-grain ratio in
accretion rates without replenishment for more than a few hundred years, and transfer of gas from
the outer to inner disk is therefore likely required.
2.2
Introduction
As the intersection between star and disk processes and the likely location of terrestrial planet
formation, the inner regions of circumstellar disks (R.5 AU) hold information essential for
under-standing the evolution of young stars and planetary systems. In particular, inner disk gas controls
such varied processes as planetary migration rates (Ward, 1997), orbit circularization (Kominami
and Ida, 2002), and accretion (Shu et al., 1994). Because of their small angular scale and proximity
to the bright parent star, inner disks are notoriously difficult to image. Recently, however,
rovi-brational emission lines of species such as H2O (Carr et al., 2004) and CO have emerged as ideal
probes of the near-surface layers of disks. Fundamental CO rovibrational emission (v=1→0) has been observed from embedded protostars (Pontoppidan et al., 2002), classical T Tauri stars (Najita,
Carr, & Mathieu 2003; Rettig et al., 2004), and Herbig Ae/Be stars (Brittain et al., 2003; Blake and
Boogert, 2004).
COv=1→0 emission can also provide a unique view into the inner regions of so-called transitional disks, whose spectral energy distributions (SEDs) are characterized by nearly photospheric levels
of emission in the near-IR but significant excess flux at mid- to far-IR wavelengths. They are thus
believed to have optically thin inner disks or gaps caused by grain growth and/or clearing due to
dynamical interactions (Lin and Papaloizou, 1979), perhaps due to the presence of a planet (Rice
et al., 2003; Calvet et al., 2002). Two prototypical examples of transitional disks are TW Hya
[K8V] and GM Aur [K5V], whose SEDs show evidence for significant disk clearing out to∼4 AU (Calvet et al., 2002) and ∼ 24 AU (Rice et al., 2003), respectively. For TW Hya, SED modeling yields an inner disk dust mass estimate of ∼ 6×10⁻³ M
⊕ (Calvet et al., 2002), while a K-band interferometric study yields values closer to ∼5×10⁻⁷ M
⊕ (Eisner, Chiang, & Hillenbrand 2006). There is an estimated 2.5×10⁻⁴M
T Tauri stars: ∼4×10⁻¹⁰ M
⊙yr−1 (Muzerolle et al., 2000) and∼10−8 M⊙yr−1 (White and Ghez, 2001).
Observations of COv=1→0 emission from TW Hya were first reported by Rettig et al. (2004). We expand on these results, reporting NIRSPEC observations of CO emission from TW Hya that
cover a larger range of rotational energies, (Eup ∼3000–6000 K versus∼3200–4700 K), as well as Phoenix observations for which the emission lines are spectrally resolved. We also report the first
observations of COv=1→0 emission from GM Aur.
2.3
Observations
M-band spectra were obtained with NIRSPEC (McLean et al., 1998) at the Keck II telescope on
2005 April 24–25 and 2005 December 18, 20 for TW Hya, and 2004 December 27, 30 for GM Aur.
Echelle mode observations with the 0.43′′
×24′′slit (yielding a Gaussian FWHM of
∼12.5 km s−1, as measured on unresolved CO absorption lines) encompassed the first two R-branch and many
P-branch lines [specifically P(1→12) and P(30→40)] of thev=1→0 CO rovibrational band. Further Phoenix (Hinkle et al., 2003) spectra of a few TW Hya lines were obtained at Gemini South on 2006
April 06–07 using the 0.25′′
×14′′slit (measured FWHM
∼5 km s−1).
The 2D echellograms were analyzed with the procedures outlined in Boogert et al. (2002),
us-ing nearby standard stars (HR1620 [A7V], HR4313 [A2V], HR4494 [B9V], and, for Gemini data,
HR5028 [A2V]) for atmospheric correction and flux calibration. After removal of wavelengths with
significant telluric absorption (transmission.40–65%), flux calibrated spectra with signal-to-noise
ratios approaching the shot noise limit can be obtained. For TW Hya, which was observed twice
with Doppler shifts of∼12 and∼24 km s−1, most line profiles remain complete after the removal of potential telluric interference. For GM Aur, observed only once with a Doppler shift of∼11 km s−1, line profiles are incomplete. However, more than half of the profile remains, allowing reasonable
constraints on both the height and width of the lines. Although previous results reported
line-to-continuum variability by a factor of 10 or more for TW Hya (Rettig et al., 2004), we saw variations
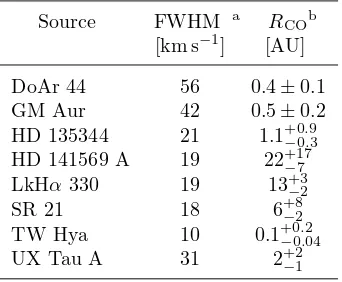
TW Hya shows CO v=1→0 R(0–1), P(1–12) and P(30–32) lines. GM Aur was observed in one additional setting and its spectrum shows emission out to at least P(14). No13COv=1
→0 or CO
v=2→1 emission is seen. The line and continuum spatial FWHM of∼0.5′′ are consistent with the 0.4–0.7′′K-band seeing, and constrain the emission to radii<10–15 AU for TW Hya and<30–35 AU for GM Aur. Excerpts of our NIRSPEC M-band spectra are shown in Figure 2.1.
2.4
Results
2.4.1
Line Widths
Because CO v=1→0 emission originates from the inner regions of Keplerian disks, the line shapes depend on the disk inclination and emitting radii (Najita et al., 2003; Blake and Boogert, 2004).
For TW Hya’s nearly face-on disk, the NIRSPEC data yield only marginally resolved lines, so we
instead utilize the R=60,000 Phoenix spectra. A composite lineshape from the P(6)–P(9) transitions
is presented as an insert in Figure 2.1. Individual lines were velocity centered, continuum subtracted,
normalized, and resampled into 2 km s−1 bins.
Inner emission radii are often estimated by measuring the velocity of the Half Width at Zero
Intensity (HWZI). This procedure yields an inner radius for TW Hya of ∼ 0.04 AU (for M⋆=0.6
M⊙ and i=7◦±1◦, Qi et al. 2004), but does not take into account the effect of disk structure or of any non-Keplerian (turbulent) motions, whose line-of-sight projections are especially important
for low-inclination disks. A complete 2-D disk model would be difficult to constrain with only the
data shown here, and we therefore present a compromise—a disk model consisting of an optically
thick dust layer and overlying hotter gas layer, each withT=T0(r/AU)α(L/L⊙). Based on SED fits using the radiative transfer models of Dullemond et al. (2002), and on matching total line fluxes, we
The best least-squares fit was achieved with rin=0.2 AU. Including all trials within theχ2 95% confidence interval, withσ defined by the flux variation beyond the line profile wings, inner radii consistent with the data are rin=0.2+0−0..205. Note that this estimate is several times larger than that estimated from the HWZI. An investigation of all of the disk parameters that could influence
estimates ofrinis not possible with this dataset; nevertheless, we tried to get a feel for the magnitude of the importance of a few key parameters.
For nearly face-on disks such as TW Hya, the turbulent velocity is the most influential parameter
at fixed inclination. For example, withvTurb ∼0.05vKep the best-fit radii are ∼1 AU, but at such distances the disk may be too cool to induce the observed line fluxes. Doppler broadening at the
temperatures of interest is unimportant, but the temperature gradient can be significant. Tests with
α=−0.44 and−0.05 result inrin up to 0.4 AU. To reflect this uncertainty, true error bars should be larger than theχ2 estimate by a factor of a few. Because the inclination of TW Hya’s outer disk is well-constrained this turns out to be a relatively insignificant source of error, affectingrinby.40%, unless the disk is strongly warped.
The CO emission lines from GM Aur have a FWHM of ∼ 30 km s−1, and so the NIRSPEC IRF makes a minor contribution to the measured line profile. A composite line was created utilizing
P(9)–P(12) and P(14) (see Figure 2.1 insert), and a HWZI estimate yields an inner emission radius
of 0.1 AU (with M=0.84 M⊙, i=54◦±5◦; Simon et al. 2001). Utilizing our two-layer disk model with the same parameterization as for TW Hya, with stellar mass and disk inclination as above, and
withL=0.74L⊙, rout=5 AU, we find thatrin=0.3 AU. Aχ2 95% confidence interval metric yields
rin=0.3+0−0..215. The turbulent velocity in this case is much less significant, but changes inαcan still affectrin by factors of∼2. Inclination errors have little effect (.15%) onrin.
2.4.2
Excitation Diagrams
To estimate the gas temperatures and mass surface densities, we construct excitation diagrams, in
upper state and Ej is the upper state energy. For optically thin, single-temperature emission the dependence is linear, with a slope of−1/T, whereT is the excitation temperature that characterizes the rotational manifold, and an intercept that yields the column density. Nonlinear dependencies
can indicate temperature gradients or optically thick emission.
Before calculating line fluxes, we first estimate the reduction in observed line fluxes induced by
absorption features in the photospheres of TW Hya and GM Aur. Although these photospheres are
nearly unobstructed at 1µm (Edwards et al., 2006), in the M-band veiling appears to dominate. We quantify this effect by assuming that away from thev=1→0 CO lines the spectrum is the sum of a constant veiling term plus a scaled photospheric template, given by NIRSPEC data for the [K7V]
star HD 79211 (see Figure 2.1). The veiling and median photospheric contributions are 0.197±0.006, 0.096±0.006 Jy for TW Hya and 0.081±0.002, 0.019±0.002 Jy for GM Aur. Here the error bars reflect only the statistical uncertainties of the fit. Subtraction of the photosphere+veiling model
should now yield the “true” disk line fluxes. For TW Hya, R(1)–R(0) and P(1)–P(12) transition
fluxes are changed by∼6% on average, but P(30)–P(32) fluxes by∼30%. For GM Aur, the moderate S/N and the dominance of veiling render flux corrections insignificant. (The model fluctuations are
of order 0.001 Jy, while the noise level for GM Aur is ∼0.01 Jy).
If HD 79211 is not a proper template, or if TW Hya’s or GM Aur’s photospheric absorption lines
are filled in by hot gas from the inner disk or accretion flow, our fits will tend to underestimate the
photospheric contribution. Therefore, to provide an upper limit to the possible photospheric impact,
we considered the case where the spectra between the COv=1→0 emission lines are assumed to be “veiling free”. Specifically, the model photosphere was scaled such that its median matched that of
the source spectrum and was then subtracted from the data to derive veiling-free fluxes. Again, the
GM Aur line fluxes are not significantly affected because the variations in the reference photosphere
(σ ∼0.007 Jy) are smaller than the noise level of the spectrum. TW Hya R and P(1)–P(12) line fluxes are changed by 7%, on average, while P(30)–P(32) fluxes are increased by up to 160%.
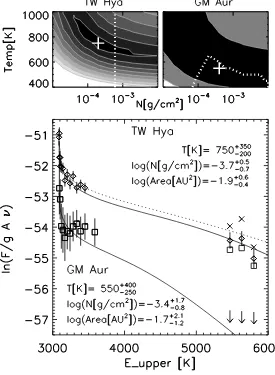
The rotation diagram in Figure 2.2 includes fluxes of 17 identifiable emission lines for TW Hya
fluxes corrected by a veiling+photosphere model are displayed as diamonds. Additionally, we show
upper limits for GM Aur and veiling-free fluxes for TW Hya. (For clarity, we show only one set of
fluxes at low energies). Error bars include two contributions added in quadrature: one derived from
the standard deviation of the continuum flux and the other derived from the standard deviation of
fit line widths.
The most obvious feature of these plots is that they are nonlinear; therefore, the optically thin,
isothermal assumption is invalid. To fully model the line emission, one would need to consider
both the gas and dust distributions and temperatures as well as the disk geometry. However, to
derive a simpler, more intuitive estimate of conditions, we fit our rotation diagrams with a constant
dust continuum plus a single temperature gas whose column density, rotational temperature, and
emitting area are free parameters. Gaussian line shapes derived from the data are also provided to
the model.
The best fit to TW Hya’s veiling+photosphere corrected fluxes can be seen in Figure 2.2. Error
bars are defined by the range of models within a 95%χ2 confidence interval, plus an upper density limit provided by the non-detection of13CO (see top of Figure 2.2). Note that Area andN tend to covary, and are both anti-correlated with T, such that fits with high T correspond to lowNand Area, and vice-versa. The veiling-free fluxes (representing an upper limit) give only a slightly different
temperature and area: log(N)=−3.7+0−0..54g cm−2, T=950+550−300K, and log(Area)= −2.3+0−0..66AU2. A lower temperature and density (T=430±40 K, N∼1×10⁻⁸g cm−2) were derived by Rettig et al. (2004), assuming optically thin lines and an emitting area equal to that sampled by NIRSPEC (i.e.,
out to several tens of AU). However, given the curvature below ∼ 3300 K in Figure 2.2 and the high temperatures required to excite the transitions, these assumptions are not appropriate. For
graybodies, our fit temperatures correspond tor=0.07+0−0..3605AU and 0.04 +0.39
−0.03AU, but warm gas can exist at larger radii in disks with super-heated atmospheres (e.g., Kamp and Dullemond, 2004).
Best fits for GM Aur can also be seen in Figure 2.2. In this case, theχ2 interval is significantly larger and we used three additional limits to constrain our fits — an upper flux limit based on
a requirement that fit models have significant curvature at low energies. The best-fit temperature
corresponds tor=0.53+0−0..9416AU for graybodies.
2.5
Discussion
The molecular emission we observe originates from inside 1 AU—well inside the estimated disk
tran-sition radii of∼4 and∼24 AU for TW Hya and GM Aur. Line profiles yield inner radii of 0.2+0−0..405 and 0.3+0−0..215AU, and rotational temperatures are consistent with emission radii ofr=0.07+0−0..3605and
r=0.53+0−0..9416 AU for equilibrium graybodies. The consistency between the emission radii and in-ner radii suggests that the CO emitting layer has temperatures similar to those for graybodies in
equilibrium with the stellar radiation field.
Although the CO lies inside the optically thick transition radius derived from SEDs, it lies outside
the estimated disk truncation and dust destruction radii. For example, Keck interferometry plus
IR photometry yield an inner radius of 0.06±0.01 AU for TW Hya’s dust disk, which is consistent with an estimate of the magnetic truncation radius (Eisner et al., 2006). GM Aur’s inner disk dust
is truncated at 0.221+0−0..082085AU, consistent with the dust sublimation radius (Akeson et al., 2005a). In both cases, our measurements put the CO inner radius outside that of the dust. This is expected
because the CO must be shielded from photodissociation; at our derived inner radii, radial
vacuum-UV (λ∼0.1µm) optical depths are>5–10 according to dust (κ= 103(ν/νk) cm2g−1) and disk mass surface density (Σ = Σ0(R/AU)−3/2) models analogous to those in Eisner et al. (2006).
Column densities derived from fits to the rotational diagrams allow us to estimate the gas content
in the inner disk and the gas-to-dust ratio. The best fit to TW Hya’s rotation diagram yields a gas
surface density of Σgas∼0.07 g cm−2for an H2/CO ratio of 5×10³(Lacy et al., 1994). (This molecular
ratio, observed toward massive protostars, is among the lowest observed in the dense ISM, and thus
should provide a reasonable lower limit to the total gas mass.) A comparison with dust column
densities derived by Eisner et al. (2006) for TW Hya implies a gas-to-dust ratio of ∼ 104 at
∼
that scales asr−1.5 we predict a total inner disk gas mass of 3
×1025g (0.005M⊕).
The best fit to GM Aur’s CO emission yields a gas surface density of Σgas∼0.1 g cm−2.
Extrap-olating to 5 AU yields a total inner disk gas mass of 3×1025g (0.005M
⊕). Given the total dust mass from Calvet et al. (2005), this implies a gas-to-dust ratio of∼70.
The inner disk mass could only sustain the observed accretion rate for tens of years or less
without invoking transfer of material from the outer disk. Steady mass transfer across gaps may be
caused by an embedded planet (Rice et al., 2003). Interestingly, the derived gas surface densities also
approximate those shown to provide significant circularization of the orbits of planetary embryos in
the terrestrial planet-forming region (of order 0.1–1 g cm−2at 1 AU; Kominami and Ida, 2002), and
Table 2.1. Line Fluxes
TW Hya GM Aur
transition F0 FWHM Fc FWHM Fnv FWHM F0 FWHM
R(1) 5.0±1.0 14.5 5.1±1.3 14.6 5.4±1.3 15.0 1.3±0.9 22.8 R(0) 5.5±1.1 15.5 5.5±1.3 15.1 5.6±1.4 14.6 0.9±0.8 15.6 P(1) 2.9±0.8 16.8 4.8±1.1 22.8 3.7±1.0 15.0 · · · · · · P(2) 5.2±1.0 20.7 5.0±1.1 20.8 5.0±1.1 22.2 · · · ·
P(3) 5.9±1.1 21.0 5.5±1.2 20.3 5.1±1.1 19.5 · · · · · · P(4) 7.1±1.4 13.5 7.2±1.8 13.6 7.5±1.8 13.9 1.0±0.8 19.6 P(5) 8.3±1.6 14.2 8.4±2.0 14.3 8.5±2.0 14.5 1.1±0.8 18.0 P(6) 6.7±1.3 13.8 6.8±1.7 13.9 7.0±1.7 14.0 1.1±0.8 18.0 P(7) 9.5±1.7 14.5 9.5±2.2 14.7 9.8±2.2 15.2 1.5±0.9 26.9 P(8) 8.3±1.6 13.6 8.1±2.0 13.4 7.9±2.0 13.1 1.6±0.9 25.4 P(9) 11.3±1.9 15.3 11.5±2.5 15.5 11.9±2.5 15.9 2.2±1.1 37.2 P(10) 8.8±1.7 13.8 8.7±2.1 13.7 8.5±2.1 13.4 2.7±1.2 44.6 P(11) 10.6±1.7 16.5 10.5±2.2 16.2 10.3±2.2 15.8 2.3±1.1 35.6 P(12) 9.9±1.7 16.0 10.2±2.1 16.2 10.7±2.2 16.6 2.9±1.2 42.9
P(14) · · · 2.8±1.2 46.3
P(30) 2.9±0.8 18.5 3.9±1.0 21.4 6.3±1.2 26.5 · · · · · · P(31) 3.1±0.7 15.6 4.3±1.0 18.2 8.1±1.3 27.1 · · · ·
P(32) 1.8±0.6 11.8 2.3±0.7 12.6 3.3±0.9 14.0 · · · ·
Notes: All fluxes are in 10−18 W m−2. Error bars include two contributions added in quadrature: one derived from the standard deviation of the continuum flux and the other derived from the standard deviation of fit line widths. F0 is the flux with no photospheric corrections. Fc is photospheric+veiling
adjusted flux. Fnv is the flux adjusted with a model assuming no veiling contribution. Line FWHMs
Chapter 3
High-Resolution 5
µ
m
Spectroscopy of Transitional Disks
This chapter will be published in its entirety under the same title with authors C. Salyk, G. A.
Blake, A. C. A. Boogert, and J. M. Brown in a future issue ofThe Astrophysical Journal, 2009.
3.1
Abstract
We present high-resolution M-band (∼ 5µm) spectra of fourteen transitional disks—circumstellar disks with an optically thick outer zone but an inner region significantly depleted of small dust
grains—obtained with NIRSPEC on the Keck II telescope. We detect CO emission from nine disks,
and show that for the majority of these systems, the emission originates in the depleted inner disk
region. We find that the presence of high 5 µm veiling, strong CO emission, and high accretion rates are usually correlated, suggesting that at least two classes of transitional disks exist — those
nearly completely cleared, and those only partially depleted—within their transition radius. Cleared
inner disks are consistent with the presence of a close stellar companion, or with formation by
photoevaporation. Of the cleared transitional disks, at least two (HD 98800 B and CoKu Tau/4)
are known to be circumbinary with projected binary separations of several AU or less. Partially
depleted inner disks most often have CO that extends to small (. 1 AU) radii, but compared to
“classical” disks the CO excitation temperature is lower and the emission radii are larger than that
inconsistent with having been formed by photoevaporation. Although the inner regions of such disks
are vertically optically thin in dust emission, line-of-sight opacities from the star can be large, and the
complex physical and chemical processes therein make it difficult to derive a fiducial CO abundance
w.r.t. molecular hydrogen. Thus, CO M-band lines are best suited to providing lower bounds as to
the total inner disk gas mass. Amongst the partially depleted sources, veiling measurements and
CO emission models demonstrate a great diversity of inner disk gas content and gas/dust ratios,
suggesting a variety of planet-forming environments.
3.2
Introduction
Planets, now known to be common companions of nearby Sun-like stars, are believed to originate
in the disks of gas and dust that form around collapsing protostars as a consequence of angular
momentum conservation. Circumstellar disks and planetary systems are both well-studied, and the
set of processes that convert one to the other have been fleshed out in some detail (e.g., Ruden,
1999). However, the observational constraints on this process are few. The formation of terrestrial
planets and giant planet cores occurs on small scales, which cannot easily be spatially resolved.
Additionally, to date, no planet has been conclusively shown to exist inside a gas-rich circumstellar
disk, largely because high radial velocity precision is difficult to achieve with highly variable young
stars (Setiawan et al., 2008; Hu´elamo et al., 2008). The potentially ∼Jovian-mass companions to HR 8799 (Marois et al., 2008) and Fomalhaut (Kalas et al., 2008) reside in young debris disks, and
extending such results to gas rich systems would provide new laboratories for the study of planetary
system formation.
With this background in mind, it is easy to understand the excitement that accompanied the
discovery of disks like TW Hya and GM Aur (Koerner et al., 1993; Calvet et al., 2002). The spectral
energy distributions (SEDs) of these stars show a deficit of flux in the near-IR that suggests a lack of
material close to the star. At the same time, far-IR fluxes are much higher, so the outer disk is still
relatively massive. Could these disks represent the transitional phase between classical circumstellar
TW Hya are often referred to as ‘transitional disks’.
To date the term transitional disk has been adopted somewhat loosely to describe collections of
young stars whose SEDs are depleted relative to classical disks, in one way or another. Although
the word ‘transitional’ implies an evolutionary characteristic, these disks are generally defined by
observational signatures. One broad definition of transitional disks, as described by Najita et al.
(2007), is used for SEDs in which the near- to mid-IR fluxes are below typical classical levels.
Another, which is the definition we will adopt here, refers to a subset of these objects—those with
lower than typical fluxes in the near-IR but with steep rises in flux toward the far-IR. These peculiar
SEDs suggest not just that material has been removed from the disk, but that it has been removed
selectively from a gap surrounding the star.
The actual mechanism for clearing out gaps in transitional disks is not yet known, but possibilities
include photoevaporation (Hollenbach et al., 1994; Alexander and Armitage, 2007), dynamical
clear-ing by a stellar or planetary-mass companion (Calvet et al., 2002; Rice et al., 2003) and grain growth
(Tanaka et al., 2005). However, the discovery of significant quantities of gas in the inner regions of
the transitional disks LkCa 15, GM Aur, and TW Hya (Najita et al., 2003; Rettig et al., 2004; Salyk
et al., 2007) suggests against photoevaporation for at least some transitional disks. Additionally,
recently obtained images of LkHα330 (Brown et al., 2008) demonstrate a sharp transition between the thin and thick disk regions, which would be difficult to produce with grain growth alone. The
exciting possibility thus remains that the characteristics of some transitional disks are most readily
explained by the presence of young giant planets.
Transitional disks may not represent a single phenomenon. Although sharing a characteristic
SED dip in the near-IR, the class as a whole spans a wide range of other parameters. For example,
in the sample presented here, accretion rates range from undetectable (CoKu Tau/4, D’Alessio et al.,
2005) to nearly classical (GM Aur, Johns-Krull and Gafford, 2002), disk gap sizes range from 3 AU
(DM Tau, Calvet et al., 2005) to 56 AU (UX Tau A, Espaillat et al., 2007), and total disk masses
range from 1×10⁻⁴to 2
×10−2M
both photoevaporated inner disks, as well as systems that harbor giant planets, with the second
process being more appropriate for sources with high accretion rates (i.e., TW Hya and GM Aur).
Whether the variety amongst transitional disks reflects varied processes, stages of evolution, or
population heterogeneity is an important question that remains to be answered.
With these issues in mind, we selected a varied group of fourteen transitional disks to observe
in the M-band (∼5µm) with NIRSPEC, a high-resolution echelle spectrograph on the Keck II tele-scope. The M-band region sits within the near-IR SED dip, and thus the M-band excess continuum
emission is produced largely by dust within the disk gap. Additionally, the M-band harbors the
P-(∆J=+1) and R-branch (∆J=−1) rovibrational transitions of CO. With upper state (v=1) energies greater than 3000 K, producing these transitions thermally requires temperatures of at least several
hundred K, meaning they are a good probe of the region within an AU or so from the host star.
Indeed, these transitions appear to originate in a disk atmosphere at distances of ∼0.1−few AU (Najita et al., 2003; Blake and Boogert, 2004; Pontoppidan et al., 2008a). In this paper we report the
detection of CO rovibrational emission originating in nine out of the fourteen observed transitional
disks. For those with emission, we discuss the characteristics of the gas and its emitting region and
implications for the formation of transitional disks. We also discuss the question of why some disks
show emission and some do not, and how this relates to transitional disk diversity.
3.3
Description of Sample
The selection criteria for our sample of transitional disks are shown graphically in Figure 3.1. We
were interested in studying those disks with depleted (optically thin) inner regions but optically
thick outer disks. Accordingly, these disks tend to have a high 30/13 µm ratio (Brown et al., 2007) as compared to the median SED, but millimeter fluxes similar to classical disks. As selection
This set of criteria is simple to apply because it is observationally based and does not require any
model-based interpretation. The drawback of this approach is that it does not take into account
other factors (such as grain opacity and stellar spectral type) that may determine whether or not the
disk truly has an inner depleted region. Nevertheless, this set of criteria does result in the inclusion
of those transitional disks with confirmatory images of inner holes—a list that currently includes
TW Hya (Hughes et al., 2007), LkHα330 (Brown et al., 2008), GM Aur (Dutrey et al., 2008), SR 21, and HD 135344 (Brown, (in preparation)—as well as HD 141569 A, which has had its inner hole
resolved in CO emission lines (Goto et al., 2006). In addition, it does a fairly good job of excluding
younger, optically thick classical disks, and more evolved debris disks. Interestingly, our selection
criteria would permit the inclusion of Beta Pictoris, which, at a probable age of only ∼ 20 Myr (Di Folco et al., 2004, and references therein), may be transitioning from a primordial to a debris
disk phase. The 1.3 mm fluxes were derived from the literature, or extrapolated from the closest
known flux value assumingFν ∝ν2(Andrews and Williams, 2005), while 30/13µm flux ratios were calculated using Spitzer Infrared Spectrograph (IRS) spectra derived from Furlan et al. (2006), c2d
data releases (Evans et al., 2003) or the Spitzer data archive.
Characteristics of the fourteen selected transitional disks are summarized in Table 3.2. Sources
derive from a variety of clusters, including Taurus, TW Hya , Serpens, and Ophiuchus. Additionally,
they span spectral types from B9.5 to M1, accretion rates from undetectably low to 10−8M ⊙yr−1, and many orders of magnitude in disk mass. The sample thus represents a decent cross section of
the T Tauri star population plus two Herbig Ae/Be stars, although typically with older ages and
lower accretion rates than most classical T Tauri stars (cTTSs). Although all of the disks in our
sample share the distinctive near/mid-IR SED dip, followed by a subsequent rise in flux out to 20
µm or so (Jayawardhana et al., 1999; Calvet et al., 2002; Furlan et al., 2006; Brown et al., 2007), the location and size of the cleared-out gap, as well as the remaining mass in small dust grains, vary
significantly from source to source.
Several of our sources are members of multiple star systems. HD 135344, HR 4796 A, and SR
et al., 1993), and 7.′′8 (McCabe et al., 2006), respectively. HD 141569 A is a member of a triple system with A-B separation of 7.′′5 and B-C separation of 1.′′5 (Rossiter, 1943; Weinberger et al., 2001). For all of these sources, the Spitzer spectrum should have included only the primary, and
only the primary was observed with NIRSPEC. UX Tau is a quarternary system, with A-B and
A-C separations of 5.′′86 and 2.′′63, respectively, and with B a subarcsecond binary. Thus Spitzer photometry and spectra include two to four of the components, depending on the wavelength band
and observing mode (Furlan et al., 2006). While the A component is classified as a cTTS, the B and
C components are classified as weak-line T Tauri stars (wTTSs). In addition, the A flux dominates
over that from B and C by factors of 7 and 24, respectively, at 3.6 µm (White and Ghez, 2001). Therefore, a circumstellar disk around the A component is the likely source of the emission observed
with Spitzer. Our spectra, too, are dominated by only one component, presumably UX Tau A.
HD 98800 B is a member of a quadruple system with an A-B separation of 0.′′8 (Koerner et al., 2000). Both components are themselves spectroscopic binaries with separation 23.7 mas (∼1 AU) (Boden et al., 2005). For this source, the disk is circumbinary, and the transitional-like SED is a
result of tidal truncation due to the binary orbit (Furlan et al., 2007). Similarly, for CoKu Tau/4, a
53 mas (∼8 AU) binary, the SED-derived transitional radius is consistent with dynamical clearing from the binary pair (Ireland and Kraus, 2008). Although these disks are circumbinary and so not
physically in transition, we explicitly include them here for the purpose of comparison.
The resulting sample encompasses most of the bright transitional disks that have been discussed
in the literature and are observable from Mauna Kea. Some notable exceptions include disks with
depleted inner disks, but no significant rise out to longer wavelengths—for example, Hen 3-600 A
(Uchida et al., 2004) and v819 Tau (Calvet and D’Alessio, 2001). Transitional/debris disks that
fit our criteria but are not observable due to their low declination include T Cha (Brown et al.,
2007) and β Pic. Further, we are effectively limited to M-band fluxes & 0.01–0.1 Jy, and so our set of observations becomes less complete for later-type sources and for more distant clusters. For
example, we have not fully investigated the possibly transitional disk-rich IC 348 cluster in Perseus
4 sources in our sample: LkCa 15 (Najita et al., 2003), HD 141569 A (Brittain et al., 2003; Goto
et al., 2006), TW Hya (Rettig et al., 2004; Salyk et al., 2007), and GM Aur (Salyk et al., 2007).
3.4
Observations and Reduction
The fourteen transitional disks in this study were observed over a period of 5 years (from 2002–2008,
see Table 3.1) with NIRSPEC (McLean et al., 1998), a high-resolution echelle spectrograph on the
Keck II telescope. Spectra were obtained in the M-band region, with a 0.43′′
×24′′ slit, providing a resolution of R ∼25000 (FWHM ∼12.5 km s−1). Two spectral orders typically spanning 4.65– 4.78 and 4.96–5.1 µm were obtained. LkCa 15 and HD 98800 B were observed over a smaller range, while GM Aur, LkHα330, and TW Hya were observed over a slightly more extended range. These wavelength ranges encompass R(0–1) and P(1–12, 30–40) (or R(0–5) and P(26–43) in the
extended cases) of the fundamental (v=1→0) rovibrational transitions of CO, as well as portions of the v=2→1 spectrum and13CO P- and R-branches. Additionally, the spectra encompass two to three H I electronic transitions: Pfβ (4.654µm), Huε(4.673µm) and Huδ(5.129µm).
Spectra were recorded in ABBA sets, with each image acquisition (integration time plus co-adds)
limited to one minute, in order to minimize atmospheric changes between the AB pairs. Data were
reduced using IDL routines. AB pairs were subtracted to remove thermal noise, linearized, and
summed along the slit direction to create 1D spectra. The 1D spectra were then aligned using
telluric emission lines, weighted according to S/N and summed. Telluric lines were also used for
wavelength calibration, while standard stars served to correct for atmospheric absorption. Stars
of type A and earlier were chosen because of their relatively few photospheric features at 5 µm. Nevertheless, the cooler stars do have prominent Pfβ absorption. To correct for this, these stars were divided by a Kurucz model, which was broadened to match the appearance of the Pfβ line. These corrections were all examined manually and are quite successful at removing Pfβ, with any possible remaining structure being less than a few % of the continuum.
After an adjustment for source airmass, source spectra were divided by the standard star
maximize S/N; this is likely due to small shifts in telluric emission line centers between images due
to grating jitter. Flux calibration was performed by comparing sources and standards, along with
standard star K magnitudes and spectral types. Flux calibration is not always reliable, because
po-sition shifts and changes in seeing can affect the throughput. To minimize this effect, slit popo-sitioning
was constantly monitored and adjusted while observing and the brightest spectra of standards and
sources were chosen (i.e., spectra in which the stars were best centered). Continuum fluxes were
compared at regions of low atmospheric absorption. Absolute flux calibration is generally accurate
to within∼20%, though there is never a guarantee that the discrepancy is not higher for a particular observation.
Data quality is primarily limited by the quality of the atmospheric absorption corrections. For
our analysis, we removed spectral regions with very low atmospheric transmission by qualitatively
analyzing individual spectra to decide the transmission threshold, which was typically in the range
of 40–70%. Since source CO emission will lie near or atop atmospheric CO absorption, it is helpful
to observe at significant Doppler shifts. However, it was not always possible to avoid some overlap
between source and telluric lines. Thus, spectra were also obtained at multiple Doppler shifts, when
possible, to ‘fill in’ a complete spectrum (see Table 3.1). Spectra from different nights were averaged
together, after small manual flux adjustments, to create the spectra shown in Figures 3.2 and 3.3.
CO emission showed no significant night-to-night variations in line/continuum ratios, but 20% Pfβ
flux variations were observed for DoAr 44 and TW Hya. Thus, this analysis uses an averaged version
of the Pfβ emission line.
Spectra of TW Hya in a more limited wavelength range, but with significantly higher spectral
resolution (measured FWHM∼5 km s−1) were obtained with Phoenix (Hinkle et al. 2003) on Gemini South. Spectra were obtained on 2006 April 6–7 using the 0.25′′
3.5
Overview of Spectra
The complete set of reduced transitional source spectra is shown in Figures 3.2 and 3.3. We have
also plotted the spectrum of one of our photospheric template stars (discussed further in Section
3.6). Of these disks, nine have detectable CO emission lines: DoAr 44, GM Aur, HD 135344, HD
141569 A, LkCa 15, LkHα330, SR 21, TW Hya, and UX Tau A. Five disks do not have detectable CO emission at our achieved level of sensitivity: CoKu Tau/4, DM Tau, DoAr 21, HD 98800 B, and
HR 4796 A. Note that the line detections for LkCa 15 are weak, but were previously detected across
a larger wavelength range by Najita et al. (2003).
In Figure 3.4, we show the number of disks with CO and Pfβ detections, neither CO nor Pfβ, and Pfβ but no CO, separated by accretion rate. The presence of CO emission is very strongly correlated with the presence of H I Pfβ emission, with DM Tau being the only source with Pfβ but no CO. This is consistent with both emission signatures arising from the inner disk. We also show
that strong accretors always have Pfβemission, and usually have CO emission, while only one of two weak accretors have CO emission. Additionally, for the set of sources with a weakly constrained or
unknown accretion rate, the presence of CO and Pfβis correlated with the strength of Hα. Although HD 141569 shows CO emission and has a low accretion rate, its CO emission does not arise from
the inner disk, as we will show in Section 3.8.2.
CO-emitting sources tend to have relatively structureless continua, while many non-emission
sources have stellar photospheric features. This qualitative grouping is also consistent with IR
photometry, with emission sources having significant excess emission at or near 5 µm, while most non-emission sources have little or no 5 µm excess (e.g., Jayawardhana et al., 1999; Calvet et al., 2002; Furlan et al., 2006; Brown et al., 2007). In Figure 3.5, we plot the distance normalized CO
line flux against M-band excess flux (discussed in Section 3.6). Note that HD 135344, HD 141569,
and HR 4796 A are not included in this plot, for reasons discussed in§3.6. The correlation between these two parameters suggests some coevolution of gas and dust in transitional inner disks.
observed; however, only two of our sources (HD 141569 A and SR 21) have detectable13CO emission.
In addition, if temperatures and densities are high enough and/or if nonthermal processes such as
UV pumping are important, one may expect to detect hot-band (v=2→1) CO emission. This is observed around HD 141569 A and SR 21 but no other stars in our sample; this is in contrast to
classical T Tauri stars, for which strong CO emitting sources have both fundamental and hot-band
emission lines (Najita et al., 2003). CO also appears in absorption around SR 21 (for R(0) and R(1),
and possibly part of the P-branch). This likely arises from cool foreground material, as SR 21 has
a low-inclination (i.e., nearly face-on) disk.
3.6
The 5
µ
m Continuum
Although transitional sources are defined in part by their low excess flux in the near-IR, even a
quick look at their M-band spectra reveals that many are far from photospheric at 5 µm. The infilling of photospheric features is referred to as veiling, and is defined as the ratio of continuum
to photospheric flux (r=Fcont/Fphot). An understanding of the 5µm veiling can be important for measurements of CO line fluxes, as well as interesting in its own right. Veiling measurements are
crucial for accurately determining the dust content of the inner disk, as infrared excess emission can
only be measured precisely if the flux contribution from the stellar photosphere is well characterized.
In addition, observations of veiling at several wavelengths can be used to study the source of the
excess.
Previous studies of veiling in classical T-Tauri systems at shorter wavelengths (e.g., Hartigan
et al., 1989; Folha and Emerson, 1999; Johns-Krull and Valenti, 2001; Muzerolle et al., 2003; Edwards
et al., 2006; Eisner et al., 2007) have revealed at least two sources of veiling. These include a hot
(several thousand K) component, correlated with various accretion proxies and therefore likely arising
in the accretion column, and a cooler component (roughly ∼ 1500 K) well fit as emission from a hot inner disk rim located at the dust sublimation radius. To our knowledge, no M-band veiling
3.6.1
Fitting Method
Determination of veiling has been performed by a number of different methods, including
examina-tion of individual lines (e.g., Johns-Krull and Basri, 1997), correlaexamina-tion analysis (Tonry and Davis,
1979; Guenther and Hessman, 1993; Folha and Emerson, 1999), and point-by-point fitting (Hartigan
et al., 1989). What all methods have in common is the idea that an observed spectrum consists of a
scaled template photosphere and a constant or smoothly varying continuum. Determining the
veil-ing at 5µm presents a unique challenge because of the relatively lower signal-to-noise ratio (S/N), the apparently large contribution from the continuum in many cases, and the complex nature of the
photospheric features. Consequently, the veiling must be determined using a large number of points,
and small numbers of outliers (for example, due to poor sky correction) can artificially cause large
changes in the results. Except for qualitatively distinguishing the end-member cases, it is difficult
to confirm the resulting fits by eye. Therefore, we use a modified version of a standard technique,
which helps us characterize the systematic uncertainties in our fits.
We began by removing the CO emission regions from each spectrum and assumed that the
remaining spectrum consisted of a scaled photospheric template plus a constant term. Our
photo-spheric templates were taken to be observed M-band spectra of standard stars HD 79210 [M0V], HD
79211 [K7V], HD 107146 [G2V] or ROX 43 A [G5], shifted by a velocity vrad and then convolved with a stellar rotation profile with somevsiniand a limb-darkening coefficient of 0.6. We rebinned the standard star spectrum so that its wavelength values matched that of the source. We then
performed a linear least-squares fit—i.e., we found the coefficients of the equationy=Ax+bwhere
y is the observed spectrum,xis the observed photospheric template, Ais a scaling term, andb is a constant continuum. Finally, vrad andvsini were varied to minimize the residual sum of squares. Except for the fact that we solved forvradandvsiniiteratively, rather than explicitly, our method is equivalent to the correlation method; the scaling term in a linear least-squares fit is directly related
to the correlation coefficientR by A=R×σy/σx where σx and σy are the standard deviation of thexandy values, respectively.
spurious results. Problems related to the data themselves include misalignment of flux from
dif-ferent observations or in difdif-ferent orders, improper flat-fielding or non-Gaussian noise (from
sky-subtraction, for example). To minimize these effects we split our spectra into four sections at the
natural boundaries between observations, performed the fits separately on each component, and then
computed a weighted mean. The fits were carefully examined to remove outliers (from bad pixels,
cosmic rays, bad sky-subtraction, etc.) This method has the added benefit that the true uncertainty
in the parameters is reflected in the variation amongst the four measurements. To determine our
final error bars, we computed the ratio of the standard deviation of the four measurements and the
statistical uncertainties of the fit parameters and then used this to scale the statistical uncertainty
in the weighted mean. In short, this amounted to multiplying the purely statistical error bar in the
weighted means by factors of∼2–6×.
A more difficult issue to address is the effect of using an improper template, for example with
a surface gravity or spectral type different from the source. Unlike with the data-related problems,
using an improper template will always act to increase the continuum term, perhaps by as much as
10–15% (Hartigan et al., 1989). To estimate the magnitude of this offset in our own data, we fit one
template, HD 79210, with another, HD 79211. This fit produced a continuum term of about 10%
of the photospheric flux. A correction at this level is somewhat smaller than the size of our error
bars, but should be kept in mind, as it preferentially results in low photospheric fluxes and high
continuum fluxes. We also attempted to fit each spectrum with a variety of templates, including
those listed in Table 3.4, CoKu Tau/4 and a weak-line T Tauri star TWA 8a. In all cases, we chose
the fit with the lowest amount of veiling.
For Herbig Ae/Be stars HD 141569 A and HR 4796 A, a lack of photospheric features at 5
µm made an analysis of this kind impossible. Therefore, these two sources are not included in the analysis. Additionally, we did not observe an F-type standard star, and so there was not an
appropriate template star for HD 135344.
Finally, we wanted to derive actual flux values for the photosphere, so that we could compare the
calibration is not always reliable. Therefore, we used published flux values (see last two columns of
Table 3.4) to estimate an M-band flux by linearly interpolating between the two closest
measure-ments. We then scaled both our photospheric and continuum terms so that their sum equaled the
interpolated flux value.
3.6.2
Veiling Results
Our veiling fits are summarized in Table 3.4. It is interesting to note that the transitional objects
as a group span a large range of M-band veiling values, representing perhaps different ‘hole’ sizes or
different degrees of inner disk clearing/grain-growth. CoKu Tau/4, DM Tau, and HD 98800 B are
consistent with having zero excess flux in the M-band.
In Figure 3.6, we compare our veiling-derived excess fluxes with those obtained by subtracting a
model photospheric flux from the measured M-band flux. HD 141569 A, HR 4796 A, and HD 135344
have been excluded from this plot. The photospheric models are derived from a grid of Kurucz
model atmospheres (Kurucz, 1993), linearly interpolated overTeff and log(g) and adjusted for size and distance according to Table 3.2. We have also corrected for extinction, although corrections
are less than 10% for all but SR 21 (AV=9; Brown et al. 2007) and DoAr 21 (AV=6.2; Chen et al. 1995). Corrections for these sources are 25% and 16%, respectively.
In general, the predicted and observed excesses agree to within the error bars, but for a few sources
the M-band veiling is somewhat different than would be predicted from photometry. The most
likely explanation for much of this discrepancy is the use of an inappropriate template photosphere.
Another possible explanation for the discrepancy could be time variability of the M-band flux.
Near-IR variability has frequently been observed (Carpenter et al., 2001; Eiroa et al., 2002) and could
extend to the M-band. We have also observed variability of the H I recombination lines Pfβand Huǫ
in our own sample. Additionally, the photospheric fluxes themselves could have been overestimated.
This possibility was discussed in Cieza et al. (2005), who showed that T Tauri luminosities are often
based on the false assumption of no J-band veiling, which results in an overestimate of luminosity.
continuum emission from hot gas—perhaps H− (Eisner et al., 2009)—which would also provide
J-band veiling.
A final possible explanation for the observed discrepancy, when fit continua are too high, could
be a third emission source that is neither photospheric nor smooth, such as hot molecular gas.
Although the details of such a source cannot be constrained by our data, we show in Figure 3.7 that
hot molecular gas close to the star can form a pseudo-continuum at some wavelengths. However, it
is unlikely to be the dominant source of veiling, since it produces large-scale structure between 4.5
and 5 µm that is not seen in our data.
It is likely that dust in the inner disk is providing most or all of the continuum veiling at 5µm, and veiling measurements at multiple wavelengths can be used to constrain the dust temperature and
thus location. To our knowledge, only three stars in our sample have published veiling measurements
at other wavelengths: GM Aur, TW Hya, and LkCa 15. In Figure 3.7, we show the excess flux as a
function of wavelength for our measurements and those previously published (Folha and Emerson,
1999; Johns-Krull and Valenti, 2001; Edwards et al., 2006; Espaillat et al., 2008). From the definition
of veiling, we assume:
Fexcess=FX×
rX 1 +rX
(3.1)
where rX is the veiling measured in filter X, andFX is a published photometric flux in that same filter, or an interpolated flux value based on fluxes in neighboring filters. Y-, J- and K-band flux
values are taken from Rucinski and Krautter (1983), Kenyon and Hartmann (1995), Webb et al.
(1999), and Hartmann et al. (2005).
For LkCa 15, we show that a 1600 K blackbody—found to provide a good match to a K-band
veiling spectrum (Espaillat et al., 2008)—underpredicts the M-band excess, and suggests that an
additional emission source may be present. For TW Hya and GM Aur, we show blackbody continua
which best fit the M- and K-band veiling, and best-fit 1400 K blackbody emission. Temperatures
of ∼ 1400 K are characteristic of near-IR continuum emission from cTTs disks (Muzerolle et al., 2003), and correspond well with the expected dust truncation radius, due either to magnetospheric
more consistent with slightly lower temperatures, which could imply that the disk truncation is not
due to dust sublimation, but rather to magnetospheric or dynamic truncation. Finally, for TW Hya,
we also plot the emission expected from the simple disk model of Eisner et al. (2006); this model
predicts slightly lower M-band veiling than is observed, but the results agree to within 2σ.
Since veiling measurements directly measure excess flux, and do not depend strongly on stellar
model parameters (as is the case for SED fitting), they can provide strong constraints on the inner
disk dust mass. A proper analysis of dust fluxes requires careful modeling combined with
measure-ments at a variety of wavelengths, which is beyond the scope of this paper. However, our data can
provide an estimate of the inner disk dust content for very optically thin disks (withτ <1 along all lines of sight from the star), or a lower limit of the dust content for other disks. We assume the disk
is everywhere optically thin to incoming radiation, such that
T(r) = 1
ǫ1/4 R⋆ <