Cochrane
Database of Systematic Reviews
Nutritional supplements for people being treated for active
tuberculosis (Review)
Grobler L, Nagpal S, Sudarsanam TD, Sinclair D
Grobler L, Nagpal S, Sudarsanam TD, Sinclair D.
Nutritional supplements for people being treated for active tuberculosis. Cochrane Database of Systematic Reviews2016, Issue 6. Art. No.: CD006086. DOI: 10.1002/14651858.CD006086.pub4.
T A B L E O F C O N T E N T S
1 HEADER . . . .
1 ABSTRACT . . . .
2 PLAIN LANGUAGE SUMMARY . . . .
4 SUMMARY OF FINDINGS FOR THE MAIN COMPARISON . . . .
7 BACKGROUND . . . .
8 OBJECTIVES . . . .
8 METHODS . . . .
10 RESULTS . . . .
Figure 1. . . 11
Figure 2. . . 13
20 ADDITIONAL SUMMARY OF FINDINGS . . . . 24 DISCUSSION . . . . 25 AUTHORS’ CONCLUSIONS . . . . 25 ACKNOWLEDGEMENTS . . . . 26 REFERENCES . . . . 32 CHARACTERISTICS OF STUDIES . . . . 100 DATA AND ANALYSES . . . . Analysis 1.1. Comparison 1 Macronutrient supplementation, Outcome 1 Death (1 year of follow-up). . . 107
Analysis 1.2. Comparison 1 Macronutrient supplementation, Outcome 2 Cured (at 6 months). . . 109
Analysis 1.3. Comparison 1 Macronutrient supplementation, Outcome 3 Treatment completion. . . 110
Analysis 1.4. Comparison 1 Macronutrient supplementation, Outcome 4 Sputum negative at 8 weeks. . . 111
Analysis 1.5. Comparison 1 Macronutrient supplementation, Outcome 5 Mean weight gain. . . 112
Analysis 1.6. Comparison 1 Macronutrient supplementation, Outcome 6 Change in maximum grip strength (kg). . 113
Analysis 1.7. Comparison 1 Macronutrient supplementation, Outcome 7 Change in quality of life score. . . 114
Analysis 2.1. Comparison 2 High cholesterol (850 mg/day) versus low cholesterol (250 mg/day) diet, Outcome 1 Sputum-culture positive. . . 115
Analysis 3.1. Comparison 3 Multivitamin and trace element tablets versus placebo, Outcome 1 Death during follow-up in adults and children. . . 116
Analysis 3.2. Comparison 3 Multivitamin and trace element tablets versus placebo, Outcome 2 Tuberculosis treatment completion. . . 117
Analysis 3.3. Comparison 3 Multivitamin and trace element tablets versus placebo, Outcome 3 Sputum-smear or sputum-culture positive at 1 month. . . 118
Analysis 3.4. Comparison 3 Multivitamin and trace element tablets versus placebo, Outcome 4 Sputum-smear or sputum-culture positive at 2 months. . . 119
Analysis 3.5. Comparison 3 Multivitamin and trace element tablets versus placebo, Outcome 5 Clearance of chest X-ray at 6 months. . . 120
Analysis 3.6. Comparison 3 Multivitamin and trace element tablets versus placebo, Outcome 6 Weight. . . 121
Analysis 3.7. Comparison 3 Multivitamin and trace element tablets versus placebo, Outcome 7 Anthropometrical changes at follow-up. . . 122
Analysis 3.8. Comparison 3 Multivitamin and trace element tablets versus placebo, Outcome 8 Mean change in handgrip strength (kg). . . 124
Analysis 4.1. Comparison 4 Vitamin A versus placebo, Outcome 1 Children: mean serum retinol (normal range > 20 µg/L). . . 125
Analysis 4.2. Comparison 4 Vitamin A versus placebo, Outcome 2 Adults: mean serum retinol (normal range > 70 µmol/L). . . 126
Analysis 4.3. Comparison 4 Vitamin A versus placebo, Outcome 3 Death. . . 127
Analysis 4.4. Comparison 4 Vitamin A versus placebo, Outcome 4 Treatment completion. . . 128
Analysis 4.5. Comparison 4 Vitamin A versus placebo, Outcome 5 Symptomatic at 6 weeks. . . 129
Analysis 4.6. Comparison 4 Vitamin A versus placebo, Outcome 6 Sputum-smear and sputum-culture positive during follow-up. . . 129
Analysis 4.8. Comparison 4 Vitamin A versus placebo, Outcome 8 Body fat (%). . . 132
Analysis 5.1. Comparison 5 Zinc versus placebo, Outcome 1 Serum zinc level (normal range > 10.7 µmol/L). . . . 133
Analysis 5.2. Comparison 5 Zinc versus placebo, Outcome 2 Death by 6 to 8 months. . . 135
Analysis 5.3. Comparison 5 Zinc versus placebo, Outcome 3 Death by 6 to 8 months (subgrouped by HIV status). . 136
Analysis 5.4. Comparison 5 Zinc versus placebo, Outcome 4 Treatment completion at 6 months. . . 137
Analysis 5.5. Comparison 5 Zinc versus placebo, Outcome 5 Sputum-smear or sputum-culture positive during follow-up. . . 138
Analysis 5.6. Comparison 5 Zinc versus placebo, Outcome 6 Clearance of chest X-ray at 6 months. . . 139
Analysis 5.7. Comparison 5 Zinc versus placebo, Outcome 7 Weight at follow-up. . . 140
Analysis 5.8. Comparison 5 Zinc versus placebo, Outcome 8 BMI (kg/m²). . . 141
Analysis 5.9. Comparison 5 Zinc versus placebo, Outcome 9 Body fat (%). . . 142
Analysis 5.10. Comparison 5 Zinc versus placebo, Outcome 10 Weight-for-age z score. . . 143
Analysis 5.11. Comparison 5 Zinc versus placebo, Outcome 11 BMI-for-age z score. . . 143
Analysis 5.12. Comparison 5 Zinc versus placebo, Outcome 12 Height-for-age z score at follow-up. . . 144
Analysis 6.1. Comparison 6 Zinc plus vitamin A versus placebo, Outcome 1 Death by 6 months. . . 145
Analysis 6.2. Comparison 6 Zinc plus vitamin A versus placebo, Outcome 2 Treatment completion at 6 months. . . 146
Analysis 6.3. Comparison 6 Zinc plus vitamin A versus placebo, Outcome 3 Sputum-smear and sputum-culture positive during follow-up. . . 147
Analysis 6.4. Comparison 6 Zinc plus vitamin A versus placebo, Outcome 4 Body weight (kg). . . 149
Analysis 6.5. Comparison 6 Zinc plus vitamin A versus placebo, Outcome 5 BMI (kg/m²). . . 150
Analysis 6.6. Comparison 6 Zinc plus vitamin A versus placebo, Outcome 6 Mid upper arm circumference (cm). . . 151
Analysis 6.7. Comparison 6 Zinc plus vitamin A versus placebo, Outcome 7 Biceps skinfold thickness (mm). . . . 152
Analysis 6.8. Comparison 6 Zinc plus vitamin A versus placebo, Outcome 8 Triceps skinfold thickness (mm). . . . 152
Analysis 6.9. Comparison 6 Zinc plus vitamin A versus placebo, Outcome 9 Subscapular skinfold thickness (mm). . 153
Analysis 6.10. Comparison 6 Zinc plus vitamin A versus placebo, Outcome 10 Suprailiac skinfold thickness (mm). . 154
Analysis 6.11. Comparison 6 Zinc plus vitamin A versus placebo, Outcome 11 Body fat (%). . . 155
Analysis 6.12. Comparison 6 Zinc plus vitamin A versus placebo, Outcome 12 Fat mass (kg). . . 156
Analysis 6.13. Comparison 6 Zinc plus vitamin A versus placebo, Outcome 13 Karnofsky score. . . 156
Analysis 7.1. Comparison 7 Vitamin D versus placebo or no supplement, Outcome 1 Serum vitamin D levels (nmol/L). 157 Analysis 7.2. Comparison 7 Vitamin D versus placebo or no supplement, Outcome 2 Death during follow-up (2 to 12 months). . . 158
Analysis 7.3. Comparison 7 Vitamin D versus placebo or no supplement, Outcome 3 Death during follow-up (2 to 12 months). . . 160
Analysis 7.4. Comparison 7 Vitamin D versus placebo or no supplement, Outcome 4 Cure at 6 months. . . 161
Analysis 7.5. Comparison 7 Vitamin D versus placebo or no supplement, Outcome 5 Tuberculosis score. . . 162
Analysis 7.6. Comparison 7 Vitamin D versus placebo or no supplement, Outcome 6 Sputum-smear or sputum-culture positive. . . 163
Analysis 7.7. Comparison 7 Vitamin D versus placebo or no supplement, Outcome 7 Body mass index. . . 165
Analysis 7.8. Comparison 7 Vitamin D versus placebo or no supplement, Outcome 8 Body weight (kg). . . 166
Analysis 7.9. Comparison 7 Vitamin D versus placebo or no supplement, Outcome 9 Karnofsky score at 8 weeks. . 167
Analysis 8.1. Comparison 8 Arginine versus placebo, Outcome 1 Death during treatment. . . 168
Analysis 8.2. Comparison 8 Arginine versus placebo, Outcome 2 Cured at 6/8 months. . . 169
Analysis 8.3. Comparison 8 Arginine versus placebo, Outcome 3 Sputum-smear or sputum-culture positive. . . . 170
Analysis 8.4. Comparison 8 Arginine versus placebo, Outcome 4 Cough. . . 171
Analysis 8.5. Comparison 8 Arginine versus placebo, Outcome 5 Weight gain > 10%. . . 172 Analysis 9.1. Comparison 9 Vitamin E plus selenium versus placebo, Outcome 1 Sputum-smear positive at follow-up. 173 173 ADDITIONAL TABLES . . . .
183 APPENDICES . . . .
191 WHAT’S NEW . . . .
192 HISTORY . . . .
192 CONTRIBUTIONS OF AUTHORS . . . .
193 DECLARATIONS OF INTEREST . . . .
193 DIFFERENCES BETWEEN PROTOCOL AND REVIEW . . . .
[Intervention Review]
Nutritional supplements for people being treated for active
tuberculosis
Liesl Grobler1, Sukrti Nagpal2, Thambu D Sudarsanam3, David Sinclair2
1Centre for Evidence-based Health Care, Faculty of Medicine and Health Sciences, Stellenbosch University, Cape Town, South Africa. 2Department of Clinical Sciences, Liverpool School of Tropical Medicine, Liverpool, UK.3Medicine Unit 2 and Clinical Epidemiology Unit, Christian Medical College, Vellore, India
Contact address: David Sinclair, Department of Clinical Sciences, Liverpool School of Tropical Medicine, Liverpool, UK. [email protected].
Editorial group:Cochrane Infectious Diseases Group.
Publication status and date:New search for studies and content updated (no change to conclusions), published in Issue 6, 2016.
Citation: Grobler L, Nagpal S, Sudarsanam TD, Sinclair D. Nutritional supplements for people being treated for active tuberculosis. Cochrane Database of Systematic Reviews2016, Issue 6. Art. No.: CD006086. DOI: 10.1002/14651858.CD006086.pub4.
Copyright © 2016 The Authors. Cochrane Database of Systematic Reviews published by John Wiley & Sons, Ltd. on behalf of The Cochrane Collaboration. This is an open access article under the terms of theCreative Commons Attribution-Non-Commercial Licence, which permits use, distribution and reproduction in any medium, provided the original work is properly cited and is not used for commercial purposes.
A B S T R A C T
Background
Tuberculosis and malnutrition are linked in a complex relationship. Tuberculosis may cause undernutrition through increased metabolic demands and decreased intake, and nutritional deficiencies may worsen the disease, or delay recovery by depressing important immune functions. At present, there is no evidence-based nutritional guidance for adults and children being treated for tuberculosis.
Objectives
To assess the effects of oral nutritional supplements in people being treated with antituberculous drug therapy for active tuberculosis.
Search methods
We searched the Cochrane Infectious Disease Group Specialized Register, Cochrane Central Register of Controlled Trials (CENTRAL; Issue 1, 2016), MEDLINE (from 1946 to 4 February 2016), EMBASE (from 1980 to 4 February 2016), LILACS (from 1982 to 4 February 2016), themetaRegister of Controlled Trials (mRCT), the World Health Organization (WHO) International Clinical Trials Registry Platform (ICTRP), and theIndian Journal of Tuberculosisup to 4 February 2016, and checked the reference lists of all included studies.
Selection criteria
Randomized controlled trials that compared any oral nutritional supplement given for at least four weeks with no nutritional interven-tion, placebo, or dietary advice only for people being treated for active tuberculosis. The primary outcomes of interest were all-cause death, and cure at six and 12 months.
Data collection and analysis
Main results
Thirty-five trials, including 8283 participants, met the inclusion criteria of this review.
Macronutrient supplementation
Six trials assessed the provision of free food, or high-energy supplements. Only two trials measured total dietary intake, and in both trials the intervention increased calorie consumption compared to controls.
The available trials were too small to reliably prove or exclude clinically important benefits on mortality (RR 0.34, 95% CI 0.10 to 1.20; four trials, 567 participants,very low quality evidence), cure (RR 0.91, 95% CI 0.59 to 1.41; one trial, 102 participants,very low quality evidence), or treatment completion (data not pooled; two trials, 365 participants,very low quality evidence).
Supplementation probably produces a modest increase in weight gain during treatment for active tuberculosis, although this was not seen consistently across all trials (data not pooled; five trials, 883 participants,moderate quality evidence). Two small studies provide some evidence that quality of life may also be improved but the trials were too small to have much confidence in the result (data not pooled; two trials, 134 participants,low quality evidence).
Micronutrient supplementation
Six trials assessed multi-micronutrient supplementation in doses up to 10 times the dietary reference intake, and 18 trials assessed single or dual micronutrient supplementation.
Routine multi-micronutrient supplementation may have little or no effect on mortality in HIV-negative people with tuberculosis (RR 0.86, 95% CI 0.46 to 1.6; four trials, 1219 participants,low quality evidence), or HIV-positive people who are not taking antiretroviral therapy (RR 0.92, 95% CI 0.69 to 1.23; three trials, 1429 participants,moderate quality evidence). There is insufficient evidence to know if supplementation improves cure (no trials), treatment completion (RR 0.99, 95% CI 0.95 to 1.04; one trial, 302 participants, very low quality evidence), or the proportion of people who remain sputum positive during the first eight weeks (RR 0.92, 95% CI 0.63 to 1.35; two trials, 1020 participants,very low quality evidence). However, supplementation may have little or no effect on weight gain during treatment (data not pooled; five trials, 2940 participants,low quality evidence), and no studies have assessed the effect on quality of life.
Plasma levels of vitamin A appear to increase following initiation of tuberculosis treatment regardless of supplementation. In contrast, supplementation probably does improve plasma levels of zinc, vitamin D, vitamin E, and selenium, but this has not been shown to have clinically important benefits. Of note, despite multiple studies of vitamin D supplementation in different doses, statistically significant benefits on sputum conversion have not been demonstrated.
Authors’ conclusions
There is currently insufficient research to know whether routinely providing free food, or energy supplements improves tuberculosis treatment outcomes, but it probably improves weight gain in some settings.
Although blood levels of some vitamins may be low in people starting treatment for active tuberculosis, there is currently no reliable evidence that routinely supplementing above recommended daily amounts has clinical benefits.
P L A I N L A N G U A G E S U M M A R Y
Nutritional supplements for people being treated for active tuberculosis
Cochrane researchers conducted a review of the effects of nutritional supplements for people being treated for tuberculosis. After searching for relevant studies up to 4 February 2016, they included 35 relevant studies with 8283 participants. Their findings are summarized below.
What is active tuberculosis and how might nutritional supplements work?
People with tuberculosis are often malnourished, and malnourished people are at higher risk of developing tuberculosis as their immune system is weakened. Nutritional supplements could help people recover from the illness by strengthening their immune system, and by improving weight gain, and muscle strength, allowing them to return to an active life. Good nutrition requires a daily intake of macronutrients (carbohydrate, protein, and fat), and micronutrients (essential vitamins and minerals).
What the research says
Effect of providing nutritional supplements to people being treated for tuberculosis
We currently don’t know if providing free food to tuberculosis patients, as hot meals or ration parcels, reduces death or improves cure (very low quality evidence). However, it probably does improve weight gain in some settings (moderate quality evidence), and may improve quality of life (low quality evidence).
Routinely providing multi-micronutrient supplements may have little or no effect on deaths in HIV-negative people with tuberculosis (low quality evidence), or HIV-positive people who are not taking anti-retroviral therapy (moderate quality evidence). We currently don’t know if micronutrient supplements have any effect on tuberculosis treatment outcomes (very low quality evidence), but they may have no effect on weight gain (low quality evidence). No studies have assessed the effect on quality of life.
Plasma levels of vitamin A appear to increase after starting tuberculosis treatment regardless of supplementation. In contrast, supple-mentation probably does improve plasma levels of zinc, vitamin D, vitamin E, and selenium, but this has not been shown to have clinically important benefits. Despite multiple studies of vitamin D supplementation in different doses, statistically significant benefits on sputum conversion have not been demonstrated.
Authors’ conclusions
S U M M A R Y O F F I N D I N G S F O R T H E M A I N C O M P A R I S O N [Explanation]
Food provision compared with nutritional advice or no intervention for patients with active tuberculosis
Patient or population:adults and children with active tuberculosis
Settings:low- and m iddle-incom e countries
Intervention:calorie supplem entation as f ood or energy dense supplem ents
Comparison:nutritional advice, m icronutrient supplem ent, or no intervention
Outcomes Illustrative comparative risks* (95% CI) Relative effect
(95% CI)
Number of participants (trials)
Quality of the evidence (GRADE)
Comments
Assumed risk Corresponding risk
Standard care Increased calorie
in-take
Death
(at 6 m onths)
3 per 100 1 per 100
(0 to 4)
RR 0.34
(0.10 to 1.20)
567 (4 trials)
⊕
very low1,2,3
We don’t know if
f ood supplem entation reduces m ortality f rom tuberculosis in f ood-in-secure settings
Cured
(at 6 m onths)
48 per 100 44 per 100
(28 to 68)
RR 0.91
(0.59 to 1.41)
102 (1 trial)
⊕
very low2,3,4
We don’t know if
f ood supplem entation increases cure in tuber-culosis patients
Treatment completion
(at 6 m onths)
79 per 100 85 per 100
(70 to 100)
Not pooled 365
(2 trials)
⊕
very low3,5,6
We don’t know if
Sputum negative
(at 8 weeks)
76 per 100 82 per 100
(65 to 100)
RR 1.08
(0.86 to 1.37)
222 (3 trials)
⊕
very low3,5,6
We don’t know if
f ood supplem entation reduces the duration of sputum positivity in tu-berculosis patients
M ean weight gain
(At 8 weeks)
- - Not pooled 883
(5 trials)
⊕⊕⊕
moderate7,8
Supplem entation prob-ably increases weight gain during treatm ent
Quality of life
(At 8 weeks)
- - Not pooled 134
(2 trials)
⊕⊕
low9,10
Supplem entation m ay increase quality of lif e scores during the f irst 2 m onths of treatm ent
* Theassumed riskis taken f rom the m ean risk in the control groups in the included studies. Thecorresponding risk(and its 95% CI) is based on the assum ed risk in the com parison group and therelative effectof the intervention (and its 95% CI).
Abbreviations:CI = conf idence interval; RR = risk ratio; GRADE = Grading of Recom m endations Assessm ent, Developm ent and Evaluation
GRADE Working Group grades of evidence
High quality:f urther research is very unlikely to change our conf idence in the estim ate of ef f ect.
M oderate quality:f urther research is likely to have an im portant im pact on our conf idence in the estim ate of ef f ect and m ay change the estim ate.
Low quality:f urther research is very likely to have an im portant im pact on our conf idence in the estim ate of ef f ect and is likely to change the estim ate.
Very low quality:we are very uncertain about the estim ate.
1Three trials reported som e deaths during the 6 m onths of treatm ent (J ahnavi 2010 IND;J erem iah 2014 TZA;Sudarsanam
2010 IND), and 1 reported that no deaths occurred (M artins 2009 TLS). The trials were conducted in Tanzania, Tim or-Leste, and India in participants with signs of undernutrition.M artins 2009 TLSgave a daily hot m eal,Sudarsanam 2010 INDgave m onthly ration packs,J ahnavi 2010 INDgave daily locally appropriate supplem ents, andJ erem iah 2014 TZAgave high energy m ultivitam in enriched biscuits.
2Downgraded by 1 f or indirectness: trials are only available f rom lim ited settings. Food supplem entation would plausibly have its biggest ef f ect in highly f ood-insecure or em ergency settings which are not ref lected in these trials.
3Downgraded by 2 f or im precision: the trials and m eta-analysis are signif icantly underpowered to either detect or exclude an
ef f ect if it exists.
4Data on successf ul cure at 6 m onths is only available f rom Sudarsanam 2010 INDwhich random ized tuberculosis patients
5Two trials report on tuberculosis treatm ent com pletion at 6 m onths (J ahnavi 2010 IND;M artins 2009 TLS). One trial was
conducted in India and 1 in Tim or-Leste in participants with signs of undernutrition. Both trials gave daily locally appropriate supplem ents.
6Downgraded by 1 f or inconsistency.J ahnavi 2010 INDf ound a statistically signif icant benef it while the larger trial,M artins
2009 TLS, did not.
7Five studies reported m easures of weight gain but at dif f erent tim e-points, which prevented m eta-analysis.
8Downgraded by 1 f or inconsistency. Praygod 2011b TZAincluded only HIV-positive patients and although the trend was towards a benef it this did not reach statistical signif icance.J erem iah 2014 TZA noted a greater increase in m ean weight gain in the supplem ented group com pared to the non-supplem ented group af ter 8 weeks; however the dif f erence was not appreciable (1.09 kg, P < 0.6, authors’ own f igures). The 3 other trials all dem onstrated clinically im portant benef its. 9Downgraded by 1 f or indirectness. Only 2 sm all trials, 1 f rom Singapore (Paton 2004 SGP) and 1 f rom India (J ahnavi 2010
IND) report quality of lif e scores. The results can not be generalized to other populations or settings with any certainty. 10Downgraded by 1 f or im precision. The presented data appear highly skewed and could not be pooled.
B A C K G R O U N D
Description of the condition
Tuberculosis is an infection caused by the bacterium Mycobac-terium tuberculosis,which is spread from person to person by in-halation of respiratory droplets (Harries 2006). In 2013, the World Health Organization (WHO) estimated that there were nine mil-lion new cases of active tuberculosis worldwide, and 1.5 milmil-lion deaths (WHO 2014).
Most people who are infected withM. tuberculosisdevelop what is known as latent tuberculosis. People with latent tuberculosis are infected with the bacteriumMycobacterium tuberculosis, but the infection is contained by their immune system. These people re-main well and do not exhibit any clinical signs or symptoms of ill-ness (Barry 2009). The immune response to infection is complex, it initially involves the uptake of the bacterium into macrophage cells as part of the non-specific ’innate’ immune response, and later recruitment of both B- and T-lymphocytes of the cellular immune response (Schluger 1998). These cells isolate the bacterium as a granuloma, typically in the lung (Saunders 2007).
Active tuberculosis occurs when the infection is no longer con-tained by the immune system, and can occur at any time follow-ing infection. The lifetime risk of conversion from latent to active tuberculosis is around 5% to 10% in an otherwise healthy popula-tion (Harries 2006), but this can rise to around 50% in people with severe impairment of their immune system, such as occurs with human immunodeficiency virus (HIV) infection (Zumla 2000; Aaron 2004).
Tuberculosis most commonly affects the lungs (pulmonary tuber-culosis), but can also spread to affect the central nervous system, lymphatic system, circulatory system, genitourinary system, and bones and joints. The symptoms of active pulmonary tuberculosis include cough, chest pain, fever, night sweats, weight loss, and sometimes coughing up blood (Harries 2006).
Tuberculosis is treated with a combination of antibiotic drugs (antituberculous therapy), which must be taken for a period of at least six months to ensure success (WHO 2010). If left untreated, around half of those with active tuberculosis will die of the disease (Corbett 2003). With adequate treatment the mortality is around 5% globally (WHO 2009), although this may be higher in HIV-positive people (Aaron 2004). The WHO target for successful cure in national tuberculosis control programmes is 85% (WHO 2009).
Throughout the world, poor nutritional status is more common in people with active tuberculosis than in people without tuber-culosis (van Lettow 2003), and weight loss, including loss of lean body mass, is a well-recognized symptom of the disease. Cohort and cross-sectional studies have suggested that active tuberculosis is commonly associated with low serum levels of important mi-cronutrients such as zinc (Taneja 1990), and vitamins A, C, D, and E (Davies 1985;Plit 1998;Nnoaham 2008). However, the
measurement of serum vitamin levels during an acute infection, such as tuberculosis, is known to be unreliable, as transient abnor-malities can occur (Louw 1992).
The daily nutritional requirements for healthy individuals of all age groups are well described (Meyers 2006), and it is unlikely that people with active tuberculosis would require less than these rec-ommended amounts. The two important questions are therefore whether tuberculosis patients require more, and whether these in-creased requirements should be provided as part of routine health care.
The effects of supplementation in people with HIV (but without tuberculosis) is covered in two other Cochrane Reviews (Irlam 2010;Grobler 2013).
Description of the intervention
Nutritional requirements can be broadly divided into macronutri-ents (carbohydrate, protein, and fat) and micronutrimacronutri-ents (essential vitamins and trace elements).
Macronutrients
Each day the average 70 kg male requires approximately 2500 kilocalories (kcal) of energy to maintain body weight and compo-sition; ideally consumed as 55% carbohydrate, 15% protein, and 30% fat (Meyers 2006).
If it was shown that patients with active tuberculosis required ad-ditional macronutrients; these could be purchased and consumed by the patient simply following nutritional advice. However, in many situations, especially in low- and middle-income countries, the patient may not be able to acquire this additional food due to economic hardship through illness and loss of work, or due to local food insecurity (Kamolratanakul 1999;Wyss 2001). In these situations healthcare services might provide increased nutri-ents through free provision of meals, take home rations, or specific high energy supplements. In many crisis or low-income settings this already happens and the World Food Programme (WFP) in particular is involved in many food support programmes for tu-berculosis patients (WFP 2007).
Micronutrients
The daily micronutrient requirements for an adult male are given inAppendix 1. These are usually expressed as the ’dietary reference intake’ (DRI), and this is different for each individual micronu-trient (Meyers 2006).
In trials of macronutrient and micronutrient interventions two important factors should be noted.
• The intervention is a supplement and does not represent the total daily intake of that nutrient.
• Any benefit derived from the intervention is likely to be dependant on the initial nutritional status of the patient. In order to accurately interpret data it is therefore essential to con-sider both the baseline nutritional status, and the overall nutri-tional intake of the patients.
How the intervention might work
Tuberculosis and undernutrition interact in a two-way process. Tuberculosis can lead to weight loss and micronutrient deficien-cies by increasing nutritional requirements, by changing metabolic processes, or by decreasing appetite and causing a reduction in food intake (Macallan 1999). Alternatively, low body mass index (BMI; a measure of weight for height that is indicative of nu-tritional status) and some micronutrient deficiencies can depress cell-mediated immunity, the key host defence against tuberculo-sis, increasing the susceptibility to active tuberculosis and delaying recovery (Chandra 1996;Zachariah 2002;Cegielski 2004). The micronutrients which have received the most attention are the following.
• Vitamin A, which is involved in both T- and B-lymphocyte function, macrophage activity and the generation of antibody responses (Semba 1998;Stephensen 2001).
• Vitamin D, which is involved in the function of macrophages, a key component of the immune response to tuberculosis (Wintergerst 2007).
• Vitamin E, which has anti-oxidant properties and may protect against T-lympocyte failure due to oxidative stress (Wintergerst 2007).
• Zinc, which is necessary for adequate functioning of many aspects of human immunity (Shankar 1998).
• Selenium; which is essential for both cell-mediated and humoral immunity (Arthur 2003).
Nutritional interventions, in people with active tuberculosis, therefore have the potential to do the following.
• Improve tuberculosis treatment outcomes; through restoration of cell-mediated immunity, increasing the
individuals’ ability to fight the infection and hastening recovery from the illness.
• Promote nutritional recovery; with improved weight gain, restoration of muscle strength, function, and quality of life. Nutritional recovery is of great importance in tuberculosis treatment, allowing the patient to return to work, and recover economically as well as physically.
Food may also be given to people with tuberculosis for quite dif-ferent reasons, such as; to promote adherence to treatment, or to
mitigate the financial consequences of prolonged illness. Another Cochrane Review is addressing the use of food to promote adher-ence (Lutge 2009).
In addition, it is important to note that pathogens such as tubercu-losis also require certain micronutrients for their own metabolism, and greater availability of these nutrients through supplementa-tion could encourage their growth. There is some evidence for this in the case of iron (Lounis 2001), and so nutritional interventions cannot be considered entirely benign.
Why it is important to do this review
There is currently no evidence-based guidance on food provision or supplementation for adults or children being treated for tuber-culosis, with or without concurrent HIV infection. This Cochrane Review seeks to assess the evidence for the effectiveness of differ-ent food and nutritional supplemdiffer-ents in helping people to gain weight and recover from tuberculosis, and highlight where more research might be needed.
O B J E C T I V E S
To assess the effects of oral nutritional supplements in people being treated with antituberculous drug therapy for active tuberculosis.
M E T H O D S
Criteria for considering studies for this review
Types of studies
Randomized controlled trials (RCTs).
Types of participants
Children or adults being treated for active tuberculosis with or without concurrent HIV infection, and with or without a diagnosis of being underweight, malnourished, or nutrient deficient.
Types of interventions
Intervention
Any oral macro or micronutrient supplement given for at least four weeks.
Control
No nutritional intervention, placebo, or dietary advice alone.
Types of outcome measures
Primary outcomes • All-cause death.
• Cure (completed treatment and smear or sputum-culture negative) at six and 12 months.
Secondary outcomes • Completion of treatment.
• Sputum positive at follow-up.
• Self-reported recovery from illness or resolution of symptoms.
• Change in weight, skinfold thickness, or other measure of lean or total mass.
• Any measure of growth in children.
• Any measures of physical functioning, quality of life, or ability to return to work.
• Total calorie intake.
• Micronutrient levels before and after supplementation. We intended to include cure assessed at six and 12 months, as is customary. For other outcome measures, we accepted data pre-sented at any time point.
Search methods for identification of studies
We attempted to identify all relevant trials regardless of language or publication status (published or unpublished, in press, or in progress).
Electronic searches
We searched the following databases using the search terms and strategy described inAppendix 2.
• Cochrane Infectious Disease Group Specialized Register.
• Cochrane Central Register of Controlled Trials (CENTRAL; Issue 1, 2016).
• MEDLINE (from 1946 to 4 February 2016).
• EMBASE (from 1980 to 4 February 2016).
• LILACS (from 1982 to 4 February 2016).
We checked themetaRegister of Controlled Trials (mRCT) and the World Health Organization (WHO) International Clinical Trials Registry Platform (ICTRP) (www.who.int/ictrp/search/en) up to 4 February 2016, using ’tuberculosis’ and ’supplementation’ as search terms.
In addition we searched theIndian Journal of Tuberculosisusing the keywords given in the search strategy (Appendix 2) on 4 February 2016.
Searching other resources
We also checked the reference lists of all studies identified by the above methods.
Data collection and analysis
Selection of studies
Two review authors (Liesl Grobler (LG) and Sukrti Nagpal (SN)/ Thambu Sudarsanam (TS)) independently screened all citations and abstracts identified in the search for potentially eligible stud-ies. Full reports of potentially eligible studies were obtained and assessed for inclusion in the review by the same authors using a pre-designed eligibility form based on the inclusion criteria. Where it was unclear whether a study was eligible for the review, we at-tempted to contact the authors for clarification. We resolved dif-ferences in opinion by discussion and, where necessary, by discus-sion with a fourth author (David Sinclair). We screened all papers for multiple publications. We excluded studies that did not meet the criteria and documented the reasons for their exclusion.
Data extraction and management
Two review authors (LG and SN) independently extracted data using a tailored data extraction form. We extracted data on study design, participant characteristics, interventions, and outcomes. For dichotomous data, we extracted the number of participants with the outcome and the total number analysed. For continuous data, we extracted the arithmetic mean and standard deviation (SD) for each group. If medians were used, we also extracted the ranges where possible. If there was skewed continuous data, we planned to extract geometric means where presented by the trial author(s). We resolved any discrepancies regarding extracted data by discussion between the review authors.
Assessment of risk of bias in included studies
risk of bias. Where our judgment was ’unclear’, we attempted to contact the trial authors for clarification.
Measures of treatment effect
We compared interventions using risk ratios (RR) for dichotomous data, and mean difference (MD) values for continuous data. We presented all results with 95% confidence intervals (CIs).
Unit of analysis issues
We split trials that included more than two comparison groups and analysed them as individual pair-wise comparisons. When we conducted meta-analysis we ensured that we did not count participants and cases in the placebo group more than once, by dividing the placebo cases and participants evenly between the intervention groups.
Dealing with missing data
If data from the trial reports were insufficient, unclear, or missing, we attempted to contact the trial authors for additional informa-tion.
Assessment of heterogeneity
We assessed heterogeneity amongst trials by inspection of the forest plots (to detect overlapping CIs), the I² statistic with a level of 50% to denote moderate levels of heterogeneity, and application of the Chi² test with a P value of 0.10 to indicate appreciable heterogeneity.
Assessment of reporting biases
We planned to assess the likelihood of publication bias by exam-ining the funnel plots for asymmetry. However, there were too few trials to make this assessment meaningful.
Data synthesis
We analysed the data using Review Manager (RevMan) (RevMan 2014). Using pair-wise meta-analyses we compared the treatments. We stratified meta-analyses by time-point or HIV status where appropriate.
When there was no statistically significant heterogeneity we used the fixed-effect meta-analysis model. When we observed moderate statistically significant heterogeneity within groups that we could not explain by subgroup or sensitivity analyses we used a random-effects meta-analysis model to synthesize the data. When a pooled meta-analysis result was considered to be meaningless because of clinical or substantial statistical heterogeneity the results are pre-sented in a forest plot without a pooled estimate of effect. Data presented as medians and ranges are presented in tables and described in the narrative. Highly skewed continuous data (where the SDs were larger than the means) are only presented in tables.
Subgroup analysis and investigation of heterogeneity
Due to the small number of included trials or each comparison, the investigation of heterogeneity was not necessary or possible. In future updates of this Cochrane review we may perform subgroup analyses by: HIV status, nutritional status at baseline, presence of co-morbidities, and specific micronutrient level at baseline.
Sensitivity analysis
We have planned to perform a sensitivity analysis to investigate the robustness of the results to the ’Risk of bias’ components. However, there were too few included trials for each comparison for this to be possible.
R E S U L T S
Description of studies
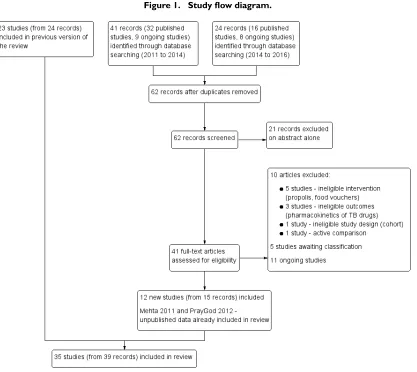
Results of the search
Figure 1. Study flow diagram.
Included studies
Participants
The 35 trials included 8285 participants. Twenty-eight trials in-cluded only adults being treated for pulmonary tuberculosis, and three trials also included adults with extrapulmonary tuberculosis (Wejse 2008 GNB;Jahnavi 2010 IND;Sudarsanam 2010 IND). Likewise of four studies in children, one included only pulmonary tuberculosis (Hanekom 1997 ZAF), and three also included extra-pulmonary tuberculosis (Morcos 1998 EGY;Mehta 2011 TZA; Lodha 2014 IND).
HIV status
Eleven trials specifically included people with HIV, and presented some results separately for HIV positive and HIV negative
trial was stopped early when antiretrovirals became locally avail-able (Semba 2007 MWI). Eleven trials excluded people with HIV infection (Hanekom 1997 ZAF;Paton 2004 SGP;Pérez-Guzmán 2005 MEX;Nursyam 2006 IDN;Armijos 2010 MEX;Jahnavi 2010 IND;Paliliewu 2013 IDN;Lodha 2014 IND;Daley 2015 IND;Farazi 2015 IRN;Mily 2015 BGD), and eight trials did not mention HIV infection (Morcos 1998 EGY;Karyadi 2002 IDN; Seyedrezazadeh 2006 IRN;Martins 2009 TLS;Pakasi 2010 IDN; Kota 2011 IND;Ginawi 2013 IND;Singh 2013 IND).
Study site
Trials were undertaken in the following locations.
• Africa: Egypt (Morcos 1998 EGY), Guinnea-Bissau (Wejse 2008 GNB), Ethiopia (Schön 2003 ETH;Schön 2011 ETH), Tanzania (Range 2005 TZA;Villamor 2008 TZA;Mehta 2011 TZA;Praygod 2011b TZA;Praygod 2011a TZA;Jeremiah 2014 TZA), Malawi (Semba 2007 MWI), Nigeria (Lawson 2010 NGA), and South Africa (Hanekom 1997 ZAF;Visser 2011 ZAF).
• Asia: Singapore (Paton 2004 SGP), Indonesia (Karyadi 2002 IDN;Nursyam 2006 IDN;Pakasi 2010 IDN;Paliliewu 2013 IDN;Ralph 2013 IDN), Iran (Seyedrezazadeh 2006 IRN; Farazi 2015 IRN), Bangladesh (Mily 2015 BGD), and India (Jahnavi 2010 IND;Sudarsanam 2010 IND;Kota 2011 IND; Ginawi 2013 IND;Singh 2013 IND;Lodha 2014 IND;Daley 2015 IND).
• Oceania: Timor Leste (Martins 2009 TLS).
• North America: Mexico (Pérez-Guzmán 2005 MEX; Armijos 2010 MEX).
• Europe: UK (Martineau 2011 GBR) and Georgia (Tukvadze 2015 GEO).
Interventions
Seven trials assessed macronutrient supplementation (Paton 2004 SGP; Pérez-Guzmán 2005 MEX; Martins 2009 TLS; Jahnavi 2010 IND; Sudarsanam 2010 IND; Praygod 2011b TZA; Jeremiah 2014 TZA), six trials assessed multi-micronutrient sup-plementation (Range 2005 TZA;Semba 2007 MWI; Villamor
2008 TZA;Mehta 2011 TZA;Praygod 2011a TZA;Lodha 2014 IND), and 21 trials assessed single or dual micronutrient supple-mentation. The remaining trial assessed the effect of supplemen-tation withChanna striatacapsules (Paliliewu 2013 IDN).C. stri-atais a fresh-water fish found in most tropical and subtropical countries.
Sample size
Eleven of the 35 trials included less than 100 participants in their final analysis. To aid interpretation and inform future research we have calculated the optimal sample size to reliably demonstrate some suggested clinically important results (Appendix 3;Appendix 4).
As micronutrients are a cheap and easily administered interven-tion, even a small effect on tuberculosis treatment outcomes might be considered clinically important. For example, to demonstrate a reduction in death from the worldwide average of 5% to just 4% (a relative risk reduction of 20%); a sample size of over 13,000 participants would be necessary. This is far above the data included in this Cochrane Review. Similarly an increase in successful cure rate from 80% to 84% would require almost 3000 participants. For full details of the included trials see the ’Characteristics of included studies’ table.
Excluded studies
We excluded 17 studies that we had thought were eligible after ini-tial screening for the reasons we have given in the ’Characteristics of excluded studies’ table. Five trials are currently awaiting classifica-tion pending further informaclassifica-tion from the author (Chandra 2004; Guzman-Rivero 2013; Nagrale 2013;Nawas 2013;Al Mamun 2014). In addition we are aware of 17 potentially relevant ongoing or unpublished trials; see the ’Characteristics of ongoing studies’ table.
Risk of bias in included studies
Allocation
Twenty-four trials described an adequate method of generating a truly random allocation sequence (Karyadi 2002 IDN;Schön 2003 ETH;Paton 2004 SGP; Range 2005 TZA;Semba 2007 MWI; Villamor 2008 TZA; Wejse 2008 GNB; Martins 2009 TLS;Lawson 2010 NGA;Pakasi 2010 IDN;Sudarsanam 2010 IND;Martineau 2011 GBR;Mehta 2011 TZA;Praygod 2011a TZA;Praygod 2011b TZA;Schön 2011 ETH;Visser 2011 ZAF; Ralph 2013 IDN;Jeremiah 2014 TZA;Lodha 2014 IND;Daley 2015 IND;Farazi 2015 IRN;Mily 2015 BGD;Tukvadze 2015 GEO). The other trials did not report how the random sequences were generated although all were described as “randomized”. Eighteen trials described an adequate method of ensuring alloca-tion concealment (Schön 2003 ETH;Semba 2007 MWI;Wejse 2008 GNB;Martins 2009 TLS;Lawson 2010 NGA;Sudarsanam 2010 IND;Martineau 2011 GBR;Mehta 2011 TZA;Praygod 2011a TZA;Praygod 2011b TZA;Schön 2011 ETH;Visser 2011 ZAF;Ralph 2013 IDN;Lodha 2014 IND;Daley 2015 IND; Farazi 2015 IRN;Mily 2015 BGD;Tukvadze 2015 GEO). The other trials did not provide sufficient information to determine if the allocation sequence was truly concealed from the person allo-cating participants to the treatment groups.
Blinding
It is generally not possible to blind patients to macronutrient sup-plementation. However, it is possible to blind the outcome asses-sors but only one of the six studies reports an attempt to do this (Martins 2009 TLS).
Twenty-one of the 27 trials assessing micronutrients used placebos and adequately blinded participants and study staff to be consid-ered at low risk of bias.
Incomplete outcome data
We considered 12 studies at high risk of bias for some outcomes due to high losses to follow-up (that is, loss to follow-up > 10% overall, between groups or within a group (Hanekom 1997 ZAF; Karyadi 2002 IDN;Paton 2004 SGP;Range 2005 TZA;Semba 2007 MWI;Martins 2009 TLS;Pakasi 2010 IDN;Sudarsanam 2010 IND;Visser 2011 ZAF;Ginawi 2013 IND;Jeremiah 2014 TZA;Tukvadze 2015 GEO).
Selective reporting
Although treatment outcomes in tuberculosis such as cure, and treatment completion are well established in tuberculosis pro-grammes only one trial reported cure (Sudarsanam 2010 IND), and five reported treatment completion (Martins 2009 TLS;
Jahnavi 2010 IND;Pakasi 2010 IDN;Sudarsanam 2010 IND; Farazi 2015 IRN). We were unable to retrieve trial protocols.
Other potential sources of bias
One trial did not adequately describe baseline nutritional status (Morcos 1998 EGY), one trial had a large imbalance in HIV status at baseline (Mehta 2011 TZA), and one trial had appreciable dif-ference in both HIV status and severity of chest X-ray at baseline (Ralph 2013 IDN).
Effects of interventions
See:Summary of findings for the main comparison’Summary of findings’ table 1;Summary of findings 2’Summary of findings’ table 2
1. Macronutrients
1.1 Increased energy supplementation (average daily requirement for a male adult: 2500 kcal)
Six trials examined the effects of providing macronutrient supple-ments through the health service.
• In Timor Leste, adults with pulmonary tuberculosis and a mean weight of 43.3 kg (31% of participants had a BMI of less than 16 kg/m²) were randomized to nutritional advice plus a daily cooked meal or nutritional advice alone (Martins 2009 TLS). The daily midday meal (administered for two months during the intensive phase) consisted of a bowl of meat, kidney beans, and vegetable stew with rice. During the continuation phase participants in the supplement group also received a weekly food parcel containing unprepared red kidney beans, rice, and oil adequate for one meal per day.
• In India, adults with pulmonary tuberculosis and a BMI of less than 19 kg/m² were randomized to receive a macronutrient and micronutrient supplement plus standard care versus standard care alone (Sudarsanam 2010 IND). The supplement consisted of three daily servings of a cereal and lentil mixture (providing 930 kcal and 31.5 g protein) and a once-a-day multivitamin tablet. Participants were given a month’s supply of supplement at a time.
energy ’biscuits’ (Praygod 2011b TZA;Jeremiah 2014 TZA) (see Appendix 5). None of the studies estimated the total daily energy intake, but the supplement provided between 600 and 3690 kcal per day on top of the regular diet. All four studies recruited people with mean BMI below 20 kg/m².
Only two trials measured total dietary intake. Both trials con-firmed that supplementation had increased nutritional intake compared to dietary advice alone, and not simply substituted food that patients might have obtained elsewhere (Paton 2004 SGP; Sudarsanam 2010 IND).
Tuberculosis treatment outcomes
The number of deaths reported from these trials was very low, and trials were too small to reliably detect or exclude important differ-ences in mortality (risk ratio (RR) 0.34, 95% confidence interval (CI) 0.10 to 1.20; four trials, 567 participants;Analysis 1.1), or cure (RR 0.91, 95% CI 0.59 to 1.41; one trial, 102 participants; Analysis 1.2).Jahnavi 2010 INDfound a statistically significant difference in treatment completion in favour of supplementation, but this was not seen in the larger trial conducted in Timor Leste (two trials, 365 participants,Analysis 1.3).
Jahnavi 2010 INDalso found that more participants given sup-plements were smear negative at eight weeks, whileMartins 2009 TLSand Jeremiah 2014 TZAfound no statistically significant difference (RR 1.08, 95% CI 0.86 to 1.37; three trials, 222 par-ticipants;Analysis 1.4).
Nutritional recovery and quality of life
Effects on weight gain were mixed (five trials, 689 participants, Analysis 1.5). The daily hot meal was associated with an extra 1.7 kg weight gain at eight weeks (95% CI 0.1 to 3.2; P = 0.04; authors’ own figures), and 2.6 kg at eight months (95% CI 0.1 to 5.2; P = 0.04; authors’ own figures;Martins 2009 TLS), whereas the monthly ration pack was not associated with important differences (change in lean body mass, and percentage body fat were not significantly different between groups; P = 0.479 and P = 0.573 respectively; authors’ own figures;Sudarsanam 2010 IND). Of the trials evaluating high energy supplements, the two smaller trials in HIV-negative participants found that supplementation resulted in significantly more weight gain than advice alone at six weeks (MD 1.73 kg, 95% CI 0.81 to 2.65; one trial, 34 partici-pants;Analysis 1.5) and 12 weeks, respectively (MD 2.6 kg, 95% CI 1.74 to 3.46; one trial, 100 participants;Analysis 1.5).Paton 2004 SGPfurther quantified this as an increase in lean body mass (MD 1.13 kg, 95% CI 0.37 to 1.89; one trial, 34 participants), with no significant difference in total fat mass. However, in Tanza-niaPraygod 2011b TZAfound no significant difference in weight gain with supplementation in HIV-positive participants at eight or 20 weeks (one trial, 332 participants,Analysis 1.5). Similarly,
Jeremiah 2014 TZAfound no difference in final mean weight be-tween the supplement and no supplement group after two months of supplementation (one trial, 92 participants,Analysis 1.5). Three trials of high energy supplements (Paton 2004 SGP;Jahnavi 2010 IND; Praygod 2011b TZA) report changes in maximum grip strength, and again a statistically significant benefit was seen in the small trials of HIV-negative participants but not the larger trial of HIV-positive participants although the data appear skewed (three trials, 466 participants,Analysis 1.6).
Jahnavi 2010 INDandPaton 2004 SGPalso reported that the benefits on weight gain and grip strength were accompanied by improvements in some quality of life scores. It was not possible to assess whether these difference were statistically significant because the data appeared highly skewed (the SDs were larger than the means for most outcomes); seeAnalysis 1.7andAppendix 6.
1.2 Altered dietary composition
One very small trial of 21 participants compared a high cholesterol diet (2500 kcal per day with 800 mg cholesterol per day) with a diet with a similar nutritional profile but lower in cholesterol (2500 kcal per day with 250 mg cholesterol per day) for eight weeks in adults being treated for sputum-culture positive pulmonary tuberculosis (Pérez-Guzmán 2005 MEX).
Tuberculosis treatment outcomes
This trial did not report on death, cure, or treatment completion. Fewer participants in the high cholesterol group were still sputum-culture positive at two weeks compared with those in the normal cholesterol group (RR of remaining sputum positive at two weeks 0.22, 95% CI 0.06 to 0.77; one trial, 20 participants,Analysis 2.1), the difference was not significant at four weeks, and at eight weeks all participants in both groups were sputum-culture negative. Self reported cough and dyspnoea are reported to have decreased at the same rate in both groups (figures not given).
Nutritional recovery and quality of life
This trial did not report on any aspect of the participant’s nutri-tional recovery or quality of life.
2. Micronutrients
2.1 Multivitamins and trace elements
individual constituents ranged from one to 10 times the dietary reference intake (DRI), and are given inAppendix 1. In summary: vitamin A (1 to 3 x DRI), B vitamins (1 to 10 x DRI), vitamin C (1 to 5 x DRI), vitamin D (approximately 1 x DRI), vitamin E (1 to 10 x DRI), zinc (1 to 5 x DRI), and selenium (1 to 4 x DRI). In two trials participants received daily supplements for two months (Mehta 2011 TZA;Praygod 2011a TZA), one trial for six months (Lodha 2014 IND), one trial for eight months (Range 2005 TZA), and in two trials they received daily supplements for 24 months (Semba 2007 MWI;Villamor 2008 TZA).
Tuberculosis treatment outcomes
In trials with HIV negative people the number of deaths from tuberculosis was low and the trials substantially underpowered to demonstrate an effect, Consequently, the 95% CI is wide and in-cludes clinically important benefit and harm (RR 0.86, 95% CI 0.46 to 1.60, four trials, 1219 participants,Analysis 3.1). Deaths were more common in trials with HIV positive people not taking antiretroviral therapy, but again no differences between micronu-trients and placebo were demonstrated (RR 0.92, 95% CI 0.69 to 1.23, three trials, 1429 participants,Analysis 3.1).
Lodha 2014 INDreported no difference in tuberculosis treatment completion at six months between micronutrients (with and with-out zinc) and placebo (one trial, 302 participants,Analysis 3.2). There was no statistically significant difference between the sup-plement and control groups in the numbers of participants who remained sputum-culture or sputum-smear positive at one month (two trials, 1020 participants,Analysis 3.3) or two months (two trials, 731 participants,Analysis 3.4).
Lodha 2014 INDandMehta 2011 TZAreported no apprecia-ble difference in chest x-ray clearance (after two or six months of supplementation) between the supplemented children and the placebo children at follow-up (two trials, 497 participants, Analysis 3.5).
Nutritional recovery and quality of life
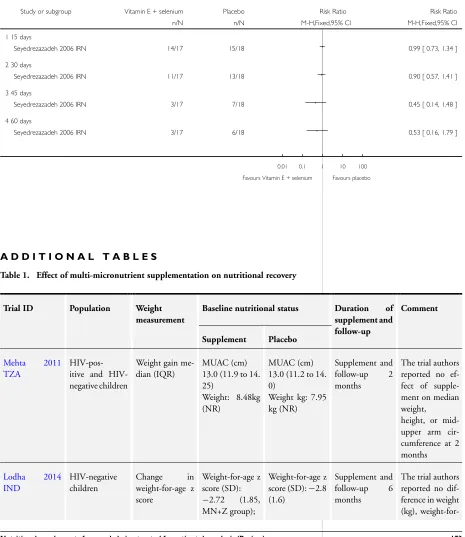
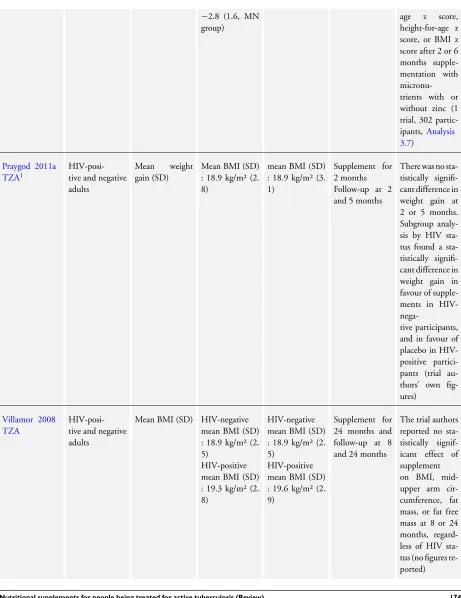
Five trials reported changes in weight or body mass using a variety of parameters, and onlyRange 2005 TZAreported statistically significant effects (seeTable 1).
Range 2005 TZAfound that participants receiving multiple mi-cronutrients had gained significantly more weight at seven months than those in the placebo group. This was a 2 x 2 factorial study and the difference in weight was appreciable in both treatment groups compared to placebo. In the treatment arm that received both high dose multivitamins and high dose zinc, the weight gain appeared clinically important (MD 2.37 kg, 95% CI 2.21 to 2.53; one trial, 192 participants,Analysis 3.6). However, in the treat-ment arm that received high-dose multivitamins alone, the weight gain was minimal (MD 0.30 kg, 95% CI 0.17 to 0.43; one trial, 198 participants,Analysis 3.6). InLodha 2014 IND,
multi-mi-cronutrient supplementation with or without zinc did not consis-tently alter children’s weight, BMI-for-age z score or height-for-age z score (one trial, 198 participants;Analysis 3.7).
One study,Praygod 2011a TZA, found an appreciable improve-ment in mean handgrip strength at two months but not five months (mean difference (change in handgrip strength) 1.22 kg, 95% CI 0.49 to 1.95; one trial, 771 participants;Analysis 3.8). The clinical importance of this difference is unclear. Consistent with the change in weight, this increase was only present in HIV-negative participants.
2.2 Individual micronutrients
Vitamin A (DRI: 900 µg/3000 IU per day)
Supplement dosing regimes
Three trials directly compared vitamin A given alone versus placebo (Ginawi 2013 IND: vitamin A 5000 IU;Hanekom 1997 ZAF: vitamin A 200,000 IU on Day 0 and Day 1;Pakasi 2010 IDN: vitamin A 5000 IU daily). In addition, seven trials com-bined vitamin A with zinc (see Comparison 6: Zinc plus vitamin A versus placebo), and five studies gave vitamin A as part of a multi-micronutrient supplement (see Comparison 3: Multivitamin and trace element tablets versus placebo).
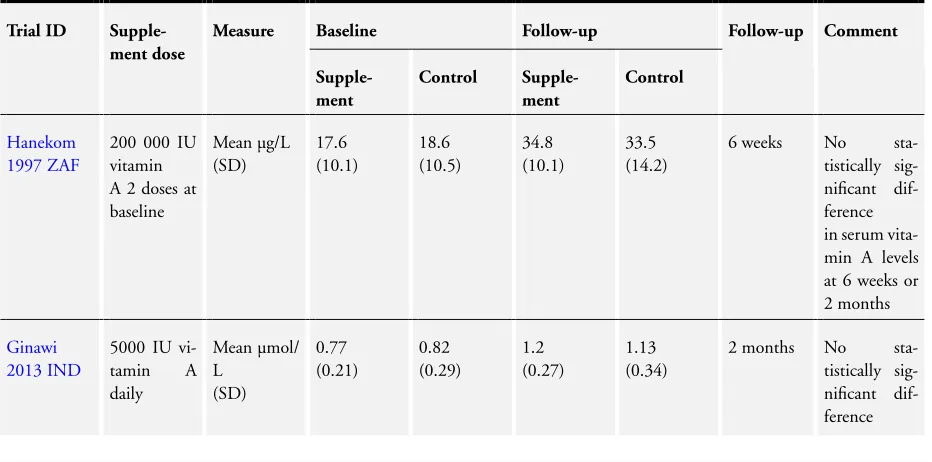
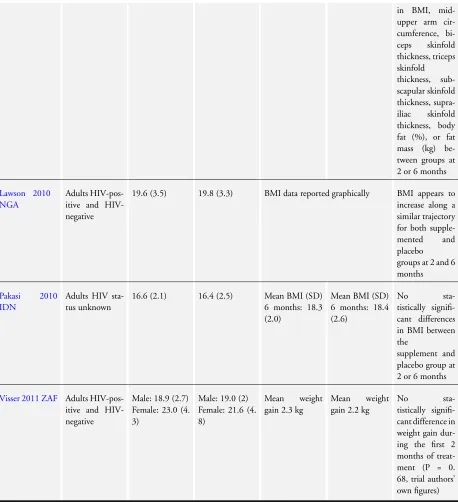
Serum vitamin A concentrations at baseline and follow-up Seven studies report on measures of vitamin A status, butPakasi 2010 IDNandVisser 2011 ZAFreported data as median plasma levels so could not be included in the meta-analysis, andSemba 2007 MWIonly presented data graphically (seeTable 2). Only Semba 2007 MWIreports a difference that was statistically sig-nificant in favour of supplements, but this difference (at eight months) is unlikely to be of clinical significance.
In four trials in adults and one in children, mean serum vitamin A level substantially increased in both intervention and control arms regardless of supplementation, and there was no statistically sig-nificant difference between the groups (one trial, 85 participants; Analysis 4.1; three trials, 242 participants;Analysis 4.2;Table 2).
Tuberculosis treatment outcomes
OnlyPakasi 2010 IDNreported on treatment completion and found no statistically significant effect (one trial, 158 participants, Analysis 4.4).Hanekom 1997 ZAFreported that more children in the supplement group remained symptomatic after six weeks of tuberculosis treatment than in the control group, but this was not statistically significant (one trial, 76 participants,Analysis 4.5). The trial authors also reported no statistically significant differences in respiratory symptoms at three months, or in chest x-ray resolution; but specific data on these outcomes were not provided.
Supplementation with vitamin A alone had no effect on the num-ber of participants who were sputum smear negative after two weeks, one month, or two months (two trials, 224 participants, Analysis 4.6).Pakasi 2010 IDNreported that all participants in the vitamin A and placebo arm were smear negative at two months.
Nutritional recovery and quality of life
Hanekom 1997 ZAFreported that the mean weight z score at base-line was−1.41 (SD 1.41) in the supplement group, and−1.44 (SD 1.34) in the placebo group (it is unclear whether this is weight for age or weight for height). The trial authors also reported that no statistically significant differences in change-in-weight z scores were recorded at any time-point, but the specific data for this out-come was not provided.
Pakasi 2010 IDNreports that the mean BMI at baseline was 16.5 kg/m² (SD 2.2) in the supplement group and 16.4 kg/m² (SD 2.5) in the placebo group. There was no statistically significant difference in mean BMI between groups at two or six months (one trial, 158 participants,Analysis 4.7).Pakasi 2010 IDNalso reported that there were no statistically significant differences in mid upper arm circumference (MUAC) or percentage body fat (Analysis 4.8).
Zinc (DRI: 11 mg/day)
Supplement dosing regimes
Five trials directly compared daily zinc given alone versus placebo (Ginawi 2013 IND: 15 mg zinc sulphate;Lodha 2014 IND: 20 mg elemental zinc;Range 2005 TZA: zinc 45 mg daily;Lawson 2010 NGA: 90 mg elemental zinc weekly;Pakasi 2010 IDN: 15 mg zinc sulphate daily). In addition, seven trials combined vitamin A with zinc (see Comparison 6: zinc plus vitamin A versus placebo), and four trials gave zinc as part of a multi-micronutrient supplement (see comparison 3: Multivitamin and trace element tablets versus placebo).
Serum zinc concentrations at baseline and follow-up
Five studies report mean plasma zinc levels at baseline and during follow-up (seeTable 3).Pakasi 2010 IDNandArmijos 2010 MEX report mean zinc levels within the normal range at baseline.Ginawi 2013 IND andKaryadi 2002 IDN reported that 30% of the participants had low zinc levels (less than 10.7 µmol/L) and in Lodha 2014 INDapproximately 50% of the participants had zinc levels greater than 65 µg/dL.
Overall, daily supplementation with zinc sulphate increased serum zinc concentrations after two months and six months compared to placebo (four trials, 472 participants,Analysis 5.1;Table 3), with more consistent effects at six months.
Tuberculosis treatment outcomes
No effect on mortality has been seen with zinc alone or in combi-nation with other micronutrients (seven trials, 2862 participants, Analysis 5.2,Analysis 5.3). These trials, even the larger ones, are significantly underpowered to rule out a clinically important ef-fect.
There was no appreciable differences in treatment completion be-tween the zinc alone and placebo groups (two trials, 353 partic-ipants,Analysis 5.4), and there were no differences between the groups in the numbers who remained sputum-culture positive at four weeks (three trials, 783 participants,Analysis 5.5) or eight weeks (five trials, 1076 participants,Analysis 5.5). Furthermore, Lodha 2014 INDreports no difference in chest X-ray clearance after six months between the zinc and placebo groups (one trial, 201 participants,Analysis 5.6).
Nutritional recovery and quality of life
One trial in children in India found no difference in mean weight (kg), weight-for-age z score, BMI-for-age z score or height-for-age z score after two months or six months supplementation with zinc alone (one trial, 201 participants,Analysis 5.7;Analysis 5.10; Analysis 5.11;Analysis 5.12). Similarly,Pakasi 2010 IDNfound no difference in BMI or body fat (%) in adults at two or six months (one trial, 162 participants,Analysis 5.8andAnalysis 5.9;Pakasi 2010 IDN), andLawson 2010 NGApresented data on changes in BMI graphically, and BMI appeared to improve at the same rate in all groups (Lawson 2010 NGA).
Range 2005 TZAreported a very small but statistically signifi-cant decrease in weight gain with supplementation compared to placebo (MD−0.21 kg, 95% CI−0.36 to−0.06; one trial 183 participants;Analysis 5.7).
Supplement dosing regimes
Seven studies in adults with sputum positive pulmonary tuber-culosis compared the combination of vitamin A and zinc versus placebo (Ginawi 2013 IND: vitamin A 5000 IU and 15 mg zinc sulphate;Singh 2013 IND: 25000 IU vitamin A and 50 mg zinc sulphate, once daily for 10 days and then thrice weekly until six months;Karyadi 2002 IDN: vitamin A 5000 IU and zinc 15 mg daily for six months;Armijos 2010 MEX: vitamin A 5000 IU plus zinc 50 mg daily for four months;Lawson 2010 NGA: vitamin A 5000 IU/day plus 90 mg elemental zinc/week for six months; Pakasi 2010 IDN: vitamin A 5000 IU plus 15 mg zinc sulphate daily for six months;Visser 2011 ZAF: vitamin A 100,000 IU at baseline plus zinc 15 mg for five days per week for two months).
Tuberculosis treatment outcomes
Four trials reported on deaths that occurred during the trial. In HIV negative participants there were no statistically significant differences in risk of death between those who received zinc and vitamin A or placebo (four trials, 430 participants,Analysis 6.1), but in HIV-positive participants the effect did reach statistical significance (RR 5.94, 95% CI 1.07 to 32.96; two trials, 136 participants; Analysis 6.1). However, both of these analyses are substantially underpowered to have confidence in these effects. OnlyPakasi 2010 IDNreported on treatment completion and found no statistically significant difference between the groups (one trial, 152 participants; Analysis 6.2). Overall, there is no statistically significant difference between supplementation and placebo in the number of participants who remain sputum-smear positive at one month or two months (seven trials, 726 partic-ipants,Analysis 6.3). One study,Armijos 2010 MEX, did find a statistically significant difference in sputum positivity at three months in favour of supplementation (RR 0.12, 95% CI 0.02 to 0.84; one trial, 33 participants;Analysis 6.3), but the difference was not significant at two or four months.Visser 2011 ZAFfound no statistically significant difference in time to smear or culture conversion (one trial, 154 participants; P = 0.15 and P = 0.38 respectively, authors’ own figures).
Nutritional recovery and quality of life
Karyadi 2002 IDNreported a statistically significant increase in mean body weight at six months (MD 3.10 kg, 95% CI 0.74 to 5.46; one trial, 80 participants;Analysis 6.4), but there were no differences in any other nutritional parameters (seeTable 4and Analysis 6.5;Analysis 6.6;Analysis 6.7;Analysis 6.8;Analysis 6.9; Analysis 6.10;Analysis 6.11;Analysis 6.12). There was no sta-tistically significant differences between intervention and control arms in any of the other three trials that reported changes in BMI or weight.
Two trials reported on changes in Karnofsy score, a rating scale of a person’s ability to perform activities of daily living ranging from 0 (dead) to 100 (normal).Karyadi 2002 IDNreported that supplementation resulted in a small but statistically significant difference in Karnofsky score at six months (MD 2.5%, 95% CI 0.91 to 4.09; one trial 80 participants;Analysis 6.13), while Lawson 2010 NGAfound no difference at two or six months but only presented data graphically (one trial, 233 participants). A difference in Karnofsky score of 2.5% is unlikely to be of clinical significance.
Vitamin D (DRI for adults: 5 to 15 µg/200 to 600 IU per day)
Supplement dosing regimes
Eight trials evaluated vitamin D supplementation versus placebo: Morcos 1998 EGY: 1000 IU daily for eight weeks;Nursyam 2006 IDN: 250 µg daily for six weeks;Ralph 2013 IDN: 50,000 IU daily for eight weeks;Mily 2015 BGD: 5000 IU daily for eight weeks;Tukvadze 2015 GEO: 50000 IU three times a week for eight weeks, then every two weeks for eight weeks;Wejse 2008 GNB: 100,000 IU at 0, 5, and 8 months;Daley 2015 INDand Martineau 2011 GBR: 2.5 mg on days 0, 14, 28, and 42). In addition, one trial evaluated vitamin D combined with arginine (Ralph 2013 IDN: 50,000 IU plus arginine 6 g daily for eight weeks), two trials evaluated vitamin D combined with calcium (Singh 2013 IND: 250 IU plus calcium 500 mg daily for 10 days then three times a week;Kota 2011 IND: 60,000 IU per week plus calcium 1000 mg per day for 3 months), and four trials of multi-micronutrients included vitamin D in standard daily doses (see comparison 3).
Vitamin D levels at baseline and follow-up (deficient≤50 nmol/L, and insufficient≤75 nmol/L)
CI−7.76 to 11.76), or six months (Daley 2015 IND: MD 8.60, 95%CI−6.29 to 23.49).
Tuberculosis treatment outcomes
There were no statistically significant differences in the number of deaths between those receiving vitamin D (any formulation) or placebo regardless of HIV status (seven trials, 2649 participants, Analysis 7.2;Analysis 7.3).
OnlyRalph 2013 IDNreported on cure, for which there was no statistically significant difference between the vitamin D and the placebo groups (one trial, 76 participants, Analysis 7.4).Wejse 2008 GNBalso found no statistically significant difference in re-covery, as defined by a newly developed tuberculosis scoring sys-tem (one trial, 348 participants,Analysis 7.5). This system rates the patient’s condition on a scale of zero to 13, based on signs and symptoms and anthropometric measurements (Wesje 2008). Overall, there were no statistically significant differences in the proportion of people that remained sputum positive at any time point from four weeks to eight months (seven trials, 1197 partici-pants,Analysis 7.6). One trial of daily supplementation,Nursyam 2006 IDN, showed a statistically significant difference in the pro-portion of participants who remained sputum positive at six weeks (RR 0.06, 95% CI 0.00 to 0.95; one trial, 67 participants,Analysis 7.6); but the difference was not significant two weeks later. One additional trial,Kota 2011 IND, also reported finding a statis-tically significant difference but only presented the P value (P = 0.067).
Nutritionalrecovery and quality of life
There were no statistically significant differences in mean BMI after six to eight weeks of supplementation (four trials, 430 par-ticipants,Analysis 7.7), or in mean body weight (two trials, 150 participants,Analysis 7.8).Wejse 2008 GNBalso reported no sta-tistically significant difference in weight gain at eight months but only reported the P value (one trial, 359 participants, P = 0.9, au-thors’ own figures), andRalph 2013 IDNreported no statistically significant difference in the proportions gaining less than 5%, 5% to 9.9%, or greater than 10% weight.
Daley 2015 INDreported that mean Karnofsky score increased in both groups, with no statistically significant difference at eight weeks (one trial, 212 participants,Analysis 7.9).
Adverse events
Five trials reported adverse events, which we have summarized in Table 6. There were no important differences in reported adverse events between the supplemented and the placebo groups.
Vitamin E and selenium capsules (DRI: vitamin E 15 mg, selenium 55 µg per day)
One trial compared a daily vitamin E (140 mg) and selenium (200 µg) supplement with placebo in adults being treated for spu-tum-smear positive pulmonary tuberculosis (Seyedrezazadeh 2006 IRN).
The trial authors reported the median plasma vitamin E and se-lenium levels at baseline and at eight weeks. They reported that the median level of both micronutrients rose in the supplement group and decreased in the placebo group. We were unable to assess whether these differences between groups were statistically significant (Appendix 8). In addition, one study that gave multi-micronutrients, including vitamin E (133 mg) and selenium (65 µg), measured the vitamin E and selenium levels at baseline and during follow-up (Semba 2007 MWI). The trial authors reported that both vitamin E and selenium levels were “significantly higher” in the supplement group after eight months, but only presented the data graphically.
Tuberculosis treatment outcomes
No deaths were reported and this trial did not report cure or treatment completion.
There was no statistically significant difference between the supple-ment and placebo groups in the numbers of participants who were sputum-smear positive at 15, 30, 45, and 60 days after the start of antituberculous treatment (one trial, 35 participants,Analysis 9.1).
Nutritionalrecovery and quality of life
The trial authors reported a ’constant increment’ in BMI for the two months of treatment with no statistically significant differ-ences between the groups, but did not present these data.
Arginine (currently considered a conditionally essential amino acid, depending on the developmental stage and health status of the individual)
Tuberculosis treatment outcomes
The included trials reported a total of 12 deaths. There was no significant difference in the risk of death between the arginine sup-plemented group and the placebo group (three trials, 394 partici-pants,Analysis 8.1). There was also no significant difference in the proportion of participants who were cured (two trials, 279 partic-ipants,Analysis 8.2), or sputum smear or culture positive at four or eight weeks of follow-up (four trials, 464 participants,Analysis 8.3).Schön 2003 ETHreported a statistically significant increase in sputum-smear conversion in HIV-negative participants receiv-ing arginine; however, our analysis of the data showed a non-sig-nificant difference between groups in the numbers of participants still sputum-smear positive at eight weeks (one trial, 56 partici-pants,Analysis 8.3).
At two weeksSchön 2003 ETHreported that compared to the placebo group, fewer HIV-negative participants in the arginine group reported cough (RR 0.71, 95% CI 0.53 to 0.96; one trial, 56 participants,Analysis 8.4). Similarly, at eight weeks significantly fewer participants in the arginine group reported cough compared to those in the placebo group (RR 0.78, 95% CI 0.61 to 0.99; three trials, 348 participants,Analysis 8.4); this difference should be viewed with caution as onlyFarazi 2015 IRNprovided base-line data that showed no difference in cough symptoms between groups.
Nutritional recovery and quality of life
In two studies there was no significant difference in weight gain (Schön 2003 ETHonly presented the data graphically) or the pro-portion of participants with weight gain greater than 10% (Schön 2011 ETH; one trial, 170 participants,Analysis 8.5) between the arginine and placebo or low arginine groups. In a recent study, arginine supplementation significantly reduced the number of par-ticipants with a BMI of less than 18.5 after one (P = 0.032) and two (P = 0.04) months of antituberculous treatment compared to placebo (Farazi 2015 IRN).
3. Other trials
One small trial compared supplementation withC. striatacapsules (6 g per day), for four months, with organoleptically-matched placebo on sputum and cytokine conversion in 36 HIV-negative participants with sputum smear positive pulmonary tuberculosis (Paliliewu 2013 IDN).
Tuberculosis treatment outcomes
This trial did not report on death, cure, or treatment completion. The rate of sputum smear conversion was greater in the supple-mented group compared to placebo group. However, these dif-ferences were not statistically significant at any of the time points measured.
Nutritional recovery and quality of life