R E S E A R C H
Open Access
SAR image segmentation using MSER and
improved spectral clustering
Yang Gui
1,2*, Xiaohu Zhang
1,2and Yang Shang
1,2Abstract
A novel approach is presented for synthetic aperture radar (SAR) image segmentation. By incorporating the advantages of maximally stable extremal regions (MSER) algorithm and spectral clustering (SC) method, the proposed approach provides effective and robust segmentation. First, the input image is transformed from a pixel-based to a region-pixel-based model by using the MSER algorithm. The input image after MSER procedure is composed of some disjoint regions. Then the regions are treated as nodes in the image plane, and a graph structure is applied to represent them. Finally, the improved SC is used to perform globally optimal clustering, by which the result of image segmentation can be generated. To avoid some incorrect partitioning when considering each region as one graph node, we assign different numbers of nodes to represent the regions according to area ratios among the regions. In addition, K-harmonic means instead of K-means is applied in the improved SC procedure in order to raise its stability and performance. Experimental results show that the proposed approach is effective on SAR image segmentation and has the advantage of calculating quickly.
Keywords:MSER, spectral clustering, graph construction, K-harmonic means, SAR image segmentation
1. Introduction
Image segmentation is a process of dividing an image into different regions based on certain attributes such as intensity, texture, color, etc. This process is fundamental in computer vision and many applications, such as object recognition, image compression, image retrieval, and visual summary, can benefit from it. This process is also challenging because segmentation is usually not satisfactory, and computation is highly costly. Synthetic aperture radar (SAR) image segmentation plays a special role in automatic target recognition and has attracted more and more attention recently.
Various approaches of SAR image segmentation have been proposed and the recent work includes a variety of techniques, for example, clustering algorithm [1], threshold methods [2,3], morphologic methods [4], graph-based approaches [5,6], and statistic model-based methods [7,8]. The graph-based approaches have become popular over the last decade. In such approaches, an image is seen as a weighted graph where
each node corresponds to an image pixels or a region and the weight of each edge connecting two pixels or two regions represents the likelihood which belongs to the same segment. So far, several graph-based methods have been proposed for image segmentation. For exam-ple, Shi and Malik [9] proposed a general image seg-mentation approach based on normalized cut (Ncut) and Ng et al. [10] came up with a simple and effective multi-way spectral clustering (SC) method named NJW. The improved SC in this article is mainly based on the NJW method.
The maximally stable extremal region (MSER) algo-rithm is an interesting region detector originally used in wide-baseline stereo matching [11]. The MSERs are con-nected components of an image where local intensity is stable over a large range of thresholds. MSERs have properties that form their superior performance as a stable local detector. First, the set of MSERs is closed under continuous geometric transformations. Second, MSERs are invariant to affine intensify changes. Finally, MSERs are detected at different scales. The performance evaluation by Mikolajczyk and Schmid [12] showed that the MSER detector performed better on a wide range of test sequences and required much less computational
* Correspondence: [email protected]
1Department of Military Aerospace, College of Aerospace and Materials Engineering, National University of Defense Technology, Changsha 410073, Hunan,P.R.China
Full list of author information is available at the end of the article
complexity than other local detectors. MSERs have suc-cessfully been used in applications such as the automatic 3D-reconstruction from a set of images, object and scene retrieval in videos and object recognition [11,13,14]. In this article, we will demonstrate how MSERs can be used for SAR image segmentation.
SC method is based on the graph theory and is insen-sitive to the structure of data. Many traditional cluster-ing problems have been solved by it. Recently, SC method has successfully been implemented in many fields such as information searching [15], bioinformatics [16], and image segmentation [5,17-20]. In the process of using SC method for image segmentation, the pair-wise similarities of all pixels in the image are needed to be computed and the computational cost is huge which restricts the method’s application. To solve this pro-blem, Fowlkes et al. [21] proposed an approach based on a classical method for the integral eigenvalue pro-blem known as the Nystrom method. The approach worked by first solving the grouping problem for a small random subset of pixels and then extrapolating this solution to the full set of pixels in the image. The article [5] used watershed algorithm to over segment the input image firstly, then SC method was used for clus-tering. This method performed well in some cases, but the watershed algorithm was sensitive to noise and close texture and produced a large number of small but quasi-homogenous regions which might lead to perfor-mance degradation in the consequent region grouping. The article [22] used mean shift algorithm to segment the input color image firstly, then Ncut was applied to perform the final segmentation. SC method makes use of the mathematics tool spectral-graph-theory com-mendably and its result is very close to global optimum. It has its own advantages compared to another graph-based method named graph-cuts. Boykov and Kolmo-grov [23] borrowed algorithms for network flows to search the minimum cut of graph-cuts problem. It per-formed well on two-class segmentation but did not work on multi-class segmentation. Although they had proposed alpha-expansion method and alpha-beta-swap method [24] for multi-class problems based on graph-cuts framework, these two methods could approach to a good result but were inefficient when classification number was large which led to much iterative computation.
In this article, a novel SAR image segmentation algo-rithm is proposed based on MSER and improved SC. Frost filtering algorithm and morphological closing algo-rithm are applied to remove noise and enhance input image. The input image after this procedure is more sui-table for later processing. The input image is composed of multiple disjoint regions after MSER procedure, then the regions are treated as nodes and a graph structure is
applied to represent them. The node number represent-ing one region depends on area ratio of the region to the smallest region. In this way, more information of the image after MSER procedure is preserved compared to assigning only one node to represent one region and the segmentation performance can be enhanced. In addition, K-harmonic means (KHM) [25-27] is insensi-tive to the initialization of the centers and performs bet-ter than K-means, so KHM instead of K-means is applied in the improved SC procedure which is propi-tious to enhance stability and performance of the method.
This article is organized as follows. Section 2 intro-duces principles of MSER algorithm, SC method, and KHM algorithm. Section 3 describes the proposed approach for the effective SAR image segmentation. Sec-tion 4 shows the experimental results and SecSec-tion 5 concludes the article.
2. MSER, SC, and KHM
2.1 MSER algorithm
We begin with a lattice grid and the pixels are the func-tions defined on this grid. We reinsert the pixels in the intensity order, i.e., first we place all black (intensity = 0) pixels at their correct locations, then we place all pix-els with an intensity value 1 and so on until the com-plete image is restored. During this process it produces regions of pixels which will grow and connect to other regions as more and more pixels of higher intensity are placed. The rate of growth as a function of intensityq(i) is measured for all these regions and a region is detected as an MSER when the growth rate has a local minimum. The sensitivity of the detection is controlled with a parameterΔ[28].
The MSER algorithm can be divided into four major parts:
(1) Preprocessing: Pixels are sorted in the intensity order and the number of pixels for each intensity is determined.
(2)Clustering: A representation of all regions at each intensity level is created.
(3)MSER detection: The sizes, |Q|, of all regions are
tracked and the growth rates,q, are monitored for
local minimums.
(4) Display result: All pixels belonging to a detected MSER are identified and presented as an output.
one corresponding to the standard connected-component algorithm. With the new computational ordering, the pix-els considered or visited at any point during computation consist of a single connected component of pixels in the image, resembling a flood-fill that adapts to the grey level landscape. The computation only needs a priority queue of candidate pixels, a single-bit image masking visited pix-els, and information for as many components as there are grey-levels in the images. This is substantially more com-pact in practice than the standard algorithm where a large number of connected components must be considered in parallel. The new algorithm provides exactly identical results in the true worst-case linear time. Moreover, the new algorithm uses significantly less memory and has bet-ter cache-locality, resulting in fasbet-ter execution. In this arti-cle, the linear time MSER algorithm is used for its advantages.
2.2 SC method
An image can be seen as a weighted undirected graphG
(V,E,W) with nodesVrepresenting pixels and edges E
whose weights capture the pairwise similarities between pixels. In this article, nodesV represent regions after
MSER procedure and weights of edges E represent the
pairwise similarities between the regions. A multi-way SC method NJW is used in this article. It has been proved that using more eigenvectors and directly com-puting a multi-way partitioning are better than comput-ing a two-way partitioncomput-ing [30].
Let Nbe the number of nodes andd(i,j) (i= 1,2,...,N;j = 1,2,...,N) be the feature distance between Vi andVj ,
element of similarity matrix A(i,j)Î RN × Nis defined by A(i,j) = exp(-d2(i,j)/2s2) (i ≠j) where sis the scal-ing parameter that controls how rapidly the similarityA (i, j) falls off withd(i,j). The matrix composed ofA(i, j) is called similarity matrix which is the key point of SC method. The SC method is based on the eigenvectors of the similarity matrix [31]. The eigenvectors induce an embedding of the nodes in a low-dimensional subspace wherein a simple central clustering method can then be used to do the final partition.
Let X = {x1, x2,..., xh } be the set of points, and we
want to clusterX intoKsubsets. The specific procedure is described as follows.
(1) Form the similarity matrixAÎRh×hdefined by A(i,j) = exp(−d2(i,j)/2σ2) (i=j) (1)
andA(i,i) = 0,d(i,j) =∥xi-xj∥2.
(2) Define Dto be the diagonal matrix whose (i, i)
element is the sum of A’sith row, and construct the Laplacian matrixL=D-1/2AD-1/2.
(3) Compute theKlargest eigenvalues ofLand unify corresponding eigenvectors Vi, i = 1,2,..., K, then
form the matrix
S=λ1,v1,
λ2v2, ...,
λKvK
∈Rh×K, each column is a eigenvector which has been unified by eigenvalue.
(4) Form the matrixYfromSby renormalizing each
of S’s rows to have unit length, such that
Yij=Sij/
jS 2 ij
1/2
. It has been proved that the
nor-malized SC has a better performance [31].
(5) Treat each row of Y as a point inRk, cluster
them intoKclusters via KHM.
(6) Finally, assign the original pointxi to clusterjif
and only if rowi of the matrix Y was assigned to
clusterj.
2.3 KHM algorithm
KHM is a center-based clustering algorithm which uses harmonic averages of the distances from each data point to the centers as components to its performance func-tion. KHM algorithm is essentially insensitive to the initialization of the centers. In certain cases, KHM algo-rithm significantly improves the quality of clustering result compared to K-means algorithm.
LetX = {X1, X2,...,Xn} be thengiven data points, and
kis the center number. The KHM objective function is
EKHM = n i=1 k/ k l=1 (1/d2i,l)
(2)
wheredi,lis the distance betweenXiand the clustering
centerCl. The new positions of the centers are
calcu-lated as following.
Cl= n i=1 ⎛ ⎝1/ k j=1
(d2i,l/d2i,j)
2⎞
⎠Xi
n i=1 ⎛ ⎝1/ k j=1
(d2i,l/d2i,j)
2⎞
⎠
(3)
The recursion continues until the objective value stabilizes.
3. Proposed approach
3.1 Description of the algorithm scheme
The outline of the proposed method can be character-ized as follows.
First, Frost filtering algorithm and morphological clos-ing algorithm are used to remove noise and enhance input image. The main effect of Frost filtering algorithm is to remove speckles, and the main effect of morpholo-gical algorithm is to eliminate details which are smaller than the structuring element, connect adjacent regions, and smooth boundaries. The image after this step has fewer details and is smoother than the original image, and pixels belonging to the same region connect more closely with each other, so the sense of integrity of the image becomes higher. We mainly pay attention to seg-ment the image into several large classes correctly while ignoring preserving the details, so the image with higher sense of integrity is more suitable for later processing.
Second, the input image is segmented into multiple disjoint regions using MSER algorithm. The MSER algo-rithm often returns a lot of MSERs and most pixels in the image can be assigned to the MSERs, but there still exist some regions which are not considered to be stable regions. Thus, the input image is composed of multiple disjoint regions including the MSERs and the regions which are not MSERs. The average intensity of every region is computed and assigned to every pixel in it.
Third, all the regions after MSER procedure are trea-ted as nodes and a graph structure is constructrea-ted to represent them. In this article, an improved strategy is developed for the graph construction. We assign differ-ent number of nodes to represdiffer-ent each region according to area ratio between the region and the smallest region, instead of considering each region as only one graph node. Letm1 be the area of the smallest arear1andm2
be the area of the other region r2, we assign one node
to represent r1 and n nodes to represent r2, where
n=m2/m1. The advantage of determining the
num-bers of nodes representing the regions based on area ratio is that it takes account of the area differences among the regions and keeps more information of the image after MSER procedure. In this way, better seg-mentation result can be gained with more information.
As the graph has been constructed, similarity matrixA
can be computed. The weight A(i, j) between nodes i
andjwhich represent two different regions is defined as
A(i,j) = exp
−g(i)−g(j)
2 2
2σ2
∗exp
− 1 2η2∗
dist(i,j) max(dist(i,j))
(4)
where g(i) is the intensity value of regioni, and ∥ ⋅ ∥2
denotes the Euclidean distance.sis a scaling factor that determines the sensitivity of A(i, j) to intensity
differ-ence between regions i and j. dist(i, j) denotes the
spatial distance between regionsiandj, and it is defined as the minimal pixel distance between the two regions,
max(dist(i, j)) denotes the maximal spatial distance
among all the regions. The smaller the spatial distance of two regions is, the greater that possibility of cluster-ing the two regions to be one class is. his an adjusting constant that determines the sensitivity ofA(i, j) to the spatial distance between the regionsiandj.
Finally, as the similarity matrix has been computed, the SC method is applied to solve the region partition-ing problem. In the fifth step of original SC method, means algorithm is used for clustering. Because K-means algorithm is sensitive to the initialization of the centers, the clustering result is not stable. It has been proved that KHM algorithm is much more stable and performs better than K-means algorithm [26], so KHM algorithm instead of K-means algorithm is applied in this step to enhance stability and performance of the SC method in this article.
In the proposed method, the node number h is
depend on the number of regions after MSER procedure
instead of the size of input imageN, his always much
less thanN, so the computational cost of the proposed
method is reduced dramatically. In addition, the parti-tioning of graph based on regions is more robust and insensitive to noise than that based on pixels.
3.2 Implementation procedure
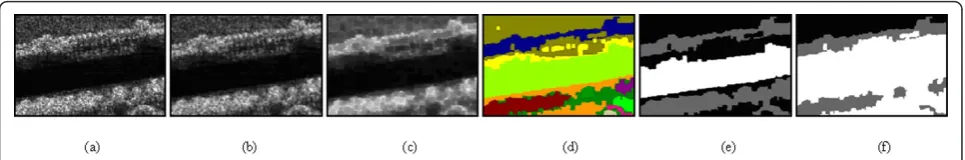
To illustrate the implementation process of the pro-posed method, a natural scene image is used as an example, as depicted in Figure 1a. The image can be clustered into three classes: river, trees, and grass. The image size is 300 × 200.
3.2.1. Frost filtering and morphological closing procedure
Figure 1b is the resultant image after Frost filtering pro-cedure and Figure 1c is the resultant image after mor-phological closing procedure. The windows of Frost filter and morphological closing are set to 3 × 3 and 7 × 7, respectively. In this step, noise is removed and sense of integrity of the image becomes higher than the origi-nal one. The image after this procedure is more suitable for later processing.
3.2.2. MSER procedure
Figure 1d is the resultant image after MSER procedure, the connected pixels with the same color depict one
region. The parameter Δ is set to 7. As a result, 30
regions are produced by MSER procedure.
3.2.3. Improved weighted graph construction strategy
instead of considering each region as only one graph node. Letm1 be the area of the smallest arear1andm2
be the area of the other region r2, we assign one node
to represent r1 and n nodes to represent r2, where
n=m2/m1. For example, the area of the smallest
region in Figure 1d is 42, the area of one of the other regions is 2151; thus, we assign one node to represent
the smallest region and n=2151/42≈7 nodes to
represent the other one.
The nodes representing the same region have the same feature value and the weights among them are 1. Every two nodes in the graph have one weighted edge. Figure 2 is a sketch map of the weighted graph structure of regions which are represented by two nodes, three nodes, and four nodes in the graph, respectively, and all the nodes have the weighted edges between each other.
The advantage of determining the numbers of nodes representing the regions based on area ratio is that it takes account of the area differences among the regions and keeps more information of the image after MSER procedure. In this way, a better segmentation result can be gained with more information. In addition, the com-putational cost only slightly increases as the node num-ber increases according to experiments.
3.2.4. Similarity matrix computation
As the weighted graph has been constructed, similarity matrix can be computed. The elements of the similarity matrix are calculated according to (4).
3.2.5. Final segmentation using SC method
As the similarity matrix has been computed, SC method is applied to perform the final segmentation. In this pro-cedure, KHM algorithm instead of K-means algorithm is used to improve stability and performance of the seg-mentation. The regions produced by MSER algorithm are clustered into several classes with the improved SC method. The final segmentation result of Figure 1a is depicted in Figure 1e. The segmentation result is satis-factory and the image is correctly clustered into three classes, namely, river, trees, and grass, which proves the validity of the proposed approach.
Figure 1f is the segmentation result when considering each region as one graph node. It can be seen from Fig-ure 1f that the segmentation result is not satisfactory, which proves the disadvantage of considering each region as only one graph node. It also shows that better segmentation results can be achieved by using the pro-posed graph construction strategy.
4. Experiments
The proposed method has been applied for the segmen-tation of a set of SAR images with natural scenes com-pared to Nystrom and Ncut methods. In this section, the experiment results are presented, indicating different stages of the methods. The sizes of the test images are 300 × 200. The windows of Frost filtering algorithm and morphological closing algorithm are set to 3 × 3 and 7 × 7, respectively. Since morphological closing algorithm is employed after Frost filtering algorithm, the window size of Frost filtering algorithm is set smaller than
com-mon size. The parameter of MSER algorithm is set toΔ
= 7. The adjusting parameters s and hshould be set
according to the image content to get the best segmen-tation result.
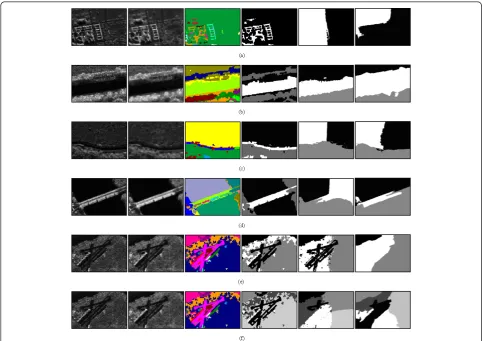
The test examples include five typical SAR images which are shown in Figure 3a-e[32]. These SAR images are obtained by a Ku-Band (15 GHz) SAR. The resolu-tions of Figure 3a-d are 1 m and Figure 3e is 3 m. The Figure 1An example of implementation process of the proposed method.(a)Original image.(b)Resultant image after Frost filtering procedure.(c)Resultant image after morphological closing procedure.(d)Resultant image after MSER procedure.(e)Final segmentation result of the proposed method.(f)Segmentation result when considering each region as only one graph node.
equivalent number of looks is defined as ENL = E{I}2/
Var{I} where E{I} and Var{I} are mean and variance of
image intensity, respectively. The ENLs of Figure 3a-e are 1.157, 1.038, 2.171, 0.257, and 1.049, respectively. The processing results of the images are shown in Fig-ure 4a-f, where the partitioning classkis two in Figure 4a and three in Figure 4b-e and five in Figure 4f Figure 4e,f are two groups of processing results for the same image Figure 3e with different partition classes. In each
group, the six images, respectively, show, from left to right, the resultant image after Frost filtering procedure, the resultant image after morphological closing proce-dure, the resultant image after MSER proceproce-dure, the final segmentation result of the proposed method, the segmentation result using Nystrom method, and the segmentation result using Ncut method implemented by Cour et al. [33]. When using the Ncut method in [33], we have to resize the images to 160 × 107, or the Figure 3Original images.
computer memory cannot afford the computational cost. To guarantee fairness of different methods comparison, the same kind of pre-processing is employed before employing Nystrom and Ncut methods.
It can be seen from all the experimental results shown in Figure 4 that the proposed method effectively seg-ments the natural scenes into several meaningful regions and provides better performance than Nystrom and Ncut methods. For example, in the first row of Figure 4, the buildings are not separated from the background with Nystrom and Ncut methods, while the proposed method can separate the buildings from the background effectively.
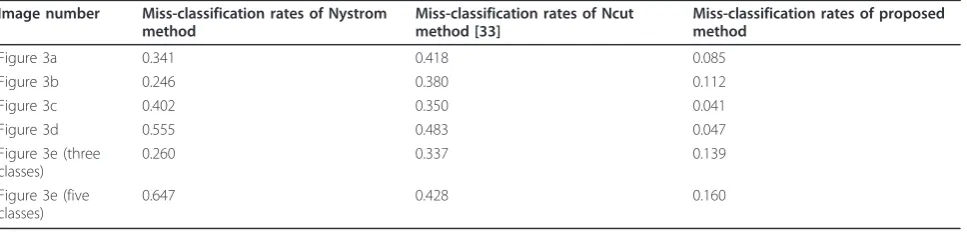
Manual segmentation results of Figure 3a-e which are taken as ground-truths are shown in Figure 5a-f. Figure 5e,f are two manual segmentation results for the same image Figure 3e with different partition classes which are three and five, respectively. Miss-classification rates of different methods are computed and the results are shown in Table 1. The calculation formula of miss-clas-sification rate is MC_Rate = MC_PixelNum/ImageSize in which MC_PixelNum denotes the number of pixels that are segmented into wrong classes and ImageSize denotes the size of the input image.
It can be seen from Table 1 that the miss-classifica-tion rates of proposed method are much less than that of the Nystrom and the Ncut methods, which proves good accuracy of the proposed method. The miss-classi-fication rates of the three methods are likely to increase when classification number increases from three to five. However, the miss-classification rate and its increasing
rate of proposed method are still less than that of the other two methods, as depicted in Figure 4e,f and the last two rows of Table 1.
Computational cost of the proposed method is com-pared to that of Nystrom and Ncut methods. A PC with a 2.67-GHz Core2 CPU and 2.0 GB memory is used. The runtimes of different methods are shown in Table 2.
It can be seen from Table 2 that the runtime of pro-posed method is much less than that of the Nystrom and the Ncut methods. The runtime of the proposed method consists of three parts. The first part is the run-time of applying Frost filtering algorithm and morpholo-gical closing algorithm, the second is the runtime of using MSER algorithm, and the third is the runtime of partitioning the regions produced by MSER algorithm with the improved SC method. The total runtimes of the proposed method are between 0.6 and 0.9 s, which can be seen from the last three columns of Table 2. From the second and the third columns of the same table, we can see that the runtimes of the Nystrom method are between 11 and 13.8 s, and the runtimes of the Ncut method in which the input images have been resized to 160 × 107 are between 4 and 6.5 s. The reduction of computational cost by using the proposed approach is obvious. In addition, it can be seen from the last two rows of Table 2 that the runtimes of the three methods increase when classification number increases from three to five. However, the runtime of proposed method is much less than that of the Nystrom and the Ncut methods.
Figure 5Segmentation ground-truths of Figure 3.
Table 1 Miss-classification rates of different methods
Image number Miss-classification rates of Nystrom method
Miss-classification rates of Ncut method [33]
Miss-classification rates of proposed method
Figure 3a 0.341 0.418 0.085
Figure 3b 0.246 0.380 0.112
Figure 3c 0.402 0.350 0.041
Figure 3d 0.555 0.483 0.047
Figure 3e (three classes)
0.260 0.337 0.139
Figure 3e (five classes)
5. Conclusion
A novel approach has been developed for SAR image segmentation in this article. By incorporating the advan-tages of MSER algorithm and SC method, the proposed approach provides effective segmentation. The Frost fil-tering algorithm and morphological closing algorithm make the input image more suitable for later processing. The MSER algorithm transforms the image from a pixel-based to a region-based model, and the disconti-nuity characteristics of the image are preserved. An improved strategy in which the number of nodes repre-senting each region is assigned according to the area ratio between the region and the smallest region is developed for the graph construction. The improved SC is applied to perform the final region-partition and a satisfactory image segmentation performance can be gained. Experimental results show that the proposed method can not only enhance the SAR image segmenta-tion performance, but also reduce the computasegmenta-tional
cost. How to choose the values of adjusting constantss
andhaccording to the properties of the input image is
also a question unsolved and needs further research.
Acknowledgements
The authors would like to express their gratitude to the anonymous reviewers whose thoughtful comments and suggestions improved the quality of the article.
Author details
1Department of Military Aerospace, College of Aerospace and Materials Engineering, National University of Defense Technology, Changsha 410073, Hunan,P.R.China2Hunan Key Laboratory for Image Measurement and Vision Navigation, Changsha 410073, Hunan, P.R.China
Competing interests
The authors declare that they have no competing interests.
Received: 27 June 2011 Accepted: 16 April 2012 Published: 16 April 2012
References
1. PR Kersten, JS Lee, TL Ainsworth, Unsupervised classification of polarimetric synthetic aperture radar images using fuzzy clustering and EM clustering. IEEE Trans Geosci Remote Sens.43(3), 519–527 (2005)
2. AE Zarrt, D Ziou, S Wang, Q Jiang, Segmentation of SAR images. Pattern Recogn.35(3), 713–724 (2002)
3. JS Lee, I Jurkevich, Segmentation of SAR images. IEEE Trans Geosci Remote Sens.27(6), 674–680 (1989)
4. B Ogor, V Haese-coat, J Ronsin, SAR image segmentation by mathematical morphology and texture analysis, inProceedings Int Geoscience and Remote Sensing Symposium, vol. 1. Lincoln, Nebraska, USA, pp. 717–719 (1996) 5. XL Ma, LC Jiao, SAR image segmentation based on watershed and spectral
clustering. J Infared Millim Waves.27(6), 452–457 (2008)
6. XR Zhang, LC Jiao, F Liu, LF Bo, MG Gong, Spectral clustering ensemble applied to SAR image segmentation. IEEE Trans Geosci Remote Sens.46(7), 2126–2135 (2008)
7. H Deng, DA Clausi, Unsupervised segmentation of synthetic aperture radar sea ice imagery using a novel Markov random field model. IEEE Trans Geosci Remote Sens.43(3), 528–538 (2005)
8. Y Dong, BC Forster, AK Milne, Comparison of radar image segmentation by Gaussian- and Gamma-Markov random field models. Int J Remote Sens. 24(4), 711–722 (2003)
9. J Shi, J Malik, Normalized cuts and image segmentation. IEEE Trans Pattern Anal Mach Intell.22(8), 888–905 (2000)
10. AY Ng, MI Jordan, Y Weiss, On spectral clustering: analysis and an algorithm. Adv Neural Inf Process Syst.14(14), 849–856 (2001) 11. J Matas, O Chun, M Urban, T Pajdla, Robust wide baseline stereo from
maximally stable extremal regions, inProceedings of British Machine Vision Conference, vol. 1. Cardiff, UK, pp. 384–394 (2002)
12. K Mikolajczyk, C Schmid, A performance evaluation of local descriptors. IEEE Trans Pattern Anal Mach Intell.27(10), 1615–1630 (2005)
13. A Bosch, A Zisserman, X Munoz, Scene classification via pLSA, inProceedings of European Conference on Computer Vision, vol. 4. Graz, Austria, pp. 517–530 (2006)
14. J Sivic, A Zisserman, Video Google: a text retrieval approach to object matching in videos, inProceedings of International Conference on Computer Vision, vol. 2. Nice, France, pp. 1470–1477 (2003)
15. XF He, D Cai, JR Wen, WY Ma, HJ Zhang, Clustering and searching WWW images using link and page layout analysis. ACM Trans Multimedia Comput Commun Appl.3(2) (2007). Article 10, doi:10.1145/1230812.1230816 16. DJ Higham, G Kalna, M Kibble, Spectral clustering and its use in
bioinformatics. J Comput Appl Math.204(1), 25–37 (2007) 17. T Cour, F Benezit, J Shi, Spectral segmentation with multi-scale graph
decomposition, inProceedings of IEEE Conference on Computer Vision and Pattern Recognition, vol. 2. San Diego, USA, pp. 1124–1131 (2005) 18. WB Tao, H Jin, Ship infrared object segmentation based on meanshift
filitering and graph spectral clustering. J Infrared Millim Waves.26(1), 61–64 (2007)
19. N Archip, R Rohling, P Cooperberg, H Tahmasebpour, SK Warfield, Spectral clustering algorithms for ultrasound image segmentation. Medical Image Computing and Computer-assisted in Intervention, Lecture notes in Computer Science.3750, 862–869 (2005)
20. RJ O’Callaghan, DR Bull, Combined morphological-spectral unsupervised image segmentation. IEEE Trans Image Process.14(1), 49–62 (2005) 21. C Fowlkes, S Belongie, F Chung, J Malik, Spectral grouping using the
Nystrom method. IEEE Trans Pattern Anal Mach Intell.26(2), 214–225 (2004) Table 2 Runtimes of different methods
Image number Time of Nystrom method (s)
Time of Ncut method [33](s) (gray, 160 × 107)
Time of proposed method (s)
Frost filtering + morphological closing
MSER Improved SC
Figure 3a 11.085 5.204 0.042 0.038 0.578
Figure 3b 12.732 5.613 0.045 0.039 0.673
Figure 3c 12.955 4.995 0.048 0.036 0.622
Figure 3d 11.634 4.036 0.046 0.033 0.624
Figure 3e (three classes)
11.525 5.132 0.048 0.037 0.656
Figure 3e (five classes)
22. WB Tao, H Jin, YM Zhang, Color Image Segmentation Based on Mean shift and Normalized Cuts. IEEE Trans Syst ManCybern Part B: Cybern.37(5), 1382–1389 (2007)
23. Y Boykov, V Kolmogorov, An experiment comparison of min-cut/max-flow algorithm for energy minimization in vision. IEEE Trans PAMI.26(9), 1124–1137 (2004)
24. Y Boykov, O Veksler, R Zabih, Fast approximate energy minimization via Graph Cuts. IEEE Trans PAMI.23(11), 1222–1239 (2004)
25. B Zhang, Generalized K-Harmonic means - dynamic weighting of data in unsupervised learning, inthe First SIAM International Conference on Data Mining, (Chicago, USA, 2001)
26. B Zhang, M Hsu, U Dayal, K-Harmonic means: a spatial clustering algorithm with boosting. Proceedings of the First Workshop on Temporal, Spatial, and Spatio-Temporal Data Mining-Revised Papers table of contents, Lecture notes in Computer Science.2007, 31–45 (2001)
27. Q Li, N Mitianoudis, T Stathaki, Spatial kernel K-Harmonic means clustering for multi-spectral image segmentation. IEEE Trans Image Process.1(2), 156–167 (2006)
28. F Kristensen, WJ MacLean, Real-time extraction of maximally stable extremal regions on an FPGA, inIEEE International Symposium on Circuits and Systems, Orleans, Louisiana, USA, pp. 165–168 (2007)
29. D Nister, H Stewenius, Linear time maximally stable extremal regions, in Proceedings of European Conference on Computer Vision, vol. 5303. Marseille, France, pp. 183–196 (2008)
30. M Meila, JB Shi, A random walks view of spectral segmentation. AI Stat. 2001, 8–11 (2001)
31. UV Luxburg, O Bousquet, Limits of spectral clustering. Adv Neural Inf Process Syst.17, 857–864 (2005)
32. Sandia National Laboratories, http://www.sandia.gov/radar/imagery.html. Accessed 01-12-2011
33. T Cour, S Yu, J Shi, Normalized cuts matlab code. http://www.cis.upenn. edu/~jshi/software. Accessed 01-12-2011
doi:10.1186/1687-6180-2012-83
Cite this article as:Guiet al.:SAR image segmentation using MSER and
improved spectral clustering.EURASIP Journal on Advances in Signal Processing20122012:83.
Submit your manuscript to a
journal and benefi t from:
7 Convenient online submission 7 Rigorous peer review
7 Immediate publication on acceptance 7 Open access: articles freely available online 7 High visibility within the fi eld
7 Retaining the copyright to your article