O R I G I N A L R E S E A R C H
Decreased GFR and its joint association with type
2 diabetes and hypertension with prevalence and
severity of carotid plaque in a community
population in China
This article was published in the following Dove Press journal: Diabetes, Metabolic Syndrome and Obesity: Targets and Therapy
Qianzi Che1 Ying Yang2
Guanliang Cheng2 Jia Jia2
Fangfang Fan2 Jianping Li2 Yong Huo2 Dafang Chen1 Yan Zhang2
1Department of Epidemiology &
Biostatistics, Peking University Health
Science Center, Beijing, People’s Republic
of China;2Department of Cardiology,
Peking University First Hospital, Beijing,
People’s Republic of China
Background: Type 2 diabetes (T2DM), hypertension and kidney dysfunction are known
risk factors for cardiovascular disease, but their combined effect on carotid plaque remains uncertain. This study aims to assess the associations between T2DM, hypertension, kidney dysfunction and carotid plaque, and further explore the combined effect of three diseases.
Patients and methods:We conducted a cross-sectional analysis among 3,815
community-dwelling adults in a Chinese atherosclerosis cohort. Estimated glomerular filtration rate (eGFR), hypertension and T2DM were evaluated as risk factors for carotid plaque. The presence, number and total area of carotid plaques were also assessed. Using logistic model, mutinomial logistic model and generalized linear regression model, the relationship between risk factors and carotid plaque was examined.
Results: T2DM, hypertension, decreased GFR, and, inversely, eGFR, were independently
associated with the presence, number and total area of carotid plaque. Stratified analysis by T2DM and hypertension showed T2DM attenuated the association between eGFR change and carotid plaque. There was a cumulative relationship between three risk factors and carotid plaque burden. The OR for the number of plaques was 1.0 (reference), 1.55 to 2.03, 1.94 to 3.14, and 3.69 (allP<0.05), respectively, for individuals with none, one, two, and three risk factors. Likewise, combining three risk factors was associated with greater increase in total plaque area (β, 20.63; 95% CI, 14.04–27.22).
Conclusion: The coexistence of decreased GFR, diabetes and hypertension is associated
with increased risk of carotid plaque, and these comorbidities may contribute additively to the development of plaque.
Keywords:joint association, decreased GFR, T2DM, hypertension, carotid plaque
Introduction
Carotid plaque has been reported as a strong predictor of incident myocardial
infarct and ischemic stroke,1–4and helped reclassify up to 22.7% of participants
at intermediate risk of coronary heart disease in the Atherosclerosis Risk in
Communities study.5 Therefore, research on the risk factors for carotid plaque
could aid in the prevention of cardiovascular disease (CVD).
Traditional vascular risk factors include age, sex, smoking, diabetes, hypertension, family history of MI, physical activity (inverse), statin use and antihypertensive
medication.6 In addition to the established risk factors, accumulating evidence
Correspondence: Dafang Chen Department of Epidemiology and Biostatistics, Peking University Health Science Center, No. 38 Xueyuan Road,
Haidian District, Beijing 100191, People’s
Republic of China Tel +86 108 280 2644 Fax +86 108 280 2644 Email 1308065128@qq.com
Yan Zhang
Department of Cardiology, Peking University First Hospital, 8 Xishiku Street,
Xicheng District, Beijing, People’s
Republic of China Tel +86 010-83575728 Email drzhy1108@163.com
Diabetes, Metabolic Syndrome and Obesity: Targets and Therapy
Dove
press
open access to scientific and medical research
Open Access Full Text Article
Diabetes, Metabolic Syndrome and Obesity: Targets and Therapy downloaded from https://www.dovepress.com/ by 118.70.13.36 on 21-Aug-2020
suggests that kidney dysfunction may also increase the risk of atherosclerosis. Investigators have now demonstrated a two-fold increase in the risk of developing atrialfibrillation, congestive heart failure, coronary heart disease, and stroke in patients with estimated glomerularfiltration rate (eGFR) <60 mL/min/1.73 m2.7–10However, the correlation between
kidney dysfunction and carotid plaque remains uncertain.11
Type 2 diabetes (T2DM) and hypertension are currently the most common causes of chronic kidney dysfunction in developed countries. Moreover, hypertension increases the risk of renal and cardiovascular morbidity and mortality in diabetic patients.12–15Therefore, it is imperative to recognize the excess risk of developing atherosclerosis in patients with these conditions. Although it is well established that T2DM and hypertension are most prevalent risk factors for atherosclerosis,16–19the joint effect of T2DM, hypertension and kidney dysfunction on carotid plaque has not been pre-viously assessed. Herein, we measured GFR within a Chinese community-based atherosclerosis cohort, which concurrently collected information on carotid atherosclerosis content from all study participants via carotid ultrasonogra-phy. Our objective was to assess the joint associations of kidney dysfunction, especially decreased GFR, and the established risk factors of T2DM and hypertension with carotid plaque.
Materials and methods
Study subjects
This study used data from a community-based CVD cohort among residents in Gucheng and Pingguoyuan Community of Shijingshan District in Beijing, China, carried out from December 2011 to 2014. The eligible population included residents over the age of 40 and had health medical records in community health centers. Community residents were recruited by responding to recruitment posters that detailed the study and inviting phone calls. The study design and selection criteria have been introduced
before.20 We used the cross-sectional data collected
between May 2014 and July 2014 from the whole data-base. Initially, 3,882 participants were involved in the study. After excluding individuals with missing data on serum creatinine measurement and/or carotid artery ultra-sonography, a total analytic sample of 3,815 remained. Ethical approval for this study was obtained from the ethics committee of Peking University First Hospital, and each participant provided written informed consent. We adhered to the principles of the Declaration of Helsinki.
The procedures followed were in accordance with institu-tional guidelines.20
Data collection procedures
The data were collected by trained research staff according to a standard operating procedure. After obtaining
informed consent, trained interviewer administered
a standard questionnaire that collected detailed informa-tion on demographics, lifestyle factors, and medical
his-tory. Physical exercise was defined as consciously doing
exercise for >30 mins per time in the last 3 months.
Current drinking habit was defined as drinking once per
week at least half a year. Former drinking was defined as
refraining from drinking for at least half a year. Current
smoking was defined as smoking one cigarette per day for
at least half a year, and a lower quantity was defined as
non-smoking. Former smoking was defined as cessation of
smoking for at least half a year.
Participants underwent a routine physical examination as well as blood sampling. Physical examination included standardized measurements of height and weight, and body mass index (BMI) was calculated. Venous blood samples were drawn from the antecubital vein with 4 mL coagulation-promoting vacuum tubes in the morning after an overnight fasting. All blood specimens were processed
at thefield centers and immediately frozen until they were
shipped. Biochemistry index in plasma, including FBG, 2 hr PG, total cholesterol (TC), total triglycerides (TG), low-density lipoprotein cholesterol (LDL-C), high-density lipoprotein cholesterol were obtained by the automatic biochemical analyzer (Roche-C8000). Hyperlipidemia
was defined as LDL-C ≥3.37 mmol/L or TG≥1.7 mmol/
L or TC≥5.18 mmol/L or self-reported history of
hyperli-pidemia or use of lipid-lowering drugs.
De
fi
nition of T2DM and hypertension
All participants underwent standard 75-g oral glucose toler-ance tests (or, T2DM patients consume equivalent bread) with 2 hrs plasma glucose sampled. In light of the WHO diagnostic criteria from 1999, participants were defined as
having T2DM if they had an FBG≥7.0 mmol/L and
OGTT≥11.1 mmol/L or self-reported history of T2DM or if
they were currently taking any anti-T2DM treatment. Seated peripheral (brachial) BP was obtained for each participant after a 5-min rest using an Omron HEM-7117 electronic sphygmomanometer with the standard method of calibration and appropriately sized cuffs. BP was mea-sured three times on the right arm at the level of the heart
Diabetes, Metabolic Syndrome and Obesity: Targets and Therapy downloaded from https://www.dovepress.com/ by 118.70.13.36 on 21-Aug-2020
with a gap of 1 min between consecutive measurements. The average of the three measurements was used as the
final BP-value. According to 2013 ESC-ESH guidelines,
hypertension was defined as SBP≥140 mmHg or DBP≥90
mmHg, self-reported history of high blood pressure or antihypertensive drug usage.
Estimated glomerular
fi
ltration rate (eGFR)
Serum creatinine (µmol/L) was measured using Jaffe kinetic method on a Hitachi 7180 Automatic Analyzer in the labora-tory of Peking University First Hospital. eGFR was estimated using the following equation derived from the Chronic
Kidney Disease Epidemiology Collaboration (CKD-EPI):21
eGFR¼141minðSCr=κ;1ÞαmaxðSCr=κ;1Þ1:209 0:993 Age ½ 1:018 if female;
where Scr is serum creatinine concentration (mg/dL) and
age in years; κ, 0.7 for females and 0.9 for males; α,
−0.329 for females and −0.411 for males; min, the
mini-mum of Scr/kor 1; and max, the maximum of Scr/kor 1.
According to KDOQI Clinical Practice Guidelines for
Chronic Kidney Disease 2015.22 We refer to an
eGFR<60 mL/min/1.73 m2as decreased GFR.
Carotid ultrasonography
All participants underwent carotid ultrasonography using the GE Vivid ultrasound system equipped with an 8-MHz linear array vascular probe by a standardized protocol. In brief, carotid ultrasound was performed according to the standardized scanning and reading protocols by a trained
and certified sonographer. Our Carotid Intima-Media
Thickness (cIMT) protocol followed the Mannheim Carotid Intima-Media Thickness and Plaque Consensus (2004–2006–2011).23The cIMT of both the left and right common carotid arteries (CCAs) was measured.
Plaques were defined as focal structures encroaching
into the arterial lumen of at least 0.5 mm or 50% of the surrounding cIMT value, or demonstrating a thickness
>1.5 mm as measured from the intima–lumen interface to
the media–adventitia interface, at levels of CCA, bifurca-tion, internal carotid artery and external carotid artery.23 Each plaque was measured in a longitudinal view, choosing the plane in which the plaque is maximal. The view chosen
was frozen and magnified, the perimeter of the plaque was
traced with a cursor on the screen, and the cross-sectional area of that plaque was measured. Sonographers measured the plaque area twice per plaque and then took the mean value. In this study, carotid plaque was characterized by its
presence, number, and area. Number of carotid plaques was categorized intofive groups: 0, 1, 2, 3 and≥4 according to the distribution. The sum of all plaque areas was defined as the total plaque area.
Statistical analysis
All data were represented as mean (SD) for continuous variables and proportion for categorical variables. The primary outcomes of interest included the presence, num-ber, and total area of carotid plaque. The primary
predic-tors were T2DM (dichotomous), hypertension
(dichotomous) and eGFR that were evaluated as both dichotomous and continuous variable. First, we compared the demographic characteristics according to the presence
of carotid plaques using Student's t-test for continuous
variables, and Chi-square test for categorical ones. Next, we assessed the separate relation of T2DM, hypertension and eGFR (dichotomous and continuous variable) to the presence and number of carotid plaques using logistic regression model and multinomial logistic regression, respectively. We further used generalized linear regression to examine the associations between T2DM, hypertension, eGFR and the total area of plaque. To determine whether a joint effect exists between T2DM, hypertension and decreased GFR with respect to the characteristics of
pla-ques, we performed stratified analyses according to
dia-betes and hypertension status, and tested multiplicative interactions by creating an interaction term and using a likelihood ratio test. Finally, we calculated the ORs associated with different combinations of T2DM, hyper-tension and decreased GFR.
Potential confounders were determined a priori; final
models adjusted for the following covariates: age, sex, education level, BMI, drinking and smoking status, physi-cal exercise, hypertension, hyperlipidemia, and diabetes and hypertension medications. ORs and their 95% CIs
were computed for primary predictors. Significance testing
for all models was 2-sided and aP<0.05 was considered
statistically significant. All analyses were performed using SAS version 9.4 software (SAS Institute Inc., Cary, NC, USA).
Results
Baseline characteristics categorized by
the presence of carotid plaque
Table 1displays the characteristics of the study
popula-tion according to the presence of carotid plaque. Of all
Diabetes, Metabolic Syndrome and Obesity: Targets and Therapy downloaded from https://www.dovepress.com/ by 118.70.13.36 on 21-Aug-2020
Table 1Characteristics of participants in the total sample and subgroups categorized by the presence of carotid plaque
Characteristics Total sample
(n=3,815)
Plaque absent (n=1,651)
Plaque present (n=2,164)
P
Age, years, mean (SD) 59.10 (8.65) 55.63 (7.14) 61.74 (8.77) <0.001
Male gender, N (%) 1,377 (36.09) 433 (26.23) 944 (43.57) <0.001
Body mass index, kg/m2, mean (SD) 25.98 (3.54) 25.85 (3.57) 26.08 (3.51) 0.0418
Education, N (%) <0.001
≤Middle school 1,460 (38.27) 500 (30.28) 960 (44.36)
High school 1,732 (45.40) 873 (52.88) 859 (39.70)
≥Undergraduate 623 (16.33) 278 (16.84) 345 (15.94)
Physical exercise,≥5 times/per week, N (%) 2,897 (75.94) 1,210 (73.29) 1,687 (77.96) <0.001
Drinking status, N (%) <0.001
Never 3,211 (84.17) 1,444 (87.46) 1,767 (81.65)
Quit 69 (1.81) 25 (1.51) 44 (2.03)
Current 535 (14.02) 182 (11.02) 353 (16.31)
Smoking status, N (%) <0.001
Never 3,107 (81.44) 1,413 (85.58) 1,694 (78.28)
Quit 93 (2.44) 27 (1.64) 66 (3.05)
Current 615 (16.12) 211 (12.78) 404 (18.67)
Glomerularfiltration rate, mL/min per 1.73 m2, mean
(SD)
69.60 (11.69) 71.75 (11.07) 67.95 (11.88) <0.001
Decreased GFR, N (%) 696 (18.24) 200 (12.11) 496 (22.92) <0.001
T2DM, N (%) 776 (20.34) 207 (12.54) 569 (26.29) <0.001
T2DM duration, years, mean (SD) 9.25 (7.60) 7.81 (6.62) 9.74 (7.85) 0.006
Hypertension, N (%) 1,782 (46.54) 580 (35.09) 1,202 (55.24) <0.001
Hypertension duration, years, mean (SD) 12.91 (10.77) 10.86 (9.48) 13.86 (11.20) <0.001
Hyperlipidemia, N (%) 2,649 (69.44) 1,098 (66.51) 1,551 (71.67) <0.001
Hypertension medication, N (%) 719 (21.94) 247 (16.18) 472 (26.97) <0.001
Diabetes medication, N (%) 237 (7.23) 65 (4.26) 172 (9.83) <0.001
Total cholesterol, mmol/L, mean (SD) 5.00 (0.99) 5.04 (0.95) 4.97 (1.01) 0.0088
Triglyceride, mmol/L, mean (SD) 1.75 (1.36) 1.77 (1.53) 1.74 (1.21) 0.4073
HDL-cholesterol, mmol/L, mean (SD) 1.22 (0.29) 1.25 (0.30) 1.20 (0.28) <0.001
LDL-cholesterol, mmol/L, mean (SD) 2.92 (0.81) 2.94 (0.77) 2.92 (0.84) 0.3558
The number of plaque, N (%)
0 1,651 (43.28) 1,651 (100.00)
1 944 (24.74) 944 (43.62)
2 592 (15.52) 592 (27.36)
(Continued)
Diabetes, Metabolic Syndrome and Obesity: Targets and Therapy downloaded from https://www.dovepress.com/ by 118.70.13.36 on 21-Aug-2020
the 3,815 individuals enrolled, mean (SD) age of parti-cipants was 59.10 (8.65) years, 36.09% were male, and
mean (SD) eGFR was 69.60 (11.69) mL/min/1.73 m2.
A total of 2,164 participants (56.72%) had carotid pla-que, 776 (20.34%) were with T2DM. Participants who developed carotid plaque tended to be older and to have a higher prevalence of decreased GFR, T2DM, hyper-tension, hyperlipidemia, and medications for
hyperten-sion or diabetes (all Ps<0.001). There were also
significant differences with regard to the distribution of
education, drinking and smoking status, duration of
dia-betes and hypertension between two groups (all
Ps<0.001).
T2DM, hypertension, eGFR, and carotid
plaque
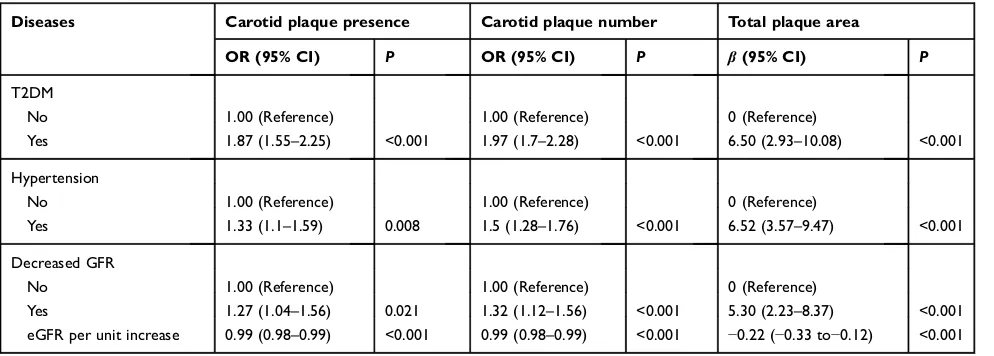
The multivariable-adjusted relationships between
T2DM, hypertension, eGFR (dichotomous and continu-ous variable) and carotid plaque among all the subjects
are provided in Table 2. After adjusting for potential
confounders, logistic regression analysis showed that
OR of T2DM was 1.87 (95% CI, 1.55–2.25) for an
increased risk of carotid plaque. T2DM was also
sig-nificantly related to plaque number (OR, 1.97; 95% CI,
1.70–2.28), and total plaque area (β, 6.50; 95% CI,
2.93–10.08). Similarly, hypertension was independently
associated with carotid plaque presence (OR, 1.33; 95%
CI, 1.10–1.59), number (OR, 1.50; 95% CI, 1.28–1.76),
and total area (β, 6.52; 95% CI, 3.57–9.47).
Significant correlations between kidney dysfunction
and carotid plaque were also observed. As a dichotomous variable, decreased GFR was independently associated
with presence (OR, 1.27; 95% CI, 1.04–1.56), number
(OR, 1.32; 95% CI, 1.12–1.56), and total area (β, 5.30;
95% CI, 2.23–8.37) of carotid plaque. While as
a continuous variable, eGFR had an OR of 0.99 (95% CI, 0.98–0.99) for both the presence and number of carotid plaques and showed a negative correlation with total pla-que area (β,−0.22; 95% CI−0.33−0.12).
Table 2Association of T2DM, hypertension, and eGFR with carotid plaque
Diseases Carotid plaque presence Carotid plaque number Total plaque area
OR (95% CI) P OR (95% CI) P β(95% CI) P
T2DM
No 1.00 (Reference) 1.00 (Reference) 0 (Reference)
Yes 1.87 (1.55–2.25) <0.001 1.97 (1.7–2.28) <0.001 6.50 (2.93–10.08) <0.001
Hypertension
No 1.00 (Reference) 1.00 (Reference) 0 (Reference)
Yes 1.33 (1.1–1.59) 0.008 1.5 (1.28–1.76) <0.001 6.52 (3.57–9.47) <0.001
Decreased GFR
No 1.00 (Reference) 1.00 (Reference) 0 (Reference)
Yes 1.27 (1.04–1.56) 0.021 1.32 (1.12–1.56) <0.001 5.30 (2.23–8.37) <0.001
eGFR per unit increase 0.99 (0.98–0.99) <0.001 0.99 (0.98–0.99) <0.001 −0.22 (−0.33 to−0.12) <0.001
Notes:Decreased GFR is defined as a GFR<60 mL/min/1.73 m2
; logistic regression models, multinomial logistic regression, and generalized linear regression models were adjusted for the confounders including age, sex, education, BMI, drinking and smoking status, physical exercise, hypertension, hyperlipidemia, and diabetes and hypertension medications. Abbeviations:T2DM, type 2 diabetes; eGFR, estimated glomerularfiltration rate; BMI, body mass index.
Table 1(Continued).
Characteristics Total sample
(n=3,815)
Plaque absent (n=1,651)
Plaque present (n=2,164)
P
3 257 (6.74) 257 (11.88)
4 371 (9.72) 371 (17.14)
Abbreviations: T2DM, type 2 diabetes; eGFR, estimated glomerular filtration rate; HDL-C, high-density lipoprotein cholesterol; LDL-C low-density lipoprotein cholesterol; TC, total cholesterol; TG, total triglycerides.
Diabetes, Metabolic Syndrome and Obesity: Targets and Therapy downloaded from https://www.dovepress.com/ by 118.70.13.36 on 21-Aug-2020
Association of eGFR and T2DM or
hypertension with carotid plaque
We observed important differences in the association between eGFR and carotid plaque across the strata for
T2DM (Table 3). In the absence of T2DM, changes in
eGFR were associated with increased presence, number and total area of carotid plaques (allPs<0.05). However, in the presence of T2DM, although eGFR per unit increase was still
associated with 0.27 (95% CI−0.50 to−0.03)mm2decrease
in total plaque area, the associations of eGFR with the
pre-sence and number of plaques lost their significance.
Nevertheless, multiplicative interactions between T2DM and eGFR were not significant (all Ps>0.05). In contrast, stratified analysis did not identify effect modification of
hypertension to eGFR change and carotid plaque (Table 4).
T2DM and eGFR are significantly associated with the
pre-sence, number and total area of plaques among participants both with and without hypertension.
We further explored the joint association of
decreased GFR, T2DM, and hypertension with carotid
plaque (Table 5). Participants without any one of these
three diseases were used as the reference. For the pre-sence of carotid plaque, the OR of a combination of T2DM, hypertension and decreased GFR (OR, 2.33;
95% CI, 1.49–3.64), although slightly less than that of
T2DM combined with hypertension, was obviously greater than that of T2DM, hypertension or decreased GFR alone. For number of carotid plaques, the OR was greatest when T2DM, hypertension and decreased GFR
were present (OR, 3.69; 95% CI, 2.65–5.14). In the
absence of hypertension, decreased GFR was not
sig-nificantly associated with increased total plaque area in
T2DM patients (β, 7.20; 95% CI,−2.78– 17.18). The
total area of carotid plaque increased for hypertension
patients in the presence of either decreased GFR (β,
11.30; 95% CI, 6.38–16.21) or T2DM (β, 13.00; 95%
CI, 8.00–18.00). The strongest association was also seen
in the combination of three status (β, 20.63; 95% CI,
14.04–27.22).
Discussion
In this study, we found that the association between
decreased GFR and carotid plaque was influenced by
T2DM and hypertension. A synergistic association was found between decreased GFR with T2DM or hyperten-sion and the prevalence and severity of carotid plaque. Therefore, coexisting T2DM, hypertension and decreased GFR may contribute to further elevated risk of carotid plaque and CVD.
Multiple studies have been carried out to assess the association of different cutoffs of eGFR with the risk of
CVD after adjustment for traditional risk factors.24–27
Carotid plaque represents very high CVD risk that
gener-ally requires the preventive use of CVD drugs,28,29
whereas the association between eGFR and carotid plaque may seem paradoxical. In Beijing Longitudinal Study of Aging (BLSA), eGFR was related to the presence of
carotid plaque.30 Similar results were found in the Third
Table 3Association between eGFR and carotid plaque in different sub-groups according to the presence or not of T2DM
Diseases Carotid plaque presence Carotid plaque number Total plaque area
OR (95% CI) P OR (95% CI) P β(95% CI) P
Non-diabetes
Decreased GFR
No 1 (Reference) 1 (Reference) 0 (Reference)
Yes 1.42 (1.12–1.78) 0.003 1.38 (1.14–1.67) <0.001 5.35 (1.83–8.86) 0.003
eGFR per unit increase 0.99 (0.98–0.99) <0.001 0.99 (0.98–0.99) <0.001 −0.21 (−0.32 to−0.09) <0.001
Diabetes
Decreased GFR
No 1 (Reference) 1 (Reference) 0 (Reference)
Yes 0.82 (0.52–1.29) 0.39 1.51 (0.84–1.58) 0.39 5.26 (−1.05–11.58) 0.10
eGFR per unit increase 1.00 (0.98–1.01) 0.55 0.99 (0.98–1.00) 0.078 −0.27 (−0.50 to−0.03) 0.027
Notes:Decreased GFR is defined as a GFR<60 mL/min/1.73 m2
; logistic regression models, multinomial logistic regression, and generalized linear regression models were adjusted for the confounders including age, sex, education, BMI, drinking and smoking status, physical exercise, hypertension, hyperlipidemia, and diabetes and hypertension medications.
Abbreviations:T2DM, type2 diabetes; eGFR, estimated glomerularfiltration rate; BMI, body mass index.
Diabetes, Metabolic Syndrome and Obesity: Targets and Therapy downloaded from https://www.dovepress.com/ by 118.70.13.36 on 21-Aug-2020
National Health and Nutrition Examination Survey, for
a significant association between low eGFR and plaque
presence.31 In contrast, in the Renal Iohexol Clearance
Survey in Tromsø 6 (RENIS-T6), there was a tendency for a U-shaped relationship between eGFR and total pla-que area, but nonlinear models were not statistically
significant.32A cross-sectional study on Japanese women
reported that albuminuria, but not low eGFR, was asso-ciated with carotid plaque.33Notably, most of these studies are hospital-based design and eGFR was assessed by dif-ferent equations.
The present study was based on a large population-based cohort with a relatively high proportion of partici-pant having normal kidney function, while eGFR was estimated by the CKD-EPI equation. Our study revealed that decreased GFR was associated with the presence, number and total area of carotid plaque independent of conventional risk factors. Moreover, the relation of con-tinuous form of eGFR to plaque indicated that even small reductions in GFR within the apparently normal range may contribute to the increased prevalence of plaque; thus, eGFR level may play a predictive role for cardiovascular events.
Although after adjusting for other covariates,
decreased GFR was not significantly associated with
the presence and number of carotid plaque in T2DM patients. This result is consistent with a previous study in which reduced eGFR was not associated with
athero-sclerosis in patients with T2DM.34 The result may be
due to the fact that T2DM itself has such a powerful
influence on carotid plaque that any effect of eGFR
decline is masked.34
T2DM and hypertension are conventional risk factors for CVD. Affecting the entire vascular system, it is per-haps not surprising that T2DM is also associated with
subclinical vascular disease measures. Multi-Ethnic
Study of Atherosclerosis demonstrated that diabetes was associated with an increased prevalence of aortic valve calcium (incidence rate ratio: 2.1 for diabetes in women
and 1.7 for men) and thoracic aortic calcification.35
Another population-based study in Iceland reported that T2DM was one of the strongest risk factors associated with the presence of carotid plaque (OR, 1.44; 95% CI, 1.02–2.04).18 Similarly, it has long been established that systolic blood pressure (OR 1.2 per 10 mmHg increase) is
one of the predictors of carotid stenosis,36 with many
studies confirming the direct correlation between hyperten-sion and carotid plaque.37–39In this study, the risk estimate that we observed for T2DM (OR, 1.87; 95% CI,
1.55–2.25) and hypertension (OR, 1.33; 95% CI,
1.10–1.59) is consistent with most previously reported
estimates.18,40–42 The consistency of our findings with prior results lends weight to the evidence that T2DM and hypertension are strong detrimental factors for carotid plaque.
Although the relationship between individual risk fac-tors and carotid plaque has been proved, the combined effect of three risk factors cannot be ignored. In this study, we found that OR for patients with 3 risk factors versus no risk factors for the number of plaques was 3.69
Table 4Association between eGFR and carotid plaque in different sub-groups according to the presence or not of hypertension
Diseases Carotid plaque presence Carotid plaque number Total plaque area
OR (95% CI) P OR (95% CI) P β(95% CI) P
Non-hypertension
Decreased GFR
No 1 (Reference) 1 (Reference) 0 (Reference)
Yes 1.35 (1.03–1.78) 0.032 1.25 (1.01–1.54) 0.011 4.82 (1.95–7.70) 0.001
eGFR per unit increase 0.98 (0.97–0.99) <0.001 0.98 (0.97–0.99) <0.001 −0.19 (−0.28 to−0.10) <0.001
Hypertension
Decreased GFR
No 1 (Reference) 1 (Reference) 0 (Reference)
Yes 1.22 (0.93–1.61) 0.16 1.25 (1.01–1.54) 0.039 6.04 (0.79–11.29) 0.024
eGFR per unit increase 0.99 (0.98–0.99) 0.042 0.99 (0.98–0.99) 0.009 −0.26 (−0.45 to−0.07) 0.008
Notes:Decreased GFR is defined as a GFR<60 mL/min/1.73 m2
; logistic regression models, multinomial logistic regression, and generalized linear regression models were adjusted for the confounders including age, sex, education, BMI, drinking and smoking status, physical exercise, hypertension, hyperlipidemia, and diabetes and hypertension medications.
Abbreviations:T2DM, type 2 diabetes; eGFR, estimated glomerularfiltration rate; BMI, body mass index.
Diabetes, Metabolic Syndrome and Obesity: Targets and Therapy downloaded from https://www.dovepress.com/ by 118.70.13.36 on 21-Aug-2020
T able 5 Joint association of decr eased GFR, T2DM and h ypertension with car otid plaque Non-diabetes Diabetes Car otid plaque pr esence Car otid plaque number T otal plaque ar ea Car otid plaque pr esence Car otid plaque number T otal plaque ar ea OR (95% CI) OR (95% CI) β (95% CI) OR (95% CI) OR (95% CI) β (95% CI) Non-h yperten sion Decr eased GFR No 1 (Refer ence) 1 (Refer ence) 0 (Refer ence) 1.74 (1.29 – 2.35) 2.03 (1.56 – 2.63) 5.52 (0.18 – 10.85) Ye s 1.47 (1.07 – 2.03) 1.57 (1.19 – 2.07) 5.16 (0.07 – 10.26) 2.06 (1.06 – 3.99) 2.38 (1.43 – 3.94) 7.20 ( − 2.78 – 17.18) Hyper tension Decr eased GFR No 1.30 (1.06 – 1.60) 1.55 (1.29 – 1.86) 6.11 (2.77 – 9.45) 3.03 (2.22 – 4.12) 3.14 (2.46 – 4.00) 13.00 (8.00 – 18.00) Ye s 1.74 (1.26 – 2.41) 1.94 (1.49 – 2.52) 11.30 (6.38 – 16.21) 2.33 (1.49 – 3.64) 3.69 (2.65 – 5.14) 20.63 (14.04 – 27.22) Notes: Decreased GFR is de fi ned as a GFR < 60 ml/min/ 1.73 m 2; logistic regression models, multinomial logistic re gr ession, and generalized linear re gr ession models w er e adjusted for the confounders includ ing age, sex, education, BMI, drinking and smoking status, ph ysical ex er cise, h yper tension, h yperlipidemia, and diabetes and h ypertension medications. Numbers in bold indica te statistical signi fi cance ( P <0.05). Abbre viations: T2DM, type 2 diabetes; eGFR, estimated glomerular fi ltration rate.
Diabetes, Metabolic Syndrome and Obesity: Targets and Therapy downloaded from https://www.dovepress.com/ by 118.70.13.36 on 21-Aug-2020
(95% CI, 2.65–5.14). Chuang et al concluded that hyper-tension and dyslipidemia with type 2 diabetes have cumu-lative effects on the burden of carotid plaque.43Niu et al in their comparative study concluded that three or more car-diovascular risk factors have a greater impact on cIMT and
elasticity than two or less cardiovascular risk factors.44
Previous studies have shown that hypertension, T2DM, and CKD induce abnormal shearing pressure to the
endothelium, inflammation, insulin resistance, endothelial
dysfunction and more severe oxidative stress in blood, which all participate in the pathogenesis of vascular disease.43,45–47However, the mechanisms by which three risk factors may have synergistic effects on the increased
carotid plaque burden need to be confirmed in future
studies.
Therefore, our study suggests that onset of
nephro-pathy in patients with T2DM and hypertension
increases the carotid plaque burden, while control of renal function could mitigate the adverse effects of T2DM and hypertension on carotid plaque progression. It is demonstrated that eGFR per unit increase was associated with 0.27 and 0.26 unit reduction in total plaque area in participants with T2DM and hyperten-sion, respectively.
Limitations
Several limitations should be acknowledged. This is a cross-sectional study showing only associations between T2DM, hypertension, eGFR and carotid plaque, which limits the power of causal inference. In addition, ourfi nd-ings might be only generalizable to community-dwelling Chinese adults who would have been healthy enough to
attend the health center assessment. However, ourfindings
provide further evidence that T2DM, hypertension and kidney dysfunction are all important factors affecting sub-clinical CVD. More prospective, population-based studies with large cohort are needed to provide a better interpretation.
Conclusion
Individuals with coexisting decreased GFR, T2DM and hypertension are at high risk of carotid plaque, with each condition contributing additively to plaque risk. Additional studies are needed to determine the extent to which anti-diabetic and anti-hypertensive therapy combined with the appropriate CKD treatment can lead to prevention of car-otid atherosclerosis.
Acknowledgments
The study was supported by grants from the National
Natural Science Foundation of China (81172768,
81872692), Beijing Municipal Natural Science Foundation (7182085) and the University of Michigan Health System and Peking University Health Science Center (UM-PUHSC) Joint Institute for Translational and Clinical Research (BMU20110177). We appreciate the staff in Pingguoyuan and Gucheng Community Health Centers and research coor-dinators for the assistance to data acquisition.
Disclosure
The authors report no conflicts of interest in this work.
References
1. Polak JF, Pencina MJ, Pencina KM, et al. Carotidwall intima-media
thickness and cardiovascular events. N Engl J Med.
2011;365:213–221. doi:10.1056/NEJMoa0910383
2. Chambless LE, Folsom AR, Clegg LX, et al. Carotid wall thickness is predictive of incident clinical stroke: the Atherosclerosis Risk in
Communities (ARIC) study. Am J Epidemiol. 2000;151:478–487.
doi:10.1093/oxfordjournals.aje.a010213
3. Chambless LE, Heiss G, Folsom AR, et al. Association of coronary heart disease incidence with carotid arterial wall thickness and major risk factors: the Atherosclerosis Risk in Communities (ARIC) study,
1987–1993. Am J Epidemiol. 1997;146:483–494. doi:10.1093/
oxfordjournals.aje.a009302
4. O’Leary DH, Polak JF, Kronmal RA, et al. Carotid-artery intima and
media thickness as a risk factor for myocardial infarction and stroke in older adults Cardiovascular Health Study Collaborative Research
Group. N Engl J Med. 1999;340:14–22. doi:10.1056/NEJM199
905133401909
5. Nambi V, Chambless L, Folsom AR, et al. Carotid intima-media thickness and presence or absence of plaque improves prediction of
coronary heart disease risk: the ARIC study. J Am Coll Cardiol.
2010;55:1600–1607. doi:10.1016/j.jacc.2009.11.075
6. Mirzabeigi P, Mohammadpour AH, Salarifar M, et al. The effect of curcumin on some of traditional and non-traditional cardiovascular risk factors: a pilot randomized, double-blind, placebo-controlled
trial.Iran J Pharm Res.2015;14(2):479–486.
7. Kottgen A, Russell SD, Loehr LR, et al. Reduced kidney function as a risk factor for incident heart failure: the Atherosclerosis Risk In
Communities (ARIC) study. J Am Soc Nephrol. 2007;18:
1307–1315.
8. Abramson JL, Jurkovitz CT, Vaccarino V, Weintraub WS,
McClellan W. Chronic kidney disease, anemia, and incident stroke in a middle-aged, community-based population: the ARIC study.
Kidney Int.2003;64:610–615. doi:10.1046/j.1523-1755.2003.00109.x
9. Astor BC, Coresh J, Heiss G, Pettitt D, Sarnak MJ. Kidney function and anemia as risk factors for coronary heart disease and mortality:
the Atherosclerosis Risk in Communities (ARIC) study.Am Heart J.
2006;151:492–500. doi:10.1016/j.ahj.2005.10.019
10. Alonso A, Lopez FL, Matsushita K, et al. Chronic kidney disease is
associated with the incidence of atrialfibrillation: the Atherosclerosis
Risk In Communities (ARIC) study. Circulation.
2011;123:2946–2953. doi:10.1161/CIRCULATIONAHA.111.020982
11. Tanaka M, Abe Y, Furukado S, et al. Chronic kidney disease and
carotid atherosclerosis. J Stroke Cerebrovascular Dis.
2012;21:47–51. doi:10.1016/j.jstrokecerebrovasdis.2010.03.018
Diabetes, Metabolic Syndrome and Obesity: Targets and Therapy downloaded from https://www.dovepress.com/ by 118.70.13.36 on 21-Aug-2020
12. De CS, Rossi MC, Pellegrini F, et al. Kidney dysfunction and related cardiovascular risk factors among patients with type 2 diabetes.
Nephrol Dialysis Transplant. 2014;29(3):657. doi:10.
1093/ndt/gft506
13. Pavkov ME, Knowler WC, Lemley KV, et al. Early renal function
decline in type 2 diabetes.Clin J Am Soc Nephrol CJASN.2012;7
(1):78. doi:10.2215/CJN.10251011
14. Bailey RA, Wang Y, Zhu V, et al. Chronic kidney disease in US adults with type 2 diabetes: an updated national estimate of prevalence based on
kidney disease: improving Global Outcomes (KDIGO) staging.BMC
Res Notes.2014;7(1):1–7. doi:10.1186/1756-0500-7-1
15. Verma A, Vyas S, Agarwal A, et al. Diabetic kidney disease and
hyperten-sion: a true love story.J Clin Diagn Res Jcdr.2016;10(3):OC11.
16. Gray SP, Jandeleitdahm K. The pathobiology of diabetic vascular
complications–cardiovascular and kidney disease. J Mol Med.
2014;92(5):441–452. doi:10.1007/s00109-014-1146-1
17. Högberg D, Kragsterman B, Björck M, Tjärnström J, Wanhainen A.
Carotid artery atherosclerosis among 65-year-old Swedish men –
a population-based screening study.Eur J Vasc Endovascular Surg.
2014;48(1):5–10. doi:10.1016/j.ejvs.2014.02.004
18. Ran S, Aspelund T, Bjornsdottir G, et al. Prevalence and determi-nants of carotid plaque in the cross-sectional REFINE-Reykjavik
study. BMJ Open. 2016;6(11):e012457.
doi:10.1136/bmjopen-2016-012457
19. Mostaza JM, Lahoz C, Salinero-Fort MA, et al. Carotid atherosclero-sis severity in relation to glycemic status: a cross-sectional population
study. Atherosclerosis. 2015;242(2):377–382. doi:10.1016/j.
atherosclerosis.2015.07.028
20. Fan F, Qi L, Jia J, et al. Noninvasive central systolic blood pressure is more strongly related to kidney function decline than peripheral systolic blood pressure in a Chinese community-based population.
Hypertension. 2016;67:1166–1172. doi:10.1161/HYPERTENSIO
NAHA.115.07019
21. Levey AS, Stevens LA, Schmid CH, et al. CKD-EPI (Chronic kidney disease epidemiology collaboration). A new equationto
estimate glomerular fltration rate. Ann Intern Med. 2009;
150:604–612.
22. Andrassy KM. Comments on ‘KDIGO 2012 clinical practice
guideline for the evaluation and management of chronic kidney
disease’. Kidney Int. 2013;84(3):622–623. doi:10.1038/
ki.2013.243
23. Touboul PJ, Hennerici MG, Meairs S, et al. Mannheim carotid
intima-media thickness and plaque consensus
(2004-2006-2011).Cerebrovasc Dis.2012;34:290–296. doi:10.1159/000343145
24. Go AS, Chertow GM, Fan D, et al. Chronic kidney disease and the
risks of death, cardiovascular events, and hospitalization. N Engl
J Med.2004;351(13):1296–1305. doi:10.1056/NEJMoa041031
25. Shlipak MG, Fried LF, Crump C, et al. Cardiovascular disease risk
status in elderly persons with renal insufficiency. Kidney Int.
2002;62:997–1004. doi:10.1046/j.1523-1755.2002.00522.x
26. Muntner P, He J, Hamm L, Loria C, Whelton PK. Renal insufficiency
and subsequent death resulting from cardiovascular disease in the
United States.J Am Soc Nephrol.2002;13:745–753.
27. Ninomiya T, Kiyohara Y, Tokuda Y, et al. Impact of kidney disease and blood pressure on the development of cardiovascular disease: an overview from the Japan Arteriosclerosis Longitudinal study.
Circulation. 2008;118(25):2694–2701. doi:10.1161/CIRCULAT
IONAHA.108.792903
28. Perk J, De Backer G, Gohlke H, et al. European guidelines on cardiovascular disease prevention in clinical practice (version 2012). The Fifth Joint Task Force of the European Society of Cardiology and other Societies on cardiovascular disease prevention in clinical practice (constituted by representatives of nine societies and by invited experts). Developed with the special contribution of
the European Association for Cardiovascular Prevention &
Rehabilitation (EACPR).Atherosclerosis.2012;223:1–68.
29. Greenland P, Alpert JS, Beller GA, et al. 2010 ACCF/AHA guideline for assessment of cardiovascular risk in asymptomatic adults: a report of the American College of Cardiology Foundation/American Heart
Association Task Force on practice guidelines.J Am Coll Cardiol.
2010;56:e50–103. doi:10.1016/j.jacc.2010.09.001
30. Gu X, Fang X, Hua Y, et al. Association between kidney dysfunction and carotid atherosclerosis in community-based older adults in China.
Angiology.2015;67(3):252–258.
31. Leoncini G, Viazzi F, Parodi D, et al. Mild renal dysfunction and
cardiovascular risk in hypertensive patients.J Am Soc Nephrol Jasn.
2004;15 Suppl 1(1):S88. doi:10.1097/01.ASN.0000093245.78097.CD
32. Eriksen BO, Løchen ML, Arntzen KA, et al. Subclinical
cardiovas-cular disease is associated with a high glomerularfiltration rate in the
nondiabetic general population. Kidney International. 2014;86
(1):146–153. doi:10.1038/ki.2013.470
33. Ishizaka Y, Ishizaka N, Tani M, et al. Relationship between albuminuria,
low eGFR, and carotid atherosclerosis in Japanese Women. Kidney
Blood Press Res.2008;31(3):164–170. doi:10.1159/000131750
34. Sjöblom P, Nystrom FH, Länne T, et al. Microalbuminuria, but not reduced eGFR, is associated with cardiovascular subclinical organ
damage in type 2 diabetes. Diabetes Metab. 2014;40(1):49–55.
doi:10.1016/j.diabet.2013.09.008
35. Katz R, Wong ND, Kronmal R, et al. Features of the metabolic
syndrome and diabetes mellitus as predictors of aortic valve calcifi
-cation in the multi-ethnic study of atherosclerosis. Circulation.
2006;113:2113–2119. doi:10.1161/CIRCULATIONAHA.105.598086
36. Fine-Edelstein JS, Wolf PA, O’Leary DH, et al. Precursors of
extra-cranial carotid atherosclerosis in the Framingham Study.Neurology.
1994;44(6):1046–1050. doi:10.1212/wnl.44.6.1046
37. Cao JJ, Thach C, Manolio TA, et al. Association of carotid artery intima-media thickness, plaques, and C-reactive protein with future cardiovascular disease and all-cause mortality: the Cardiovascular
Health study. Circulation. 2007;116:32–38. doi:10.1161/
CIRCULATIONAHA.106.645606
38. Spence JD, Hegele RA. Noninvasive phenotypes of atherosclerosis:
similar windows but different views. Stroke. 2004;35:649–653.
doi:10.1161/01.STR.0000116103.19029.DB
39. Delcker A, Diener HC, Wilhelm H. Influence of vascular risk factors
for atherosclerotic carotid artery plaque progression. Stroke.
1995;26:2016–2022. doi:10.1161/01.STR.26.11.2016
40. Prati P, Vanuzzo D, Casaroli M, et al. Prevalence and determinants of
carotid atherosclerosis in a general population. Stroke. 1992;23
(12):1705. doi:10.1161/01.STR.23.12.1705
41. Zhan C, Shi M, Yang Y, et al. Prevalence and risk factors of carotid plaque among middle-aged and elderly adults in Rural Tianjin, China.
Sci Rep.2016;6:23870. doi:10.1038/srep23870
42. Huang LC, Lin RT, Chen CF, et al. Predictors of carotid intima-media
thickness and plaque progression in a Chinese Population.
J Atherosclerosis Thrombosis.2016. doi:10.5551/jat.32177
43. Yuan C, Lai C, Chan L, et al. Cumulative effects of hypertension, dyslipidemia, and chronic kidney disease on carotid atherosclerosis in
Chinese patients with type 2 diabetes mellitus. J Diabetes Res.
2014;2014(19):179686. doi:10.1155/2014/179686
44. Niu L, Zhang Y, Qian M, et al. Impact of multiple cardiovascular risk
factors on carotid intima-media thickness and elasticity.PLoS One.
2013;8:e67809. doi:10.1371/journal.pone.0067809
45. Manjunath G, Tighiouart H, Ibrahim H, et al. Level of kidney function as a risk factor for atherosclerotic cardiovascular disease in the community.
J Am Coll Cardiol.2003;41:47–55. doi:10.1016/S0735-1097(02)02663-3
46. Sonmez A, Yilmaz MI, Saglam M, et al. The relationship between
hemo-globin levels and endothelial functions in diabetes mellitus.Clin J Am Soc
Nephrol CJASN.2010;5(1):45–50. doi:10.2215/CJN.05080709
47. Nobuo K, Uchida HA, Isao S, et al. Chronic kidney disease is associated with carotid atherosclerosis and symptomatic
ischae-mic stroke. J Int Med. 2018;46(9):3873–3883. doi:10.1177/
0300060518781619
Diabetes, Metabolic Syndrome and Obesity: Targets and Therapy downloaded from https://www.dovepress.com/ by 118.70.13.36 on 21-Aug-2020
Diabetes, Metabolic Syndrome and Obesity: Targets and Therapy
Dove
press
Publish your work in this journal
Diabetes, Metabolic Syndrome and Obesity: Targets and Therapy is an international, peer-reviewed open-access journal committed to the
rapid publication of the latest laboratory and clinicalfindings in the
fields of diabetes, metabolic syndrome and obesity research. Original
research, review, case reports, hypothesis formation, expert opinion
and commentaries are all considered for publication. The manu-script management system is completely online and includes a very quick and fair peer-review system, which is all easy to use. Visit http://www.dovepress.com/testimonials.php to read real quotes from published authors.
Submit your manuscript here:https://www.dovepress.com/diabetes-metabolic-syndrome-and-obesity-targets-and-therapy-journal
Diabetes, Metabolic Syndrome and Obesity: Targets and Therapy downloaded from https://www.dovepress.com/ by 118.70.13.36 on 21-Aug-2020