1
Microbiological Quality of Raw Milk Attributable to Prolonged Refrigeration
1
Conditions
2
3
Nuwan R. Vithanage
1,5, Muditha Dissanayake
1,5, Greg Bolge
6, Enzo A. Palombo
3, Thomas
4
R. Yeager
2,4,5*Nivedita Datta
1,45
1 College of Health and Biomedicine, Victoria University, Werribee, Victoria 3030, Australia
6
2 College of Engineering and Science, Victoria University, Werribee, Victoria 3030, Australia
7
3 Faculty of Science, Engineering and Technology, Swinburne University of Technology, Hawthorn,
8
Victoria 3122, Australia
9
4 Institute for Sustainability and Innovation, Victoria University, Werribee 3030, Victoria, Australia
10
5 Advanced Food Systems Research Unit, Victoria University, Werribee, Victoria 3030, Australia.
11
6 Murray Goulburn Co-operative Co Ltd, Leongatha, Victoria 3953, Australia.
12
*Corresponding author Tel.:+61 3 9919 8103, Mob: +61 468899823; E-mail address:
13
14
15
16
Keywords:
Raw milk, Psychrotrophic proteolytic bacteria, Thermoduric psychrotrophs, Diversity,17
Protease activity, Proteolysis.
2
Abstract
20
Refrigerated storage of raw milk is a prerequisite in dairy industry. However, temperature abused
21
conditions in the farming and processing environments can significantly affect the microbiological
22
quality of raw milk. Thus, the present study investigated the effect of different refrigeration conditions
23
such as 2 ºC, 4 ºC, 6 ºC, 8 ºC, 10 ºC and 12 ºC on microbiological quality of raw milk from three
24
different dairy farms with significantly different initial microbial counts. The bacterial counts (BC),
25
protease activity (PA) and proteolysis (PL) and microbial diversity in raw milk were determined during
26
storage. The effect of combined heating (75 ± 0.5 ºC for 15 s) and refrigeration on controlling those
27
contaminating microorganisms was also investigated. Results of the present study indicated that, all
28
of the samples showed increasing BC, PA and PL as a function of temperature, time and initial BC
29
with a significant increase in those criteria ≥ 6 ºC. Similar trends in BC, PA and PL were observed
30
during the extended storage of raw milk at 4 ºC. Both PA and PL showed strong correlation with the
31
psychrotrophic proteolytic count (PPrBC: at ≥ 4 ºC) and thermoduric psychrotrophic count (TDPC: at ≥
32
8 ºC) compared to total plate count (TPC) and psychrotrophic bacterial count (PBC), that are often
33
used as the industry standard. Significant increases in PA and PL were observed when PPrBC and
34
TDPC reached 5 × 10⁴ cfu/mL and 1 × 10⁴ cfu/mL, and were defined as storage life for quality (SLQ),
35
and storage life for safety (SLS) aspects, respectively. The storage conditions also significantly affect
36
the microbial diversity, where Pseudomonas fluorescens and Bacillus cereus were found to be the
37
most predominant isolates. However, deep cooling (2 ºC) and combination of heating and refrigeration
38
(≤ 4 ºC) significantly extended the SLQ and SLs of raw milk.
39
40
41
42
43
44
45
46
47
3
Introduction
49
Since the introduction of storage and transportation of raw milk under refrigerated conditions in the
50
1950s, the spoilage of raw milk by mesophilic microbiota has been substantially reduced. According
51
to the guidelines of Food Standards Australia and New Zealand (FSANZ), raw milk is required to be
52
stored at 5 ºC within 3.5 h from the start of the milking process, whereas the European Union (EU)
53
standards state that raw milk is required to be stored at 6-8 ºC within 2 h from the end of milking
54
(FSANZ, 2012). While this practice hinders the growth of mesophiles, cold storage of raw milk
55
provides favourable conditions for the growth of psychrotrophic microorganisms (Quigley et al.,
56
2013). Thus, the level of psychrotrophs in raw milk after the milking process is dependent on both the
57
storage temperature and time (Vithanage et al., 2016; Griffiths et al., 1987). The initial psychrotrophic
58
bacterial load typically accounts for < 10 % of the total microbiota when milking is conducted under
59
hygienic conditions, however, these bacteria can become > 75 % of the total population when milking
60
is conducted using unhygienic protocols (Cousin, 1982). The dairy farm environment comprises a
61
variety of potential sources of psychrotrophs that can contaminate raw milk, mainly during the milking
62
process (Vissers & Driehuis, 2009).
63
Psychrotrophic bacteria isolated from raw milk predominantly include the Gram negative genera of
64
Pseudomonas, Acinetobacter, Hafnia, Rahnella, Alcaligenes, Achromobacter, Aeromonas, Serratia,
65
Enterobacter, Chryseobacterium, Chromobacterium, and Flavobacterium, and the Gram positive
66
genera of Bacillus, Clostridium, Corynebacterium, Streptococcus, Micrococcus, Staphylococcus,
67
Enterococcus, Lactobacillus, and Microbacterium. Of these, Pseudomonas and Bacillus are the most
68
frequently reported raw milk isolates (Vithanage et al., 2016). Psychrotrophic bacteria are able to
69
grow at minimum temperatures between -10 ºC and 7 ºC; optimum temperature is in the range of
25-70
35 ºC; and maximum temperature can be as high as 45 ºC. In addition, some thermoduric
71
psychrotrophs are able to withstand temperatures as high as 72-74 ºC (McKellar, 1989).
72
During cold storage, these bacteria can produce extracellular proteases (mainly) and lipases that are
73
resistant to pasteurisation and even ultra-high temperature (UHT) processing, contributing to the
74
spoilage in milk and dairy products (Oliveira et al., 2015). Proteolytic enzymes induce the hydrolysis
75
of casein, which may be evident as a greyish colour, bitter taste and gelation of spoiled milk
76
(Vyletělová & Hanuš, 2000a). UHT milk is more susceptible to proteolysis than pasteurized milk due
77
to longer storage times under ambient temperature condition (McKellar, 1981). Psychrotrophs with
4
higher protease expression can produce this level of protease activity within a few hours under79
suboptimal storage conditions (Renner, 1988).
80
The relationship between psychrotrophs and milk quality has been widely investigated (Oliveira et al.,
81
2015; Marchand et al., 2009a). To date, limited evidence has been found associating the effect of
82
storage conditions with the growth of psychrotrophic bacteria, their proteolytic potential and
83
deterioration of milk proteins due to proteolysis (Haryani et al., 2003; O'Connell et al., 2016; Griffiths
84
et al., 1987). Changes in storage conditions are also associated with the microbial composition in the
85
corresponding samples (Hantsis-Zacharov & Halpern, 2007; Lafarge et al., 2004; von Neubeck et al.,
86
2015). However, the experimental data demonstrating the relationship between microbial counts and
87
proteolysis in raw milk is not well established, due to the distinct variation in the proteolytic potential
88
and heat-resistance of those proteolytic enzymes produced by raw milk microbiota (Dogan & Boor,
89
2003; Marchand et al., 2009b). Hence, the current study investigated the effects of microbiological
90
quality and associated proteolysis on storage life of raw milk under different refrigeration conditions
91
for a prolonged period with a focus on psychrotrophic proteolytic counts (PPrBC). The effect of
high-92
temperature short-time pasteurisation (HTST) of raw milk prior to the UHT processing on
93
microbiological and proteolytic parameters was also evaluated.
94
95
Materials and Methods
96
Raw milk samples
97
Raw milk samples from three commercial farms (designated as A, B and C) were provided by a
98
commercial UHT milk processor in Victoria, Australia. These samples were selected from seven
99
potential samples to represent high quality (A: 2.3 × 10⁴ cells/mL) medium quality (B: 5.3 × 10⁵
100
cells/mL) and poor quality (C: 6.7 × 10⁶ cells/mL) raw milk based on Bactoscan counts as well as
101
statistics of the respective commercial processor (Vithanage et al., 2014). Three representative
102
samples were collected directly from the bulk milk tank at each of the farms under aseptic conditions
103
and delivered to the laboratory on ice (at 4-5 ºC) within 2-3 h of the milking procedure. A volume (500
104
mL) of the samples were transferred into a sterile Erlenmeyer flask (1 L) under aseptic conditions and
105
stored under various experimental conditions (as described below). Samples were analysed daily,
106
commencing from day 0, representing three biological (three separate samples of milk from each bulk
107
tank) and three technical (three sub samples from each 500 mL) replicates (n=9).
5
Storage Conditions
109
Raw milk samples were incubated under various temperature conditions in a refrigerated shaking
110
incubator (Innova 4230, New Brunswick Scientific, Edison, NJ, USA) and subjected to constant
111
agitation at 120 rpm for 10 days. Those conditions included 2 °C (deep cooling), 4 °C (standard
112
refrigeration) and 6 °C, 8 °C, 10 °C or 12 °C (elevated temperatures in the farm bulk tank and
113
commercial silo).
114
115
Enumeration of bacteria in raw milk
116
The total plate count (TPC) was determined according to the method described in the International
117
Dairy Federation (IDF) standard: 101A: 1991 with slight modification. Raw milk samples were serially
118
diluted (10-fold) and cultured on plate count agar (Sigma-Aldrich, Castle Hill, Australia) supplemented
119
with 1.0% (w/v) skim milk (PCM agar) using the drop plate method (Munsch-Alatossava, Rita, &
120
Alatossava, 2007) and incubated for 10 days, at 7 °C (for psychrotrophic bacterial counts: PBC) and
121
48 h at 30 °C (for total plate count: TPC) in duplicate. Clearing zones around colonies of
122
psychrotrophic bacteria were indicative of proteolysis and these colonies were used to calculate
123
PPrBC counts (Cempírkova, 2007).
124
The thermoduric psychrotrophic count (TDPC) was determined by heating the raw milk at 63 ± 0.5 °C
125
for 30 min, in a shaking oil bath (Ratek, Boronia, Victoria, Australia), excluding the come up time (i.e.,
126
time required to reach the corresponding temperature). Samples were cultured on PCM and
127
incubated at 7 ºC for 10 days (Buehner, Anand, & Garcia, 2014).
128
129
Identification of predominant raw milk microbiota
130
Identification of predominant isolates was conducted using matrix-assisted laser desorption time of
131
flight mass spectrometry (MALDI-TOF MS) as well as 16S rRNA sequencing according to the method
132
described by Vithanage et al., (2014) in duplicate.
133
134
Sample preparation for protease activity and peptide analysis
135
Raw milk samples were prepared by centrifugation of raw milk at 16 000 g for 5 mins (Eppendorf
136
5415C microfuge, Hamburg, Germany) to remove the milk fat. A volume of (1 mL) raw milk was mixed
137
with 12% trichloroacetic acid (TCA) and incubated at 37 ºC for 30 min. The mixture was filtered
6
through 0.45 μm syringe filter (Minisart® Regenerated Cellulose; Sartorius, Victoria, Australia) and the139
filtrate was used for protease assays. The same procedure was used for obtaining the TCA-soluble
140
peptides for in the peptide analysis.
141
142
Determination of protease activity
143
Protease activity in the raw milk samples stored under different storage conditions was determined
144
using the Protease Fluorescent Detection Kit (Sigma-Aldrich, Castle Hill, Australia) according to the
145
manufacturer’s instructions. The fluorescence intensity due to release of trichloroacetic acid
(TCA)-146
soluble fluorescent peptides was determined using a spectrofluorophotometer (POLARstar Omega;
147
BMG LABTECH, Mornington, Victoria, Australia) with excitation at a wavelength of 485 nm and the
148
emission at a wavelength of 535 nm in duplicate. The increase in fluorescence intensity obtained due
149
to hydrolysis of the protein was expressed as relative fluorescence units (RFU/mL). Thermolysin
150
(Sigma-Aldrich, Castle Hill, Australia) was used as the positive control, and it was also used to
151
generate a standard curve (0-25 ng) when determining the detection limit (ng/mL) (Cupp-Enyard,
152
2009).
153
154
Determination of proteolysis by reversed-phase high performance liquid chromatography (RP-HPLC)
155
Separation of TCA-soluble peptides was performed on a reversed-phase HPLC (Varian Analytical
156
Instruments, Walnut Creek, CA, USA) equipped with C-18 monomeric column (5 µm, 300A, 250 mm x
157
4.6 mm; Grace Vydac, Hesperia CA, USA) at 35°C and a UV/Vis detector at 214 nm according to the
158
method described by Datta & Deeth (2003), with some modifications. A volume (50 µL) of
TCA-159
soluble peptides was injected and the peptides were eluted by a linear gradient from 100% to 0% of
160
solvent A (0.1% trifluoroacetic acid (TFA) in Milli-Q water) in solvent B (0.1% TFA in 90%, v/v
HPLC-161
grade acetonitrile in Milli-Q water) over 40 min at a flow rate of 0.75 mL/min in duplicate.
162
163
Determination of proteolysis by degree of hydrolysis by O-phathaldialdehyde (OPA) method
164
The extent of proteolysis was also determined using the modified OPA method (Zarei et al., 2012) in
165
duplicate. A volume (5 µL) of TCA-soluble peptides was mixed with 245 µL of OPA reagent (Thermo
166
Fisher Scientific, Victoria, Australia) in microtiter plates and the absorbance was determined using a
167
spectrofuorophotometer (POLARstar Omega; BMG LABTECH, Mornington, Victoria, Australia) with a
7
wavelength of 340 nm in duplicate. The degree of hydrolysis (DH %) was calculated based on the169
following formula (i.e., equation 1) (Slattery & Fitzgerald, 1998).
170
𝐷𝐷𝐷𝐷 % =�100𝑁𝑁 �(∆𝐴𝐴×𝑀𝑀×𝑑𝑑/𝜀𝜀×𝑐𝑐)(1)
171
where ∆ A is the difference between the absorbance of test sample and un-hydrolysed sample at 340
172
nm, M is the molecular mass of the test protein (Da), d is the dilution factor, 𝜀𝜀 is the molar extinction
173
coefficient at 340 nm (6000 L/mol/cm), c is the protein concentration (g/L) and N is the total number of
174
peptide bonds per protein molecule.
175
176
Determination of the effect of combined pasteurisation and low temperature storage
177
Raw milk samples from all three farms were heated at 75 ± 0.5 ºC for 15 s in a shaking oil bath
178
(Ratek, Boronia, Victoria, Australia), excluding the come up time (Griffiths et al., 1987). Following heat
179
treatment, the samples were aseptically transferred into 1 L sterile Erlenmeyer flasks and stored
180
under different temperature at 2 ºC, 4 ºC, 6 ºC, 8 ºC, 10 ºC and 12 ºC for 10 days. The enumeration of
181
bacteria and analysis of protease activity and proteolysis was conducted as described before (n = 9).
182
183
Data processing and statistical analysis
184
The analysis was conducted in triplicate. Correlation coefficients and significance levels (MANOVA) of
185
the tested sets (TPC; PBC; PPrBC; TDPC) were calculated using the SPSS software for Windows
186
(Version 21 software; IBM Corp. in Armonk, NY). P < 0.05 was considered statistically significant.
187
188
Results
189
The initial microbiological counts of raw milk of different farms
190
The total plate count in A, B and C raw milk samples were 2.84 (±1.21), 3.79 (±1.54) and 5.86 (±2.32)
191
log cfu/mL, respectively. Similarly, the initial PBC in the corresponding samples were in the following
192
order; A: 2.66 (±1.11); B: 2.87 (±1.01); C: 4.85 (±1.21) log cfu/mL. Interestingly, the PPrBC counts
193
showed a different ascending order, of B: 1.38 (± 1.05) logcfu/mL; A: 2.37 (± 1.04) log cfu/mL; C: 3.79
194
(±1.10) log cfu/mL. The TDPC in the A, B and C samples were 1.03 (± 0.14) log cfu/mL,2.70 (±0.20)
195
log cfu/mL and 3.61(±0.11) log cfu/mL, respectively.
196
197
Effects of different storage conditions on the microbial growth in raw milk
8
Bacterial growth curves comprising TPC, PBC, PPrBC and TDPC showed the characteristic sigmoidal199
growth pattern with different growth rates when stored under different refrigerated conditions (Fig. S1;
200
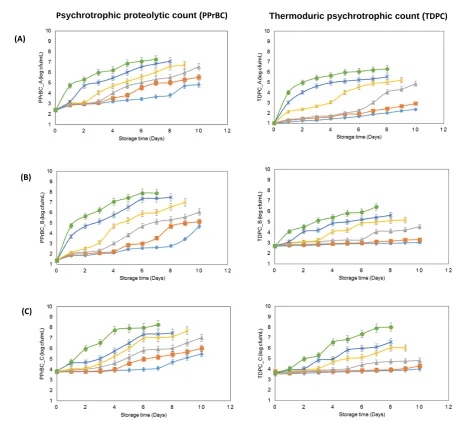
Fig. 1). The growth curves of PPrBC, TDPC of sample A, B and C showed a double-sigmoidal shape
201
(Fig. 1).However, Storage of raw milk at 2 ºC storage showed significant inhibition of the PPrBC and
202
TDPC. Storage temperatures of ≥ 4 ºC resulted in significant increases in PPrBC, whereas TDPC
203
showed significant increases in growth rate at ≥ 8 ºC (P < 0.05) (Fig.1).
204
205
Diversity of raw milk microbiota under refrigerated conditions
206
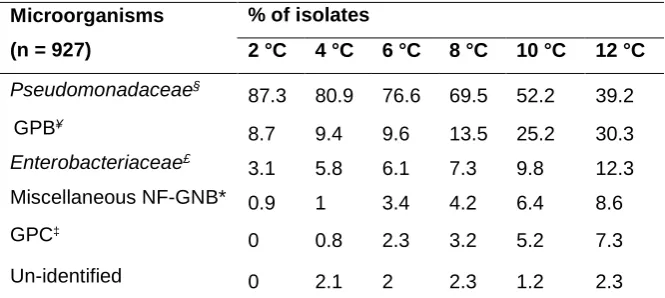
The predominant microorganisms isolated were Pseudomonas, Bacillus, and Microbacterium and, to
207
a lesser extent, members of the family Enterobacteriaceae (Table 1). The most predominant genera
208
found in refrigerated raw milk were Pseudomonas (mainly Pseudomonas fluorescens) and Bacillus
209
(Bacillus cereus, Bacillus weihenstephensis and Bacillus circulans). This diversity varied depending
210
on the sample and temperature tested. For example, the level of enteric, non-fermenter Gram
211
negative bacilli (NF-GNB), Gram positive cocci and Gram positive bacillus were higher at
212
temperatures ≥ 8 ºC (Table 1).
213
214
Effects of different storage conditions on the protease activity and proteolysis in raw milk
215
The initial protease activities (PA) of A, B and C raw milk samples were 404.5 (±4.76), 257 (±2.82)
216
and 604.3 (±5.13) RFU/mL. Consequently, the initial proteolysis (PL) that has been denoted by
217
degree of hydrolysis (%DH) of each samples was in the following ascending order; B: 0.88 (±0.51) %,
218
A: 1.32 (±1.02) % and C: 2.42 (±1.13) %. A significant increase in PA and PL (denoted by %DH) was
219
apparent at storage conditions ≥ 6 ºC (P < 0.05) (Fig. 2). Even the standard refrigeration condition (4
220
ºC) showed significant increase in PA and PL during the extended storage of raw milk (10 days) and
221
this was observed after 6, 8 and 5 days in A, B and C samples, respectively (P < 0.05) (Fig. 2; Fig.
222
3). In contrast, 2 ºC storage resulted in significant reduction in the PA and DH in all three raw milk
223
sample(P < 0.0001) (Fig. 2).
224
225
Correlation of protease activity and proteolysis with bacterial counts in raw milk
226
An increase in protease activity and proteolysis were observed when the PPrBC counts reached 5.0 ×
227
104 cfu/mLat all temperature conditions, except for 2 ºC (Table 2; Fig. 2). However, the corresponding
9
protease activity and proteolysis varied as function of temperature (Table 2; Fig. 2). For example, the229
presence of PPrBC in the range of 5.1 to 5.4 × 10⁴ cfu/mLin A, B and C samples at 4 ºC resulted in
230
protease activity of 2.8 × 10³ RFU/mL, 1.0 × 10² RFU/mL and 4.0 × 10⁴ RFU/mL andthose values
231
were equivalent to 9.3 ng/mL, 3.5 ng/mL and 11.9 ng/mL as calculated using thermolysin as the
232
positive control by the FITC method, respectively (Table 2; Fig. 2). The proteolysis of the samples,
233
denoted by DH %, were 12.1%, 8.4% and 15.1%. In contrast, at 6 ºC with similar PPrBC (ranging
234
from 5.2-5.4 × 10⁴ cfu/mL), the protease activities in the samples were 3.9 × 10⁴ RFU mL-1, 2.9 × 10³
235
RFU/mLand 5.3 × 10⁴ RFU/mL (equivalent to 12.1 ng/mL, 5.4 ng/mL and 13.4 ng/mL) with DH % of
236
18.2%, 10.4% and 21.3%, representing farms A, B and C, respectively (Table 2; Fig. 2).
237
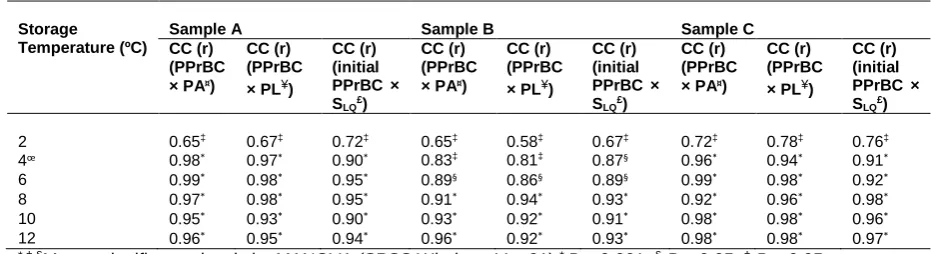
Interestingly, the correlation coefficients (r) between PPrBC and PA/PL were highly significant (r ≥
238
0.90, P < 0.0001; at ≥ 4 ºC), when PPrBC reached 5.0 × 10⁴ cfu/mL (Table S1). This correlation was
239
in the range of 0.81-0.95 (P < 0.001), when TDPC reached 5.0 × 10⁴ cfu/mL at ≥ 8 ºC (Table S2). The
240
correlation coefficients between PBC and PA and/or PL was significant (r ≥ 0.82-0.95, P < 0.05),
241
however, the TPC showed poor correlation with PA/PL (r = 0.55-0.62, P > 0.05) (data not shown).
242
243
Storage life of raw milk attributable to different temperature conditions
244
Besides the significant correlation in increase in PA and PL with PPrBC, both parameters appear to
245
vary depending on the temperature condition. Therefore, the storage life in the aspect of raw milk
246
quality (SLQ) was defined depending on the PPrBC counts, hence time to reach PPrBC of 5.0 × 10⁴
247
cfu/mLwas defined as SLQ (Table S3). However, the storage life in the aspect of raw milk safety (SLs)
248
was dependent on the counts of pathogenic thermoduric psychrotrophs such as B. cereus and the
249
time to reach TDPC of 1.0 × 10⁴ cfu/mLwas defined as SLs (Table S3). Both SLQ and SLS showed
250
significant correlation with initial counts ≥ 4 ºC and ≥ 8 ºC storage, respectively (Table S1; S2).
251
252
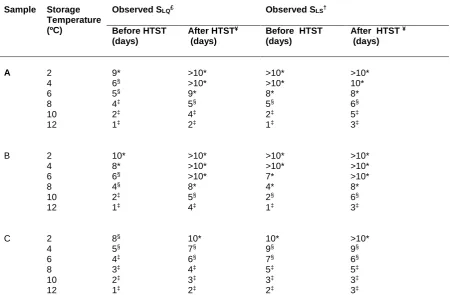
Extension of storage life of raw milk by a combination of pasteurisation and low-temperature storage
253
Heating of raw milk samples at 75 °C for 15 s followed by storage at different refrigeration conditions
254
resulted in a significant reduction of PPrBC (P < 0.05) (Table S3). This consequently decreased the
255
PA and PL with concomitant increased in the SLQ (P < 0.05), especially the temperature conditions ≤ 8
256
ºC storage (Table S3). In contrast, the SLS showed only slight increase (P > 0.05). The most
10
significant increase in storage life (both SLQ and SLS) was observed when raw milk was stored at 2 ºC,258
while storage life was significantly reduced when it was stored at ≥ 8 ºC (Table S3).
259
260
Discussion
261
Raw milk collected from three farms showed significantly different initial TPC, PBC, PPrBC and
262
TDPC, possibly related to the different the farm management systems and hygienic protocols used
263
during the milking process of these farms (Cempírkova, 2007; Srairi et al., 2009). Interestingly, the
264
PPrBC was higher in sample A compared to sample B. This may result in significantly greater
265
protease activity and proteolysis in the corresponding sample, regardless its lower TPC, compared to
266
sample B. Furthermore, proteolysis and protease activity showed a more significant correlation with
267
PPrBC (≥ 4 ºC) and TDPC (≥ 8 ºC) than that with TPC and PBC in raw milk. This indicates that PPrBC
268
and TDPC are the most important quality criteria that can be incorporated into the guidelines for the
269
production of high quality milk and dairy products. Moreover, the maximum production of proteolytic
270
enzymes and subsequent proteolysis was observed when PPrBC counts were above ≥ 5 × 10⁴ cfu/mL
271
at ≥ 4 ºC, and TDPC ≥ 1 × 10⁴cfu/mL at ≥ 8 ºC and those limits were used for predicting storage life
272
of raw milk with respect to both quality and safety. Thus, according to the results of the present study,
273
it can be speculated that production of UHT milk requires PPrBC counts below 5 × 10⁴ cfu/mL and
274
TDPC of 1 × 10⁴ cfu/mL for shelf life extension and product safety. This is consistent with a PPrBC
275
count of 4.5 × 10⁴ cfu/mL representing the threshold with respect to milk quality (Silveira et al., 1999;
276
Vyletelova et al., 2000b). Similarly, the TDPC comprising significantly higher numbers of B. cereus
277
can be a food safety concern when it reaches 1.0 × 10⁴ cfu/mL (Valik et al., 2003). In contrast, several
278
other studies determined the relationship between proteolysis with slightly higher bacterial counts in
279
the range of 106-107 cfu/mL (O'Connell et al., 2016; Haryani et al., 2003; Griffiths et al., 1987).
280
However, Gillis et al. (1985) also demonstrated significant decrease in proteolysis and bitter peptide
281
production with raw milk microbiota less than 104 cfu/mL.
282
Even an initial PPrBC and TDPC as low as 101-102 cfu/mL can give rise to ≥ 5 × 10⁴ cfu/mL with
283
elevated PA and PL within 4-7 days at 6 ºC storage. The TDPC with similar initial counts can
284
increased to ≥ 1 × 10⁴ cfu/mL within 5-9 days at 8 ºC. At 4 ºC, the PPrBC counts reached the
285
corresponding levels within 5-8 days storage and less than 2 days of storage at ≥ 8 ºC. Thus, 2 ºC is
286
highly recommended as a storage temperature, while temperatures below 6 ºC can be recommended
11
for the purpose of pre-processing storage of raw milk, depending on the initial bacterial counts and288
the duration of storage.
289
Interestingly, some of the growth curves of bacteria exhibited a double-sigmoidal shape at ≥ 8 ˚C. It
290
can be speculated that an increasing growth rate and production of antimicrobial metabolites under
291
elevated temperature conditions may result in antagonistic effects within the mixed microbial
292
population (Ma et al., 2014; Vine et al., 2004). The fluctuation in the microbial counts also
293
accompanied by slight fluctuation in the protease activity and proteolysis. This is possibly related to
294
the balance between production and utilisation of small peptides by indigenous microbiota or due to
295
the presence of artefacts especially in FITC method (Haryani et al., 2003).
296
The extended storage of raw milk under various refrigeration conditions resulted in significant diversity
297
in the raw milk microbiota. For example, storage temperatures below 4 ºC resulted in an increase in
298
the level of Pseudomonas spp. and some Bacillus spp. with simultaneous reduction in the enteric and
299
miscellaneous NF-GNB isolates. However, the counts of isolates that belong to family Bacillaceae
300
and Enterobacteriaceae were significantly increased above 8 ºC storage. Among the thermoduric
301
psychrotrophic isolates, species belong to B. cereus group was predominantly isolated especially ≥ 8
302
ºC. B. cereus is known to produce emetic type toxin under refrigeration conditions that can cause
303
public health concerns when the isolates reach 1 × 10³ cfu/mL (Christiansson et al., 1989). Most
304
importantly, the spores produced by these isolates are able to withstand pasteurisation and UHT
305
processing (Champagne et al., 1994). According to FSANZ guidelines, the counts of P. fluorescens
306
and B. cereus in premium quality raw milk are required to be maintained below 107 cfu/mL and 105
307
cfu/mL, respectively (FSANZ, 2014). These two genera are considered as the major cause of concern
308
in commercial milk processing. Additionally, the diversity of raw milk microbiota can be affected by
309
seasonal differences, for example, psychrotolerant PPrBC, PBC and TDPC appear to increase during
310
the winter months, while thermoduric counts representing mesophilic bacteria were at their highest
311
during the summer months (Marchand et al., 2009a; Vithanage et al., 2016).
312
In the present study, sample B showed significantly lower protease activity and proteolysis. This can
313
be related to the diversity of psychrotolerant bacteria in the respective sample. Previously, we
314
observed that sample B comprised psychrotrophic isolates with limited proteolytic potential (Vithanage
315
et al., 2016). Dogan and Boor (2003) also observed variation in the proteolytic potential even within
316
the P. fluorescens population isolated from milk. Pseudomonas produce a heat-stable serralysin
12
family extracellular protease, referred to as AprX (EC 3.4.24.40), while Bacillus spp. produce serine318
family proteases known as thermolysin (EC 3.4.24.27), substilisin (EC 3.4.21.62) (Bach et al., 2001;
319
Machado et al., 2013; Marchand et al., 2009b; Dufour et al., 2008). Expression of the genes encoding
320
these proteases was shown to be regulated by incubation temperature (Morita et al., 1997; Burger et
321
al., 2000). Alternatively, differences in proteolysis can be related to the characteristics of proteolytic
322
enzymes such as their cold-active nature, specificity and temperature-dependence (McKellar, 1989).
323
The growth of spoilage bacteria in raw milk can be controlled by thermisation (at 65 °C for 15 s),
324
followed by storing of the heated milk under refrigeration conditions (Griffiths et al., 1987;
325
Stadhouders, 1982). In contrast to these earlier studies, the current study used heating of raw milk at
326
75 °C for 15 s, which is typically used in HTST pasteurisation. This practice is often used upon
327
receiving raw milk at dairy processing plants prior to UHT treatment. This resulted in significant
328
reduction (1-log) in PPrBC counts, but not TDPC, however resulted in significant decrease in protease
329
activity. This in turn showed significantly higher SLQ, but no significant difference in SLS. Thus, the
330
knowledge of number and diversity of psychrotrophic proteolytic bacteria in raw milk can be used for
331
appropriate production of milk and dairy products (Vithanage et al., 2016; Anzueto, 2014). Similarly,
332
reliable control of raw milk isolates with higher proteolytic potential would be important for the
333
extension of raw material storage with concomitant increase in flexibility of the manufacturing process
334
(Griffiths et al., 1987).
335
Although the current study used raw milk representing various quality levels, a large-scale analysis
336
would provide a more comprehensive understanding of the effect of storage conditions on raw milk
337
quality. However, these results are in general agreement with the results of large scale studies
338
(O'Connell et al., 2016).
339
In conclusion, storage temperature, time and initial counts can affect microbiological quality of raw
340
milk, in which PPrBC and TDPC are good indicators than other microbiological criteria for predicting
341
the quality and safety of raw milk. It is important to determine a particular predictive model to estimate
342
the PPrBC and TDPC in samples for improving the quality and reducing large-scale wastage of raw
343
milk. Thus, PPrBC and TDPC data can be used to evaluate specific on-farm technological
344
requirements when deciding on quality-dependent incentive schemes for raw milk suppliers.
345
Additionally, deep cooling of raw milk at 2 ºC may be a reliable alternative for dairy farms when raw
346
milk collection does not occur on a regular basis. Alternatively, extension in the storage-life of raw
13
milk can be achieved by thermisation at 75 ºC for 15 s (instead of 65 ºC) followed by 2 ºC storage.348
However, profiling of individual species with higher spoilage potential using rapid and reliable
349
screening would be more informative and will be the focus of future studies. This would allow for the
350
production of superior quality dairy products with extended shelf life that can be distributed to wider
351
geographical regions, benefitting commercial milk processing.
352
Acknowledgments
353
The authors wish to acknowledge financial assistance from Victoria University and Murray Goulburn
354
Co-operative Co. Limited. We are also grateful to the staff of the Murray Goulburn Co-operative Co.
355
Limited for their help organizing the sampling campaign and to the sampled dairy farms for their
356
hospitality. Professor Todor Vasiljevic, Dr. Jayani Chandrapala are gratefully acknowledged for their
357
constructive suggestions during the reviewing process. The assistance of Mr. Anuja Manchanayake
358
and Mr. Jamith Jayasekara for manuscript preparation is gratefully acknowledged.
359
360
References
361
362
363
Anzueto, M. E. (2014). Tracking Heat-Resistant, Sporeforming Bacteria in The Milk Chain: A Farm to Table
364
Approach. Master thesis. University of Nebraska, Lincoln, Nebraska. Retrieved insert the date from
365
http://digitalcommons.unl.edu/foodscidiss/45.
366
367
Bach HJ, Hartmann A, Schloter M & Munch JC 2001 PCR primers and functional probes for amplification and
368
detection of bacterial genes for extracellular peptidases in single strains and in soil. Journal of Microbiol
369
Methods 44(2) 173-182.
370
371
Buehner KP, Anand S & Garcia A 2014 Prevalence of thermoduric bacteria and spores on 10 Midwest dairy
372
farms. Journal of Dairy Science 97(11) 6777-6784.
373
374
Burger M, Woods RG, McCarthy C & Beacham IR 2000 Temperature regulation of protease in Pseudomonas
375
fluorescens LS107d2 by an ECF sigma factor and a transmembrane activator. Microbiology 146(12)
376
3149-3155.
377
378
Cempírkova R 2007 Contamination of cow’s raw milk by psychrotrophic and mesophilic microflora in relation to
379
selected factors. Czech Journal of Animal Science 52(11) 387–393.
380
381
Christiansson A, Naidu AS, Nilsson I, Wadström T & Pettersson H 1989 Toxin production by Bacillus cereus
382
dairy isolates in milk at low temperatures. Applied Environmental Microbiology 55(10) 2595-2600.
383
384
Cousin MA 1982 Presence and Activity of Psychrotrophic Microorganisms in Milk and Dairy Products: A Review.
385
Journal of Food Protection 45(2) 172-207.
386
387
Cupp-Enyard C 2009 Use of the Protease Fluorescent Detection Kit to Determine Protease Activity. Journal of
388
Visualized Experiments 30(1) 1514-1521.
389
390
Datta N & Deeth HC 2003 Diagnosing the cause of proteolysis in UHT milk. LWT - Food Science and
391
Technology 36(2) 173-182.
392
393
Dogan B & Boor KJ 2003 Genetic diversity and spoilage potentials among Pseudomonas spp. isolated from
394
fluid milk products and dairy processing plants. Appl Environ Microbiol 69(1) 130-138.
395
396
Dufour D, Nicodème M, Perrin C, Driou A, Brusseaux E, Humbert G, Gaillard J-L & Dary A 2008 Molecular
397
typing of industrial strains of Pseudomonas spp. isolated from milk and genetical and biochemical
14
characterization of an extracellular protease produced by one of them. International Journal of Food
399
Microbiology 125(2) 188-196.
400
401
402
FSANZ (2014). Understanding and complying with European Union requirements for raw milk temperatures.
403
pp.1-4. In. Australia: Department of Agiculture and water resources;
404
http://www.foodstandards.gov.au/code/primaryproduction/dairy), Accessed on 16 August 2014.
405
406
407
408
FSANZ. (2012). Raw milk temperatures-Understanding the and complying with EU requirements. In Australia:
409
Department of Agriculture and water resources,
410
http://www.agriculture.gov.au/SiteCollectionDocuments/aqis/exporting/dairy/goods-for-eu/raw-milk-411
temps.pdf, Accessed on 18 August 2014.
412
413
414
Gillis WT, Cartledge MF, Rodriguez IR & Suarez EJ 1985 Effect of Raw Milk Quality on Ultra-High
415
Temperature Processed Milk. Journal of Dairy Science 68(11) 2875-2879.
416
417
Griffiths MW, Phillips JD & Muir DD 1987 Effect of low-temperature storage on the bacteriological quality of
418
raw milk. Food Microbiology 4(4) 285-291.
419
420
Hantsis-Zacharov E & Halpern M 2007 Culturable psychrotrophic bacterial communities in raw milk and their
421
proteolytic and lipolytic traits. Applied Environmental Microbiology 73(22) 7162-7168.
422
423
Haryani S, Datta N, Elliott AJ & Deeth HC 2003 Production of proteinases by psychrotrophic bacteria in raw
424
milk stored at low temperature. Australian Journal of Dairy Technology 58(1) 15-20.
425
426
Lafarge V, Ogier J-C, Girard V, Maladen V, Leveau J-Y, Gruss A & Delacroix-Buchet A 2004 Raw Cow Milk
427
Bacterial Population Shifts Attributable to Refrigeration. Applied Environmental Microbiology 70(9)
5644-428
5650.
429
430
Ma S, Li H, Yan C, Wang D, Li H, Xia X, Dong X, Zhao Y, Sun T, Hu P & Guan W 2014 Antagonistic effect of
431
protein extracts from Streptococcus sanguinis on pathogenic bacteria and fungi of the oral cavity.
432
Experimental and Therapeutic Medicine 7(6) 1486-1494.
433
434
435
Machado SG, Bazzolli DMS & Vanetti MCD 2013 Development of a PCR method for detecting proteolytic
436
psychrotrophic bacteria in raw milk. International Dairy Journal 29(1) 8-14.
437
438
Marchand S, Heylen K, Messens W, Coudijzer K, De Vos P, Dewettinck K, Herman L, De Block J &
439
Heyndrickx M 2009a Seasonal influence on heat-resistant proteolytic capacity of Pseudomonas
440
lundensis and Pseudomonas fragi, predominant milk spoilers isolated from Belgian raw milk samples.
441
Environmental Microbiology 11(2) 467-482.
442
443
Marchand S, Vandriesche G, Coorevits A, Coudijzer K, De Jonghe V, Dewettinck K, De Vos P, Devreese B,
444
Heyndrickx M & De Block J 2009b Heterogeneity of heat-resistant proteases from milk Pseudomonas
445
species. International Journal of Food Microbiology 133(1–2) 68-77.
446
447
McKellar RC 1981 Development of Off-Flavors in Ultra-High Temperature and Pasteurized Milk as a Function of
448
Proteolysis1. Journal of Dairy Science 64(11) 2138-2145.
449
450
McKellar RC 1989 Enzymes of Psychrotrophs in Raw Food.Enzymes of Psychrotrophs in Raw Food (2nd edn.,
451
Section A, Chapt.1-10, pp. 3-245). Florida, USA: Taylor & Francis.
452
453
Morita Y, Nakamura T, Hasan Q, Murakami Y, Yokoyama K & Tamiya E 1997 Cold-active enzymes from
cold-454
adapted bacteria. Journal of the American Oil Chemists' Society 74(4) 441-444.
455
456
Munsch-Alatossava P, Rita H & Alatossava T 2007 A faster and more economical alternative to the standard
457
plate count (SPC) method for microbiological analyses of raw milks. Communicating Current Research
458
and Educational Topics and Trends in Applied Microbiology [A. Méndez-Vilas (Ed.) pp 495-499],
459
Formatex, Badajoz (2007).
460
461
O'Connell A, Ruegg PL, Jordan K, O'Brien B & Gleeson D 2016 The effect of storage temperature and
462
duration on the microbial quality of bulk tank milk. Journal of Dairy Science 99(5) 3367-3374.
15
Oliveira GBD, Favarin L, Luchese RH & McIntosh D 2015 Psychrotrophic bacteria in milk: How much do we465
really know? Brazilian Journal of Microbiology 46 (2) 313-321.
466
467
Quigley L, O'Sullivan O, Stanton C, Beresford TP, Ross RP, Fitzgerald GF & Cotter PD 2013 The complex
468
microbiota of raw milk. FEMS Microbiology Reviews 37(5) 664-698.
469
470
Renner E 1988 Storage stability and some nutritional aspects of milk powders and ultra high temperature
471
products at high ambient temperatures. Journal of Dairy Research 55(01) 125-142.
472
473
Silveira IA, Carvalho EP, Teixeira D & Barrios BE 1999 Verification of the proteolytic and lipolytic activities of
474
the microbial flora isolated from raw, refrigerated, type B milk. II. Psychrotrophic microorganisms. Rev
475
Latinoam Microbiology 41(2) 85-89.
476
477
Slattery H & Fitzgerald RJ 1998 Functional Properties and Bitterness of Sodium Caseinate Hydrolysates
478
Prepared with a Bacillus Proteinase. Journal of Food Science 63(3) 418-422.
479
480
Srairi MT, Benhouda H, Kuper M & Le Gal PY 2009 Effect of cattle management practices on raw milk quality
481
on farms operating in a two-stage dairy chain. Tropical Animal Health Production 41(2) 259-272.
482
483
Stadhouders J 1982 Cooling and thermization as a means to extend the keeping quality of raw milk. Kieler
484
milchwirtschaftliche Forschungsberichte 34(1) 19-28.
485
486
Valik L, Gorner F & Laukova D 2003 Growth dynamics of Bacillus cereus and shelf-life of pasteurised milk.
487
Czech Journal of Food Sciences 21(6) 195-202.
488
489
Vine NG, Leukes WD & Kaiser H 2004 In vitro growth characteristics of five candidate aquaculture probiotics
490
and two fish pathogens grown in fish intestinal mucus. FEMS Microbiology Letters 231(1) 145-152.
491
492
493
Vissers, MMM & Driehuis, F (2009). On-Farm Hygienic Milk Production. In A.Y. Tamime (Ed.), Milk Processing
494
and Quality Management (Chapt.1, pp. 1-22), West Sussex, UK: Wiley-Blackwell.
495
496
Vithanage NR, Dissanayake M, Bolge G, Palombo EA, Yeager TR & Datta N 2016 Biodiversity of culturable
497
psychrotrophic microbiota in raw milk attributable to refrigeration conditions, seasonality and their
498
spoilage potential. International Dairy Journal, 57(0) 80-90.
499
500
Vithanage NR, Yeager TR, Jadhav SR, Palombo EA & Datta N 2014 Comparison of identification systems for
501
psychrotrophic bacteria isolated from raw bovine milk. International Journal of Food Microbiology 189(0)
502
26-38.
503
504
von Neubeck M, Baur C, Krewinkel M, Stoeckel M, Kranz B, Stressler T, Fischer L, Hinrichs J, Scherer S &
505
Wenning M 2015 Biodiversity of refrigerated raw milk microbiota and their enzymatic spoilage potential.
506
International Journal of Food Microbiology 211(0) 57-65.
507
508
Vyletělová M & Hanuš O 2000a Effects of contamination by Pseudomonas fluorescens on principal components
509
and technological parameters of pasteurized milk during storage. Czech Journal of Food Sciences 18(6)
510
224-234.
511
512
Vyletelova M, Hanus O, Urbanova E & Kopunecz P 2000b The occurrence and identification of psychrotrophic
513
bacteria with proteolytic and lipolytic activity in bulk milk samples at storage in primary production
514
conditions. Czech Journal of Animal Science. 45(8) 373-383.
515
516
Zarei M, Ebrahimpour A, Abdul-Hamid A, Anwar F & Saari N 2012 Production of Defatted Palm Kernel Cake
517
Protein Hydrolysate as a Valuable Source of Natural Antioxidants. International Journal of Molecular
518
Sciences 13(7) 8097-8111.
16
Caption of Tables
520
521
Table 1
522
Percentages of predominant bacteria belong to each taxon isolated from three samples throughout
523
the simulations of the cold dairy chain using different storage conditions.
524
525
Table 2
526
Relationship between psychrotrophic proteolytic count (PPrBC) and thermoduric psychrotrophic count
527
(TDPC) with protease activity and degree of hydrolysis (proteolysis) in raw milk, when PPrBC reach
528
5×10⁴ cfu/mL and TDPC reach 1×10⁴ cfu/mL under different storage conditions.
529
530
531
Caption of Figures
532
533
Fig. 1
534
535
Effect of different storage conditions on the proteolytic psychrotrophic counts (PPrBC) and
536
thermoduric psychrotrophic counts (TDPC) of A, B and C raw milk samples; at 2 ºC, 4 ºC,
537
6 ºC, 8 ºC, 10 ºC and 12 ºC storage. The results were presented as mean ±
538
SE, (n = 9).
539
540
Fig. 2
541
542
Effect of different storage conditions on the protease activity (PA) and proteolysis (PL: %DH: degree
543
of hydrolysis) of A, B and C raw milk samples; at 2 ºC, 4 ºC, 6 ºC, 8 ºC, 10
544
ºC and 12 ºC storage. The results were presented as mean ± SE, (n = 9).
545
546
547
Fig. 3
548
The reversed-phase high-performance liquid chromatography (RP-HPLC) chromatograms of
549
trichloroacetic acid (TCA) soluble peptide fractions of A, B and C raw milk samples stored at 4 ºC, in 0
550
day and after 6, 8 and 5 days (when significant increase in proteolysis occurred), respectively.
17
564
565
Table 1
566
567
Microorganisms (n = 927)
% of isolates
2 °C 4 °C 6 °C 8 °C 10 °C 12 °C
Pseudomonadaceae§
87.3 80.9 76.6 69.5 52.2 39.2
GPB¥
8.7 9.4 9.6 13.5 25.2 30.3
Enterobacteriaceae£
3.1 5.8 6.1 7.3 9.8 12.3
Miscellaneous NF-GNB* 0.9 1 3.4 4.2 6.4 8.6
GPC‡
0 0.8 2.3 3.2 5.2 7.3
Un-identified 0 2.1 2 2.3 1.2 2.3
*NF-GNB: Non-Fermenting Gram Negative Bacilli with 75% of Acinetobacter and Stenotrophomonas spp.
568
£Approximately 76% of the isolates from family Enterobacteriaceae were belong to Hafnia and Serratia.
569
§85% of this genera was belong to P. fluorescens.
570
¥GPB: Gram positive Bacilli; 80% of the GPB was belong to B. cereus and M. lacticum.
571
‡GPC:Gram Positive Cocci mainly Streptococci and Staphylococci spp.
18
Table 2573
574
575
*,§,‡Means significance levels by MANOVA (SPSS Windows Ver 21) * P < 0.001; §P < 0.05; ‡P > 0.05.
576
PPrBC: Psychrotrophic proteolytic count; TDPC: Thermoduric psychrotrophic count
577
€ Time to PPrBC of 5 × 10⁴ cfu/mL; † time to reach TDPC of 1 × 10⁴ cfu/mL.
578
¤Protease activity determined by relative fluorescence units; ØProtease concentration determined by standard
579
curve of Thermolysin (EC 3.4.24.27)
580
¥DH: Degree of hydrolysis, which denotes the extent of proteolysis that was determined using OPA-method.
581
Multiple samples were analysed with SD ±1.5 (n = 9).
582
583
584
585
586
587
588
589
590
591
592
593
594
Sample Storage Temperature (ºC)
Time€,† (days)
PPrBC (log cfu/mL)
TDPC (log cfu/mL)
Protease activity (RFU/mL¤)
Protease concentration (ng/mLØ)
DH¥
(proteolysis) (%)
A 2 9€, >10† 4.68 2.87 1.2×10²,‡ 5.0‡ 3.4‡
4 6€, >10† 4.67 2.97 2.8×10³,§ 9.3§ 12.1‡
6 5€, 8† 4.69 4.06 3.9×10⁴,§ 12.1§ 18.2§
8 4€, 5† 4.70 4.01 4.4 ×10⁴,* 13.3* 35.2*
10 2€, † 4.71 4.02 5.0×10⁴,* 15.1* 48.5*
12 1€, † 4.73 4.01 4.3×10⁵,* 15.9* 52.3*
B 2 10€, >10† 4.69 3.05 9.8×101,‡ 2.4‡ 2.5‡
4 8€, >10† 4.69 3.32 1.0×10²,‡ 3.5‡ 8.4‡
6 6€, 7† 4.69 4.06 2.9×10³,§ 5.4‡ 10.4‡
8 4€, † 4.68 4.06 3.4×10⁴,§ 10.6§ 23.3§
10 2€, † 4.67 4.07 3.4×10⁴, * 11.7* 37.1*
12 1€ 4.73 4.08 3.8×10⁴, * 12.9* 42.2*
C 2 8€, 10† 4.69 4.02 2.8×10³,§ 9.3§ 5.8‡
4 5€, 9† 4.68 4.06 4.0×10⁴,§ 11.9§ 15.1§
6 4€, 5† 4.69 4.05 5.3×10⁴,* 13.2* 21.3*
8 3€, † 4.70 4.07 5.5×10⁴,* 15.6* 45.2*
10 2€, † 4.71 4.05 5.5×10⁵,* 17.1* 53.5*
19
Fig. 1595
596
Psychrotrophic proteolytic count (PPrBC) Thermoduric psychrotrophic count (TDPC)
(A)
(B)
(C)
20
Fig. 2599
Protease Activity Proteolysis: Degree of
Hydrolysis (%)
(A)
(B)
(C)
21
Fig.3622
623
22
Caption of Supplementary Tables
627
628
Table S1
629
Relationship between the psychrotrophic proteolytic count (PPrBC) with protease activity (PA),
630
proteolysis (PL) and storage life in the aspect of quality (SLQ) of raw milk stored under different
631
conditions at the end of the storage life.
632
633
Table S2
634
Relationship between the thermoduric psychrotrophic count (TDPC) with protease activity (PA),
635
proteolysis (PL) and storage life in the aspect of safety (SLs) of raw milk stored under different
636
conditions at the end of the storage life.
637
638
Table S3
639
The effect of refrigerated storage and combined high temperature short time (HTST) pasteurisation
640
and refrigerated storage on storage life/shelf life of raw milk stored under different conditions.
641
642
643
644
Caption of Supplementary Figures
645
646
Fig. S1
647
648
Effect of different storage conditions on the total plate counts (TPC) and psychrotrophic bacterial
649
counts (PBC) of A, B and C raw milk samples; at 2 ºC, 4 ºC, 6 ºC, 8 ºC,
650
10 ºC and 12 ºC storage. The results were presented as mean ± SE, (n = 9).
23
Table S1652
Storage Temperature (ºC)
Sample A Sample B Sample C
CC (r) (PPrBC × PA¤)
CC (r) (PPrBC × PL¥)
CC (r) (initial PPrBC × SLQ£)
CC (r) (PPrBC × PA¤)
CC (r) (PPrBC × PL¥)
CC (r) (initial PPrBC × SLQ£)
CC (r) (PPrBC × PA¤)
CC (r) (PPrBC × PL¥)
CC (r) (initial PPrBC × SLQ£)
2 0.65‡ 0.67‡ 0.72‡ 0.65‡ 0.58‡ 0.67‡ 0.72‡ 0.78‡ 0.76‡
4œ 0.98* 0.97* 0.90* 0.83‡ 0.81‡ 0.87§ 0.96* 0.94* 0.91*
6 0.99* 0.98* 0.95* 0.89§ 0.86§ 0.89§ 0.99* 0.98* 0.92*
8 0.97* 0.98* 0.95* 0.91* 0.94* 0.93* 0.92* 0.96* 0.98*
10 0.95* 0.93* 0.90* 0.93* 0.92* 0.91* 0.98* 0.98* 0.96*
12 0.96* 0.95* 0.94* 0.96* 0.92* 0.93* 0.98* 0.98* 0.97*
*,‡,§Means significance levels by MANOVA (SPSS Windows Ver 21) * P < 0.001; §P < 0.05; ‡P > 0.05.
653
CC: Correlation coefficient; PPrBC: Psychrotrophic proteolytic count; PA: protease activity; PL: proteolysis.
654
£S
LQ; Storage life in quality aspect: time to reach PPrBC of 5 × 10⁴ cfu/mL.
655
œ After 6,8 and 5 days of storage of A, B and C samples.
656
¤Protease activity determined by relative fluorescence units/mL.
657
¥Degree of hydrolysis, which denotes the extent of proteolysis that was determined using OPA-method.
658
Multiple samples were analysed with SD ±1.5 (n = 9).
659
660
Table S2661
Storage Temperature (ºC)Sample A Sample B Sample C
CC (r) (TDPC × PA¤)
CC (r) (TDPC × PL¥)
CC (r) (initial TDPC× SLS†)
CC (r) (TDPC × PA¤)
CC (r) (TDPC × PL¥)
CC (r) (initial TDPC× SLS†)
CC (r) (TDPC × PA¤)
CC (r) (TDPC × PL¥)
CC (r) (initial TDPC × SLS†)
2 0.35‡ 0.42‡ 0.43‡ 0.32‡ 0.38‡ 0.47‡ 0.52‡ 0.51‡ 0.50‡
4 0.53‡ 0.52‡ 0.46‡ 0.54‡ 0.56‡ 0.52‡ 0.56‡ 0.54‡ 0.53‡
6 0.68‡ 0.62‡ 0.60‡ 0.65‡ 0.66‡ 0.63‡ 0.75‡ 0.72‡ 0.70‡
8 0.81§ 0.82§ 0.80§ 0.84§ 0.83§ 0.81§ 0.88* 0.91* 0.93*
10 0.87* 0.86* 0.85* 0.90* 0.89* 0.88* 0.93* 0.92* 0.90*
12 0.90* 0.91* 0.90* 0.94* 0.93* 0.92* 0.95* 0.94* 0.93*
*,‡,§Means significance levels by MANOVA (SPSS Windows Ver 21) * P < 0.001; §P < 0.05; ‡P > 0.05.
662
CC: Correlation coefficient; TDPC: Thermoduric psychrotrophic count; PA: protease activity; PL: proteolysis.
663
†S
Ls; Storage life in safety aspect: time to reach TDPC of 1 × 10⁴ cfu/mL.
664
¤Protease activity determined by relative fluorescence units/mL.
665
¥Degree of hydrolysis, which denotes the extent of proteolysis that was determined using OPA-method.
666
Multiple samples were analysed with SD ±1.5 (n = 9).
24
Table S3678
679
*,§,‡Means significance levels by MANOVA (SPSS Windows Ver 21) *P < 0.001; §P < 0.05; ‡P > 0.05.
680
£S
LQ; Storage life in quality aspect: time to reach psychrotrophic proteolytic count (PPrBC) of 5 × 10⁴
681
cfu/mL.
682
†S
Ls; Storage life in safety aspect: time to reach thermoduric psychrotrophic count (TDPC) of 1 × 10⁴
683
cfu/mL.
684
¥ HTST: High temperature short time pasteurisation: 75 ± 0.5 ºC for 15 s heat-treatment.
685
Multiples samples were analysed with SD ±2.1 (n = 9).
686
687
688
689
690
691
692
693
694
695
696
697
698
699
700
Sample Storage Temperature (ºC)
Observed SLQ£
Observed SLS†
Before HTST (days)
After HTST¥ (days)
Before HTST (days)
After HTST ¥ (days)
A 2 9* >10* >10* >10*
4 6§ >10* >10* 10*
6 5§ 9* 8* 8*
8 4‡ 5§ 5§ 6§
10 2‡ 4‡ 2‡ 5‡
12 1‡ 2‡ 1‡ 3‡
B 2 10* >10* >10* >10*
4 8* >10* >10* >10*
6 6§ >10* 7* >10*
8 4§ 8* 4* 8*
10 2‡ 5§ 2§ 6§
12 1‡ 4‡ 1‡ 3‡
C 2 8§ 10* 10* >10*
4 5§ 7§ 9§ 9§
6 4‡ 6§ 7§ 6§
8 3‡ 4‡ 5‡ 5‡
10 2‡ 3‡ 3‡ 3‡
25
701
702
Fig. S1
703
704
(B)
(C)
Total Plate Count (TPC) Psychrotrophic bacterial count (PBC)