POLY(VINYLALCOHOL)NANOCOMPOSITEHYDROGELSFOR INTERVERTEBRALDISCPROSTHESES
(Spine title: PVA Nanocomposite Hydrogels for IVD Prostheses) (Thesis format: Monograph)
by
Elaine Y. L. Wong
Biomedical Engineering Graduate Program
A thesis submitted in partial fulfillment of the requirements for the degree of
Doctor of Philosophy
The School of Graduate and Postdoctoral Studies The University of Western Ontario
London, Ontario, Canada
ii
THE UNIVERSITY OF WESTERN ONTARIO School of Graduate and Postdoctoral Studies
CERTIFICATEOFEXAMINATION
Supervisor
______________________________ Dr. Wankei Wan
Supervisory Committee
_____________________________ Dr. John de Bruyn
______________________________ Dr. John Medley
______________________________ Dr. Amin Rizkalla
Examiners
______________________________ Dr. Brian Amsden
______________________________ Dr. Don Hewson
______________________________ Dr. Jeffrey Hutter
______________________________ Dr. James Johnson
The thesis by
Elaine Y. L. Wong
entitled:
Poly(Vinyl Alcohol) Nanocomposite Hydrogels for Intervertebral Disc
Prostheses
is accepted in partial fulfillment of the requirements for the degree of
Doctor of Philosophy
iii
A
BSTRACTSpinal fusion is currently the gold standard for surgical intervention of interverte-bral disc (IVD) diseases leading to neck and back pain failing conservative treatments. However, fusion removes motion between the vertebrae and can result in adjacent level degeneration. Total disc replacement (TDR) is an emerging treatment alternative that preserves motion, but materials found in clinically available devices bear little resem-blance to the properties of the native IVD. Poly(vinyl alcohol) (PVA) hydrogels are bio-compatible, have mechanical behaviour similar to natural tissues, and properties that can be tuned by varying polymer concentration and physical crosslinking through freeze-thaw cycling. Furthermore, their properties can be modified with the addition of nanofillers. In the present study, PVA hydrogels and its nanocomposites containing Laponite and bacterial cellulose (BC) were investigated in compression and crossing-paths wear for potential application in cervical TDR. While increases in PVA concentration increased stiffness and decreased time-dependent response in neat PVA hydrogels, viscous re-sponse increased with nanofiller addition. BC addition also increased stiffness of the hy-drogels without large changes in water content. To measure wear in the hyhy-drogels, a technique using three-dimensional ultrasound imaging was developed. Wear volume and depth decreased with decreasing water content, while fatigue wear was eliminated with the addition of nanofillers in crossing-paths wear. Finally, a two-component PVA hy-drogel demonstrated that compression properties could be tailored by mimicking the natural IVD structure. These results indicated that various parameters could be used to optimize the properties of PVA and PVA-nanocomposite hydrogels for applications in cervical TDR.
iv
A
CKNOWLEDGEMENTSFirst of all, I would like to sincerely thank my supervisor, Dr. Wankei Wan, for his inspiration in the field of biomaterials and medical devices. I am grateful for his all his ideas, helpful advice, guidance, encouragement and support that culminated with the completion of this thesis. I am also thankful for the direction my advisory committee has given to my project, especially Dr. John Medley for his helpful insight in wear testing and for the loan of the wear tester.
The following people have contributed their expertise and assistance to the work in this thesis: Dr. Jim Lacefield for the use of the ultrasound equipment at Robarts and his knowledge in ultrasound imaging and analysis, the staff at the Biotron for their advice and training on sample preparation and SEM, Clayton Cook from the University Machine Services for help with designing various parts and moulds, Michael Roach from 3M for advice on adhesives and providing us with a sample, Dr. Leonardo Millon for instruction and advice on PVA and mechanical testing, Darcy Small and Dr. Kenneth Wong for the TEM images, Dr. Donna Padavan for help on SEM, Dr. Karen Kennedy for assistance in the preparation and testing of the IVD prototype, undergraduate students Rachel Brown and Ghaleb Sater for their work in the laboratory, Andrew Norman, Jordan DeMello and Xinsheng Li for providing the bacterial cellulose, and Dr. Jian Liu for performing EDX on the cellulose samples. Thank you also to other colleagues in my lab and BME for their friendship through the years.
I am truly blessed to have enjoyed valuable friendships outside of the lab: friends from the King’s community for keeping me rooted and for the wonderful gifts of music and fellowship; and my relatives and friends, especially Anabela, Amanda, Calvin, Karen, Sarah, Wailan, and my EngSci family, who have touched my life and stuck with me through thick and thin. I am humbled by your presence in my life.
v
vi
vii
T
ABLE OFC
ONTENTSviii
ix
3.4.4 Cyclic Compression Testing ______________________________________ 59 3.5 Crossing-Path Wear________________________________________________ 60 3.5.1 Three-Dimensional Ultrasound for Characterization of Wear ____________ 63 3.5.2 Scanning Electron Microscopy ____________________________________ 64 3.6 Two-Component Hydrogel IVD Structure ______________________________ 64 3.6.1 Mould Design _________________________________________________ 65 3.6.2 Two-Component Hydrogel Disc ___________________________________ 65 3.6.3 Compression Testing of Two-Component Hydrogel Disc _______________ 66 3.7 Statistics_________________________________________________________ 66 CHAPTER 4 COMPRESSION PROPERTIES OF PVA AND PVA-NANOCOMPOSITE
x
4.6 Concluding Remarks ______________________________________________ 119 CHAPTER 5 TRIBOLOGY TESTING OF PVA AND PVA-NANOCOMPOSITE HYDROGELS ____________________________________________________________________ 120
5.1 Crossing-Paths Wear Testing _______________________________________ 120 5.2 Volume and Depth of Wear Track ___________________________________ 121 5.3 Wear Track Surfaces and Substructure ________________________________ 123 5.3.1 Surface of Unworn Areas _______________________________________ 126 5.3.2 Wear Track Surfaces ___________________________________________ 126 5.3.2.1 PVA Hydrogels____________________________________________ 128 5.3.2.2 PVA-NC Hydrogels ________________________________________ 129 5.3.3 Subsurface Structure ___________________________________________ 131 5.4 Discussion ______________________________________________________ 133 5.5 Concluding Remarks ______________________________________________ 147 CHAPTER 6 DESIGN OF AMULTI-COMPONENT PVAHYDROGEL-BASED CERVICAL IVD PROSTHESIS______________________________________________________ 149
xi
xii
L
IST OFT
ABLESTable 2.1: Amount of water, collagen, proteoglycans and cells in each component in the intervertebral disc structure. Collagen and proteoglycans
are reported as percentages of the dry weight. _____________________________ 8 Table 2.2: Compressive force acting on cervical discs in various neck positions
as calculated and presented by Cripton et al. [50] based on pressures measured inside the discs [52, 53] using Nachemson’s relationship [54] and
disc dimensions from Pooni et al. [36].__________________________________ 10 Table 2.3: Orientation and location dependence of tensile moduli of human
lumbar annulus fibrosus from non-degenerated intervertebral discs. Data from Elliott and Setton [67] with additional data from Guerin and Elliott
[68] for the outer circumferential AF.___________________________________ 14 Table 2.4: Compressive moduli from unconfined compression of freeze-thaw
PVA hydrogels in the literature. _______________________________________ 27 Table 3.1: PVA and PVA-NC solution compositions. _________________________ 49 Table 3.2: Composition of the 25% alpha calf serum (ACS) lubricant for
crossing-path wear testing. ___________________________________________ 61 Table 4.1: Water contents of unfilled PVA and 10% PVA-NC solutions and
hydrogels (n=5) after 6 FTC. _________________________________________ 71 Table 4.2: Tangent and secant moduli of fresh PVA hydrogels at 0.25 and 0.45
strain tested at a strain rate of 100%/s. __________________________________ 79 Table 4.3: Tangent and secant moduli of fresh Laponite-filled 10% PVA-NC
hydrogels at 0.25 and 0.45 strain tested at a strain rate of 100%/s. ____________ 80 Table 4.4: Tangent and secant moduli of fresh BC and pBC-filled 10%
PVA-NC hydrogels at 0.25 and 0.45 strain tested at a strain rate of 100%/s. _________ 81 Table 4.5: Change in tangent and secant modulus at 0.45 strain after one week
of aging in water and PBS for unfilled PVA hydrogels tested at 100%/s. ______ 101 Table 4.6: Change in tangent and secant modulus at 0.45 strain after one week
of aging in water and PBS for 10% PVA-NC hydrogels tested at 100%/s (–
xiii
Table 4.7: Parameters of elastic and viscous components from fitting of the three-parameter-solid model to creep data from unfilled PVA and 10% PVA NC hydrogels after aging in PBS, and of human lumbar IVD and PVA
hydrogels from literature. ___________________________________________ 114 Table 5.1: Comparison of hydrogel wear depth and volume measurements from
the literature and current study._______________________________________ 137 Table 6.1: Statistical differences in load at 0.25 strain found between strain rates
for the two-component and single component PVA hydrogels (p < 0.05). _____ 153 Table 6.2: Slopes from linear fits of percent change in load from 1%/s at 0.25
strain to logarithm of strain rate of two-component and single component PVA hydrogels, and canine IVD. (R2 values of the fits are shown in
xiv
L
IST OFF
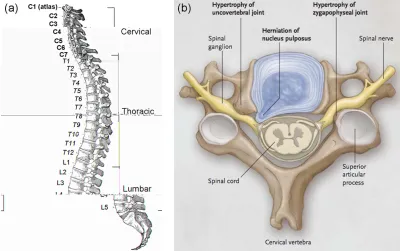
IGURESFigure 2.1: Human vertebral column (Gray, 1918) [32] (a). IVDs are found between vertebrae in the cervical, thoracic and lumbar regions with the exception of C1 and C2. Anatomy of a cervical vertebra depicting nerve impingement due to herniated NP and joint degeneration (b); reproduced
with permission from [33], Copyright Massachusetts Medical Society. _________ 5 Figure 2.2: Structure of the intervertebral disc, consisting of the annulus
fibrosus, nucleus pulposus and endplate, and attached to the vertebral body.
Adapted from [35]. __________________________________________________ 6 Figure 2.3: Shape of cervical, thoracic and lumbar IVD. Redrawn from Pooni
et al. [36]. _________________________________________________________ 7 Figure 2.4: Stress-strain data of oxtail IVDs displaying low modulus toe regions
and loading rate dependence [57]. Reprinted with permission from Race A, Broom ND, Robertson P. Effect of loading rate and hydration on the
mechanical properties of the disc. Spine. 2000;25(6): 662–669. ______________ 11 Figure 2.5: Artificial cervical disc replacements: Prestige ST (A), Bryan (B),
Prodisc-C (C) [77]. Reprinted with permission from Anderson PA,
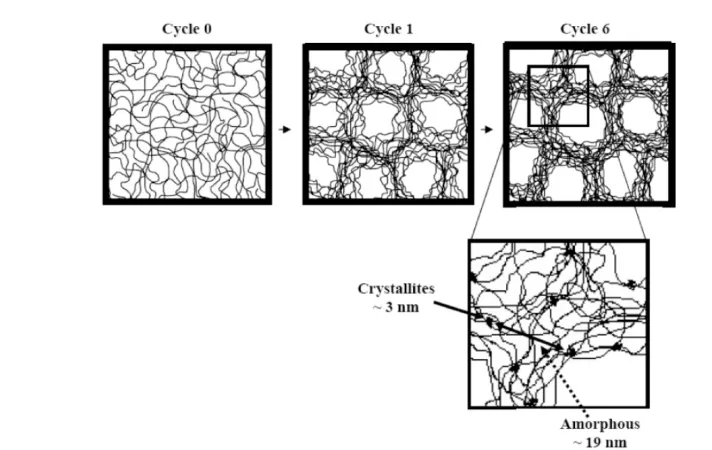
Rouleau JP. Intervertebral disc arthroplasty. Spine. 2004;29(23):2779–86. _____ 18 Figure 2.6: Schematic of PVA hydrogel structure produced by freeze-thaw
cyling as determined by SANS. Cycle 0 represents the PVA solution before thermal cycling. Reprinted with permission from [105]. Copyright 2007
American Chemical Society.__________________________________________ 24 Figure 3.1: Stainless steel platens in a temperature-controlled bath used in
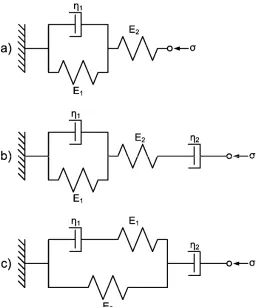
compression testing of hydrogel cylinders._______________________________ 55 Figure 3.2: Spring (Ei) and dashpot (ηi) models for viscoelastic creep; the
“three-parameter-solid” model (a), Burger’s model (b) and Bausch model (c). ________ 58 Figure 3.3: Front view (left) and top view (right) of a retrofitted wear pod set up
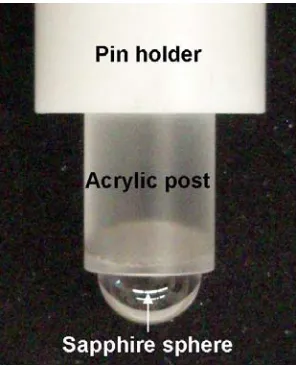
for crossing-paths wear testing.________________________________________ 60 Figure 3.4: Pin for crossing-paths wear testing consisting of a sapphire sphere
counter surface glued with epoxy to an acrylic post. _______________________ 61 Figure 3.5: Aluminum backing glued to the underside of a hydrogel sample with
xv
Figure 3.6: Set-up for 3D ultrasound imaging of the hydrogel samples after crossing-paths wear testing. The linear motor translated the ultrasound
probe to acquire successive B-mode image planes for 3D images. ____________ 64 Figure 3.7: Schematic of the two-component hydrogel disc, 7 mm in thickness,
consisting of an outer annulus component of 20 mm outer diameter and an inner nucleus component of 8 mm diameter. (All measurements in the
diagram are in millimetres.) __________________________________________ 65 Figure 4.1: TEM of spin-coated 10% PVA solution with 1% Laponite showing
dispersion of discrete discs, and agglomerated stacks (indicated by arrows). ____ 69 Figure 4.2: TEM of bacterial cellulose (a) and phosphorylated bacterial ceullose
(b) prepared from dispersions in water. _________________________________ 70 Figure 4.3: SEM of fractured cross-sections of critical point dried unfilled 10%
PVA (a), 15% PVA (b), and 20% PVA hydrogels (c). ______________________ 72 Figure 4.4: SEM of 0.75% (a) and 1% (b) Laponite-filled 10% PVA NC
hydrogel fractured cross-sections.______________________________________ 72 Figure 4.5: SEM of fractured cross-sections of 0.48% BC (a), 0.25% pBC (b),
and 0.4% pBC (c) in 10% PVA. _______________________________________ 73 Figure 4.6: Profile of decreasing mass (a) and volume (b) of hydrogels over 7
days of aging in water and PBS (0.48% BC-10% PVA-NC hydrogels
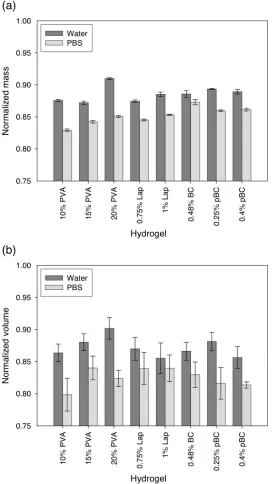
shown). Mass and volume are expressed as fractions of their initial values._____ 74 Figure 4.7: Mass (a) and volume (b) after 7 days of aging in water and PBS for
unfilled PVA and 10% PVA-NC hydrogels, expressed as fractions of their
initial values. All samples experienced decreases in mass and volume. ________ 75 Figure 4.8: Crystallinity determined by DSC in dried PVA in unfilled PVA and
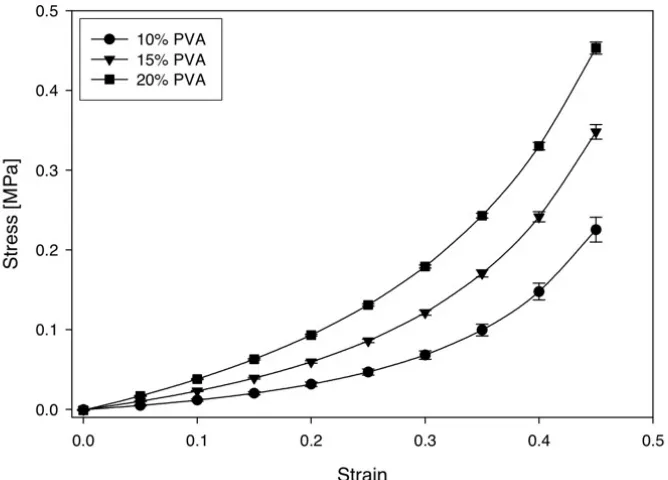
10% PVA-NC hydrogels. ____________________________________________ 76 Figure 4.9: Effect of PVA concentration on stress-strain curves from unconfined
compression of fresh unfilled PVA hydrogels, tested in 37 °C water at a
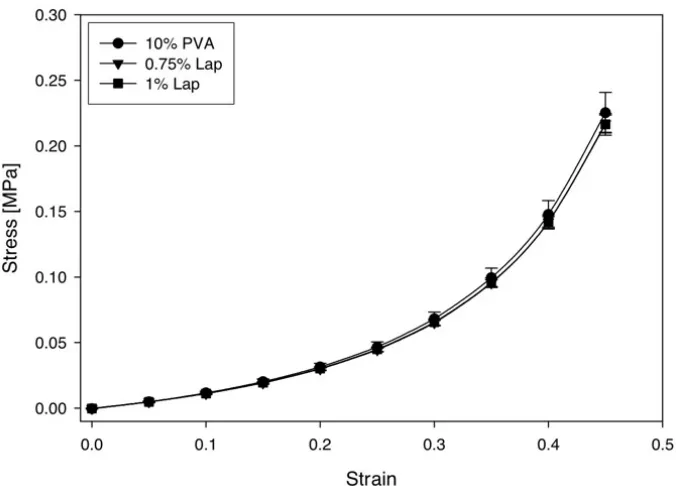
strain rate of 100%/s.________________________________________________ 78 Figure 4.10: Effect of Laponite addition on the stress-strain curves of fresh 10%
PVA hydrogels, tested in 37 °C water at a strain rate of 100%/s.______________ 79 Figure 4.11: The effect of BC and pBC addition on fresh 10% PVA hydrogels,
tested in 37 °C water at a strain rate of 100%/s. The stress-strain curves of 10% and 20% PVA highlights the difference in shape from those of BC-
xvi
Figure 4.12: Tangent (a) and secant (b) moduli of unfilled PVA hydrogels at 0.45 strain, tested at a strain rate of 100%/s fresh, and after one week of
aging in water and PBS. _____________________________________________ 82 Figure 4.13: Tangent (a) and secant (b) moduli of 10% PVA-NC hydrogels at
0.45 strain, tested at a strain rate of 100%/s fresh, and after one week of
aging in water and PBS. _____________________________________________ 83 Figure 4.14: Stress-strain curves of 1% Laponite-10% PVA hydrogels, tested
after one week of aging in PBS at strain rates of 1, 10 and 100%/s,
demonstrating strain rate dependent behaviour. ___________________________ 84 Figure 4.15: Linear relationship between change in stress from 1%/s and
logarithm of strain rate. The slope was used to quantify the degree of strain rate dependence. Fits for 1% Laponite-10% PVA hydrogels, tested fresh,
and after aging for 7 days in water and PBS, are shown. ____________________ 85 Figure 4.16: Degree of strain rate dependence at 0.45 strain for unfilled PVA (a)
and 10% PVA-NC (b) hydrogels. Linear fits have R2 of at least 0.8225.
oNo statistical difference in stress at 0.45 strain between strain rates of 1%/s
and 10%/s. xNo statistical difference in stress at 0.45 strain between strain
rates of 10%/s and 100%/s. ___________________________________________ 86 Figure 4.17: Stress relaxation at 0.25 strain of unfilled PVA hydrogels in PBS.
Increased PVA concentration resulted in decreased stress relaxation. __________ 88 Figure 4.18: Stress relaxation at 0.25 strain of Laponite-containing 10%
PVA-NC hydrogels in PBS in comparison to 10% PVA. Addition of Laponite
resulted in increased stress relaxation. __________________________________ 88 Figure 4.19: Stress relaxation at 0.25 strain of BC and pBC-containing 10%
PVA-NC hydrogels in PBS compared to 10% PVA. Addition of BC and
pBC resulted in increased stress relaxation. ______________________________ 89 Figure 4.20: Stress remaining after one hour of stress relaxation at 0.25 strain in
unfilled PVA (a) and 10% PVA-NC hydrogels (b) tested fresh in water, and
after 7 days of aging in PBS.__________________________________________ 90 Figure 4.21: Creep data of a 10% PVA sample tested fresh in 37 °C water at a
constant stress of 0.05 MPa, and fitted with the three-parameter-solid, and
the four-parameter Burger’s and Bausch viscoelastic models. ________________ 91 Figure 4.22: Creep curves of unfilled PVA hydrogels in 37 °C PBS at a stress of
0.05 MPa for one hour. Increased PVA concentration results in reduction
xvii
Figure 4.23: Creep of Laponite-filled hydrogels compared to 10% PVA in 37 °C PBS at a stress of 0.05 MPa for one hour. Addition of Laponite resulted in
increased creep. ____________________________________________________ 92 Figure 4.24: Creep of BC and pBC-filled hydrogels compared to 10% PVA in
37 °C PBS at a stress of 0.05 MPa for one hour. Addition of BC and pBC
resulted in increased creep. ___________________________________________ 93 Figure 4.25: Percent increase in strain after creep testing at 0.05 MPa stress for
one hour. The increase of PVA concentration (a) decreased creep, while the addition of nanofillers into 10% PVA (b) increased the amount of creep
in the hydrogels. ___________________________________________________ 94 Figure 4.26: Tan δ for unfilled PVA (a) and 10% PVA-NC (b) hydrogels aged
and tested in PBS. Viscous damping increased as strain frequency was increased, and with increases in polymer concentration and nanofiller
addition.__________________________________________________________ 96 Figure 4.27: Linear relationship of stress to water content in unfilled PVA and
10% PVA-NC hydrogels, fresh and after aging in water and PBS (strain: 0.45, strain rate: 100%/s). Hydrogels filled with the high aspect ratio BC and pBC were stiffer than unfilled and Laponite-filled hydrogels relative to
its water content. __________________________________________________ 104 Figure 5.1: Schematic of crossing-paths wear testing on PVA and PVA-NC
hydrogel surfaces. The 9.525 mm diameter spherical sapphire counter surface pin was translated linearly over a length of 8.5 mm and rotated over 28° for each stroke under a normal load of 5 N. Each sample was tested at
a frequency of 1 Hz for 500 000 cycles. ________________________________ 121 Figure 5.2: B-mode plane from 3D US showing the flat surface of 10% PVA
hydrogel before testing (a), outlining of the indent on the top surface of the hydrogel to determine area using the polygon function in ImageJ (b), and a
schematic of indent outlining (c). _____________________________________ 122 Figure 5.3: B-mode images from 3D US of hydrogels showing the
cross-sections of wear tracks in 10% PVA (a), 20% PVA (b), and nanocomposites
of 10% PVA with 1% Laponite (c), 0.48% BC (d) and 0.4% pBC (e). ________ 122 Figure 5.4: Volume of the indent created after crossing-paths wear testing on
unfilled PVA hydrogels (a) and 10% PVA-NC hydrogels (b), measured using ImageJ on 3D US image planes. Wear testing was performed under a normal load of 5 N with a linear reciprocating stroke length of 8.5 mm and 28° pin rotation at 1 Hz for 500 000 cycles. The spherical sapphire counter
surface was 9.525 mm in diameter.____________________________________ 124 Figure 5.5: Maximum depth of wear tracks after crossing-paths wear testing on
xviii
from 3D US image planes using ImageJ. Wear testing was performed under a normal load of 5 N with a linear reciprocating stroke length of 8.5 mm and 28° pin rotation at 1 Hz for 500 000 cycles. The spherical sapphire
counter surface was 9.525 mm in diameter. _____________________________ 125 Figure 5.6: Schematic showing the unworn portion of the hydrogel, and middle
and ends of the wear track (a), and a photograph of a hydrogel sample immediately after wear testing (b). The wear track was slightly yellow in colour from the ACS lubricant and the ends of the wear track were more
indented than in the middle. _________________________________________ 126 Figure 5.7: SEM of critical point dried unworn sections of hydrogel samples
after crossing-paths wear testing: 10% PVA (a), 20% PVA (b), and 10% PVA-NC filled with 1% Laponite (c), 0.48% BC (d), 0.25% pBC (e) and 0.4% pBC (f). Debris on the hydrogel surfaces was likely material worn
away from wear testing. ____________________________________________ 127 Figure 5.8: SEM of the middle (left column) and end (right column) portions of
the wear track surfaces of critical point dried the 10% PVA hydrogel (a, b) and 20% PVA hydrogel (c, d). Arrows indicate the direction of linear
reciprocation._____________________________________________________ 128 Figure 5.9: SEM of the middle (left column) and end (right column) portions of
the wear track surfaces of critical point dried 10% PVA-NC hydrogels filled with 1% Laponite (a, b), 0.48% BC (c, d), 0.25% pBC (e, f) and 0.4% pBC
(g, h). Arrows indicate the direction of linear reciprocation.________________ 130 Figure 5.10: SEM images of liquid nitrogen freeze-fractured, critical point dried
hydrogel cross-sections under the wear track of unfilled 10% PVA (a) and 20% PVA (b), and 10% PVA-NC containing 1% Laponite (c), 0.48% BC (d), 0.25% pBC (e) and 0.4% pBC (f). Pores under the wear tracks were
collapsed and deformed in 10% PVA and 10% PVA-0.25% pBC. ___________ 132 Figure 5.11: Wear volume versus secant modulus (1%/s strain rate) for unfilled
PVA hydrogels and 10% PVA-NC hydrogels in PBS. Wear volume decreased with increased PVA concentration as 10% PVA-based hydrogels had significantly greater wear volumes compared to 15% and 20% PVA
hydrogels. _______________________________________________________ 134 Figure 5.12: Examples of deviations from flatness at the surface of hydrogels in
B-mode 3D US planes away from the wear track: 10% PVA showing a slightly irregular surface (a), 0.75% Laponite in 10% PVA with convexity at the surface (b), and 0.4% pBC in 10% PVA with concavity at the surface
(c). _____________________________________________________________ 136 Figure 6.1: Photograph of the two-component PVA hydrogel prototype with
concentric 20% PVA annulus and 10% PVA nucleus components. The
xix
Figure 6.2: Data from unconfined compression of the 20%/10% PVA two-component hydrogel (Sample 1) at strain rates between 0.001%/s and 100%/s (a), and the data from 0.001%/s fitted with the 5-parameter exponential growth model (b). The model was not able to fit the toe region
between 0 to 0.02 strain. ____________________________________________ 152 Figure 6.3: Average loading curves from unconfined compression of the
20%/10% PVA two-component hydrogel, tested at strain rates from
0.001%/s to 100%/s. _______________________________________________ 153 Figure 6.4: Linear relationship between change in load at 0.25 strain from 1%/s
and logarithm of strain rate for the 20%/10% PVA two-component
hydrogel prototype. ________________________________________________ 154 Figure 6.5: Stress relaxation at 0.25 strain of the 20%/10% PVA
two-component hydrogel prototype after 1 h was decreased compared to 10%
and 20% PVA.____________________________________________________ 155 Figure 6.6: The four-parameter viscoelastic models and the double exponential
model provided better fits than the three-parameter-solid viscoelastic model for Sample 1 of the 20%/10% PVA two-component hydrogel prototype (a). The average creep curves for the two-component hydrogel prototype under an axial load of 40 N, and for 20% and 10% PVA under an applied stress of
0.05 MPa (b)._____________________________________________________ 156 Figure 6.7: Experimental load-strain curves of the 20%/10% PVA
two-component hydrogel prototype compared to predictions from the Voigt model (a), and 20% PVA of the same cross-sectional area as the two-component prototype (b). The two-two-component hydrogel was capable of
xx
L
IST OFA
PPENDICESAppendix A PBS Preparation ___________________________________________ 201 Appendix B Energy-Dispersive X-Ray Spectroscopy of
xxi
L
IST OFA
BBREVIATIONS3D Three-dimensional
ACS Alpha-calf serum
AF Annulus fibrosus
ANOVA Analysis of variance
B-mode Brightness-mode
BC Bacterial cellulose
BSA Bovine serum albumin
CLSM Confocal laser scanning microscopy
CNT Carbon nanotubes
CoCr Colbalt chromium alloy COF Coefficient of friction
DMSO Dimethyl sulfoxide
DSC Differential scanning calorimetry
F-T Freeze-thaw
FDA United States Food and Drug Administration
FOV Field of view
FTC Freeze-thaw cycle
FTIR Fourier transform infrared spectroscopy
HA Hyaluronic acid
HAp Hydroxyapatite
HO Heterotropic ossification
IVD Intervertebral disc
Lap Laponite
Mc Million cycles
MMT Montmorillonite NC Nanocomposite
NMR Nuclear magnetic resonance spectroscopy
NP Nucleus pulposus
NSAID Non-steroidal anti-inflammatory drug
PAAc Poly(acrylic acid)
pBC Phosphorylated bacterial cellulose PBS Phospate buffered saline
PEG Poly(ethylene glycol)
PEO Poly(ethylene oxide)
PET Poly(ethylene terephthalate)
PG Proteoglycan PEEK Polyetheretherketone
pHEMA Poly(2-hydroxyethyl methacrylate)
xxii
PVA Poly(vinyl alcohol)
PVP Poly(vinyl pyrrolidone)
SANS Small angle neutron scattering SAXS Small angle x-ray scattering SEM Scanning electron microscopy TDR Total disc replacement
TEM Transmission electron microscopy UHMWPE Ultrahigh molecular weight polyethylene
US Ultrasound imaging
UV-Vis Ultraviolet-visible spectrophotometry
xxiii
L
IST OFS
YMBOLSA Cross-sectional area, mm2
Ei Spring constant of spring element i in viscoelastic models
Esecant Secant modulus, MPa
Etangent Tangent modulus, MPa
F Load, N
f Percentage of dry mass in hydrogels, %
h Height, mm
m Mass, g
Mn Number average molecular weight, g/mol
r Radius, mm
Ra Average roughness, nm or μm
t Time, seconds or hours
V Volume, mm3
W Dry weight of hydrogels, %
X Crystallinity, %
δ Phase shift angle, rad
ΔHm Heat of melting, J/g
ε Strain
ηi Viscosity of dashpot element i in viscoelastic models
Chapter 1
I
NTRODUCTION
1.1
B
ACKGROUND ANDM
OTIVATIONNeck and back pain affects many adults [1], leading to work absenteeism [2], dis-ability claims [3, 4] and decreased quality of life [5]. Diseases of the intervertebral discs (IVD) are among the causes of neck and back pain [6, 7], which are becoming increas-ingly important in an aging population. IVDs maintain the space between vertebrae, al-low for motion in the spine, distribute and transfer load to the vertebrae, and provide shock absorption [8]. IVDs are highly hydrated, and have low cell numbers and little to no vascularity [6]. Therefore, if they are injured or diseased, they have limited abilities to heal and regain function. The focus of this thesis is in developing a material for cervical IVD replacement.
Degenerative changes of the IVD include disc prolapse, endplate damage and loss of disc height [6]. Spinal fusion remains the gold standard for surgical treatment, but segmental motion is removed [7]. An emerging treatment alternative is artificial disc re-placement, which preserves segmental motion at the affected level. However, clinically available devices are comprised of materials that bear little resemblance in mechanical properties to the native tissue. These treatments may lead to degeneration of the adjacent discs or failure of the implant, requiring further intervention [9].
in-cluding those from our group, have demonstrated the use of low temperature thermal cy-cling to produce PVA hydrogels for cardiovascular [11-16], orthopedic [17-25] and drug delivery applications [26, 27]. Parameters such as polymer concentration [23], number of freeze-thaw cycles [11, 23] and filler addition [13, 24, 28, 29] allow for highly tunable properties in PVA-based hydrogels.
Nanocomposites (NC) are a class of materials in which at least one of the compo-nents possess a dimension in the nanometer range. Nanofillers have a very high surface area to volume ratio due to their small dimensions. Since properties of a composite de-pend on the properties of its components and their interfaces, only a small amount of nanofiller is required to significantly modify the properties of a matrix material [30]. Two different nanofillers were added to PVA hydrogels in this thesis to investigate the effect of filler aspect ratio on hydrogel properties: Laponite, a low aspect ratio, synthetic inorganic clay; and bacterial cellulose, a high aspect ratio nanofibre derived from
Aceto-bacter xylinum fermentation.
1.2
O
BJECTIVESThe main objective of this thesis was to determine the effects of composition on PVA and PVA-NC hydrogels with the goal of designing materials for potential applica-tions in cervical IVD replacements.
The specific objectives were:
1. To determine the effects of increasing PVA concentration, and adding Lapo-nite and bacterial cellulose on the compression properties of PVA hydrogels (Chapter 4)
2. To characterize the effects of crossing-paths wear as a function of PVA con-centration and nanofiller addition, which included the development of a wear measurement technique using high frequency three-dimensional ultrasound imaging to quantify wear in soft materials such as PVA hydrogels (Chapter 5) 3. To design a coherent, multi-component PVA-based hydrogel device based on
Chapter 2
L
ITERATURE
R
EVIEW
This chapter will examine the background and motivation behind the proposed treatment of severe cervical intervertebral disc disease by surgical replacement with a PVA hydrogel-based IVD prosthesis. In order to develop a set of design criteria for the hydrogel material to be used in an artificial IVD, the properties of natural IVDs and cer-vical total disc replacements (TDR) approved by the US FDA are reviewed. Literature on PVA hydrogels and nanocomposites, as well as on potential nanofillers – particularly Laponite and bacterial cellulose – and consideration of the use of these materials in or-thopedic devices are surveyed. This was done to demonstrate the suitability of PVA hy-drogels for IVD applications and to gain insight into how the materials could be com-bined and tailored to achieve the desired properties for implementation in an IVD re-placement device. Furthermore, since articulating surfaces are found in all clinically available cervical TDRs, possible designs for a PVA hydrogel-based device could also incorporate articulation in which wear must be minimized. Therefore, methods and re-sults of characterizing wear of hydrogels, and the usage of three-dimensional ultrasound to image PVA hydrogels are presented.
2.1
P
REVALENCE OFN
ECK ANDB
ACKP
AIN[1]. Annual prevalence of neck pain in workers ranged from 11.0% in the United King-dom to 47.8% in Québec, Canada [3], and limits work activities of up to 14.1% of work-ers [2]. Work absenteeism accounted for up to 11.3% of all insurance claims with the Ontario Workplace Safety & Insurance Board [3]. Risk factors for neck and back pain include age, gender, ethnicity, health factors, activity levels, work conditions and socio-economic status [1, 3, 31].
2.2
I
NTERVERTEBRALD
ISCS
Figure 2.1: Human vertebral column (Gray, 1918) [32] (a). IVDs are found between vertebrae in the cervical, thoracic and lumbar regions with the exception of C1 and C2. Anatomy of a cervical vertebra depicting nerve impingement due to herniated NP and joint degeneration (b); reproduced with permission from [33], Copyright Massachusetts Medical Society.
spine [34]. IVD functions include maintaining disc space, allowing for flexion, exten-sion, rotation and lateral bending between vertebral segments, transferring load to the vertebral bodies and absorbing shock [8]. This review focuses on axial compression properties and cervical IVDs, where data is available. However, lumbar discs have been more commonly studied in the literature.
2.2.1 Intervertebral Disc Anatomy
IVDs are cartilaginous in nature and consist of the nucleus pulposus (NP), annu-lus fibrosus (AF) and endplates (Figure 2.2). They are composed of varying quantities of water, proteoglycans (PG), collagen and cells.
Figure 2.2: Structure of the intervertebral disc, consisting of the annulus fibrosus, nu-cleus pulposus and endplate, and attached to the vertebral body. Adapted from [35].
IVDs differ in shape between regions in the vertebral column (Figure 2.3). In the cervical spine, cross-sectional areas of human cervical IVD range from 200 mm2 at C2–3 to 400 mm2 at C6–7 [36]. Panjabi reported that the width and depth of cervical discs to be 16.0–23.5 mm and 12.0–18.0 mm, respectively. Cervical disc height is approximately 7 mm [37], but varies from 4.5 to 6.5 mm in cadaveric specimens [38].
of the disc. Within a healthy disc, the NP has a swelling pressure of 0.1–0.2 MPa in a recumbent position and up to 1–3 MPa when standing or lifting [35], and supports load through hydrostatic pressure. Its dry weight is made up of proteoglycans (PGs) held in a collagen type II network. The major component of PGs is aggrecan, composed of gluco-saminoglycans (GAGs) such as keratin sulphate and chondroitin sulphate [6, 37]. Chon-droitin sulphate possesses both sulphate and carboxylic acid groups, which enhances its water binding ability [37]. These fixed negative charges provide the osmotic potential that allows the tissue to swell, maintain pressure during loading and re-swell after load removal.
The AF resembles fibrocartilage, and has highly organized layers of type I colla-gen, the structure of which depends on the location of the disc [35, 37]. The AF experi-ences tensile loads from the pressurized NP when an IVD is loaded axially, but can also withstand direct loading due to bending, rotation and translation.
resistance to flow is directional in isolated endplates; flow out of the disc is an order of magnitude higher than into the disc, such that load bearing could be achieved through the increase of hydrostatic pressure, and allows for rehydration of the disc during rest [40]. Resistance increased for outward flow is a result of poroelastic compressive strain and loss of fluid. The endplate is also selective to size and charge, impeding movement of large proteins and enzymes, as well as negatively charged ions such as sulphates and chlorides [43].
The proportion of extracellular matrix and cellular components in the IVD differs and is related to its function. The relative proportions of water, collagen, PGs and cells in the NP, AF and endplates are summarized in Table 2.1.
Table 2.1: Amount of water, collagen, proteoglycans and cells in each component in the intervertebral disc structure. Collagen and proteoglycans are reported as percentages of the dry weight.
Component
Nucleus pulposus
[35, 37]
Annulus fibrosus
[35] Endplates [39, 44, 45]
Water 70–90% 70–78% 54.1–57.5, 60.4%
Collagen 20% 60–70% 65.6–66.4%
Proteoglycans 30–50% 10% 15.1–19.6%
Cell density 4x10⁶ cells/cm3 9x10⁶ cells/cm3
250–325 cells/mm2
(observed optically)
the transport of fluid, nutrient and waste and leading to chemical and mechanical changes in the disc [34].
2.2.2 Degenerative Disc Disease
Back pain that is severe and chronic is often suspected to be discogenic [46], originating from the degenerated IVD [47], which may be due to disc prolapse, radial fis-sures in the annulus and internal disc disruption [6]. A compromised IVD structure may lead to innervation towards the nucleus and endplates, compression of surrounding tissue, and abnormal stress distribution across the damaged disc during loading [6, 7]. Degen-eration may be caused by aging-related loss of disc hydration, injurious loading, and de-crease in nutrient supply and waste removal that affect cell synthesis or result in cell death [7, 35]. In low oxygen conditions, anaerobic cell activity leads to accumulation of lactic acid, inhibiting cell activity [6]. Cells are also sensitive to cyclic loading; an opti-mum range of loading regimes allows for normal cell function, and maintenance and re-pair of the extracellular matrix [48]. Mechanically accelerated disc degeneration could occur with immobilization, since loads that are too low reduce cell synthesis, or high rates, magnitudes or frequency of loading that result in disc damage [48, 49]. Disc de-generation could be caused by genetics, aging, nutritional deficit or loading history. It is precipitated by injury or fatigue failure, mediated by abnormal cellular response, and characterized by structural failure of the disc [6]. Degenerative disc disease describes a painful, degenerated disc and typically affects the cervical and lumbar regions of the spine.
2.2.3 Intervertebral Disc Mechanics
Table 2.2: Compressive force acting on cervical discs in various neck positions as calcu-lated and presented by Cripton et al. [50] based on pressures measured inside the discs [52, 53] using Nachemson’s relationship [54] and disc dimensions from Pooni et al. [36].
Neck position Disc pressure (kPa) Compressive force (N)
Reclining 310 53
Upright 449 75
Flexion (anterior bending) 590 100 Extension (posterior bending) 910 155
Moduli and maximum stress of IVDs increased from the cervical to lumbar region in a canine model [55]. Moroney et al. [56] tested adult human cervical disc segments and found that stiffness in compression was 492 ± 472 N/mm. The large uncertainty may be due to the various stages of degeneration in the discs, but the age, gender and medical history of the discs were not available to the authors. Degeneration tended to decrease compressive stiffness and increase shear stiffness. Variation in compressive strength of IVDs from 2.8 to 13.0 kN was attributed to adaptive remodeling by Adams and Roughley [6].
2.2.3.1 Compressive Stress-Strain Behaviour and Strain Rate Dependence
The stress-strain curves of IVDs loaded in compression are non-linear, described as having an initial toe region, up to 0.05–0.12 strain [55, 57], of low modulus before reaching the higher modulus linear region (Figure 2.4). This may arise from the straight-ening of the collagen crimp in the AF when it is loaded in tension, resulting in lateral bulging and the two regions on the stress-strain curve [55]. Physiological strain of the IVD in compression is up to approximately 15% [58].
in cartilage [59, 60]. Excised bovine caudal IVDs in compression also showed depend-ence of final strain and stiffness on loading rates over six orders of magnitude from 0.3 kPa/s to 30 MPa/s [57]. Stiffness of human lumbar IVDs also increased linearly with the log of displacement frequency by 45% from 0.001 to 1 Hz in dynamic compression, while phase angle decreased by 36% [61]. Both fluid flow and viscoelastic effects from the solid matrix were implicated in the frequency dependence of stiffness and phase an-gle.
modulus increased after 30 minutes of creep, the disc became more compliant after two hours of induced fluid loss that resulted in a loss of disc height. This provides evidence that while the initial load bearing mechanism is through fluid pressurization, loss of fluid over time results in the transfer of load to the solid matrix.
2.2.3.2 Stress Relaxation and Creep
Stress relaxation of canine IVDs, tested at 100% humidity, at 0.05 and 0.15 strain resulted in less than 10% of the initial stress remaining after 30 minutes, and 5.1% and 15.1% volume reduction, respectively, due to water loss [55]. However, the discs were tested at 100% humidity rather than immersed in a buffer, which may have affected the rate of water loss as the presence of ions could have an effect on osmotic pressure. The mechanism for stress relaxation was postulated by the authors to be due to the transport of water from the disc through the endplates into the vertebral bodies.
Burns et al. [63] performed creep testing on human thoracic and lumbar spine segments. Equilibrium deformation was not always attained after 8 hours of loading, and permanent deformation occurred. Lumbar discs experienced more creep than ones from the thoracic region, which may have been due to greater disc heights in lumbar discs. The Kelvin model of creep was found to be insufficient for fitting the creep data. Al-though a four-parameter model, consisting of two parallel Kelvin units, was found to be a better fit for the initial part of the creep curve, the three-parameter-solid model, which consists of a Kelvin unit in series with a spring, was found to be sufficient by the authors.
decrease disc height and increase stiffness. Therefore, these testing conditions may have underestimated the stiffness and creep resistance of the IVDs.
Degeneration resulted in lowered time-dependent viscoelastic response, leading to an increase in initial strain upon loading followed by lowered creep deformation over time [64, 65]. Swelling pressure in the disc decreased from 1–2 MPa in the normal disc to 0.03 MPa in a degenerate disc, and compression stiffness decreased from 1.0 MPa to 0.4 MPa [35]. These would contribute to the detriment of load bearing and viscoelastic properties. The decrease in swelling pressure is a consequence of a decrease in GAGs, which provide fixed negative charges to maintain an osmotic potential [62, 66].
2.2.3.3 Mechanical Properties of IVD Components
Mechanical properties of the AF, NP and endplates have also been studied. The AF is highly anisotropic and mechanical properties are dependent on location due to ori-entation and spatial distribution of collagen fibres (Table 2.3). The highest stiffness is in the circumferential direction and in the anterior outer portion of the disc [67, 68]. How-ever, there was no difference in the linear region modulus between the outer and inner portion in the axial direction [67]. The moduli from the toe region of the stress-strain curves, which result from uncrimping of collagen fibres, were not significantly different between locations and orientations.
swelling and non-linearity of the equilibrium stress-strain curve suggest that the AF load bearing mechanism shifted from fluid pressurization to direct loading on the solid matrix.
The NP was characterized as a weak gel, with storage modulus always greater than the viscous loss modulus in rheological studies [8], and stiffness is much lower than that of the AF [70]. The isotropic solid modulus of the NP was calculated from the ag-gregate [71] and shear moduli [70] to be 0.14 MPa [72]. Dynamic shear stress was found to be frequency dependent, and energy dissipation decreased for degenerated discs due to increased solid-like behaviour [70]. Under unconfined compression between non-porous stainless steel plates, the equilibrium toe and linear moduli of human NP tissue were 3.25 ± 1.56 kPa and 5.39 ± 2.56 kPa, respectively, and relaxation at increments of 0.05 strain was approximately 66% after 5 minutes [73]. The NP supports load mainly by swelling and pressurization within the AF and between the endplates [74], and contributes to load distribution and energy dissipation [70].
Using indentation testing, the stiffness and strength of vertebral endplates were found to be greatest at the posterior and lateral positions and lowest in the centre [75]. Stiffness was between 80 and 175 N/mm, and failure occurred between 60 and 180 N. However, since these tests were performed with the endplate still anchored onto the ver-tebral bone, the spatially varying endplate thickness and the subsurface bone density may have influenced the results. In confined compression against a porous filter, the aggre-gate modulus of baboon endplates was found to be 0.44 ± 0.24 MPa [44]. Fluid pressuri-zation was instantaneous with the application of load and decreased with time as load was Table 2.3: Orientation and location dependence of tensile moduli of human lumbar an-nulus fibrosus from non-degenerated intervertebral discs. Data from Elliott and Setton [67] with additional data from Guerin and Elliott [68] for the outer circumferential AF.
Direction Region of Tensile modulus (MPa)
stress-strain curve Outer Inner
Circumferential Toe 2.52 – 2.53 1.70 ± 1.21 Linear 17.45 – 29.35 5.60 ± 4.67 Axial Toe 0.27 ± 0.28 0.34 ± 0.21 Linear 0.82 ± 0.71 0.96 ± 1.17 Radial Toe 0.19 ± 0.04 –
transferred to the solid matrix at equilibrium. The authors postulated that fluid pressuri-zation within the endplates is responsible for distributing stress across the endplate, al-lowing for efficient load transfer from the disc to vertebral bodies.
2.2.3.4 Summary
The AF, NP and endplates in an IVD possess unique material, structural and me-chanical properties that are related to the function of each component within the disc. Although the mechanical properties of individual components contribute to disc function, the mechanical properties of the intact IVD are also a function of hydration and the rate at which fluid and ions move in and out. Inherent viscoelasticity of the tissue components, fluid pressurization and transport all likely contribute to time dependent properties in the disc [61]. Hydration, osmotic potential and fluid pressurization of the IVD are important determinants in energy dissipation, load bearing and load distribution in the spine. The NP provides hydrostatic pressure to sustain and distribute load, while increases in disc pressure translate to circumferential tensile loads in the AF. The endplates serve to regu-late pressurization through the transport of fluid and ions, as well as maintain nutritional and waste removal requirements to preserve cell population and function in the disc. Loss in hydration decreases disc height and reduces the mobility of the joint. Degener-ated discs are characterized by pain, structural deficiencies, decreased swelling pressure and loss of function. Depending on the severity of degeneration, treatment options are available for alleviating clinical symptoms and restoring function.
2.2.4 Current and Emerging Treatments
auto-graft, associated with decreased fusion time but also an increased risk of donor site mor-bidity, or an interbody cage, which can result in a solid fusion, maintain height and better positioning, but subsidence is a potential complication [76]. While successful in provid-ing stability and removprovid-ing the cause of pain, fusion also eliminates segmental motion, altering biomechanics and possibly leading to adjacent segment disease [34, 77]. 92% of patients who have received fusion either due to trauma or degenerative changes devel-oped adjacent segment degeneration five years after surgery, pointing to a biomechanical cause rather than inherent degeneration [77].
Other surgical procedures include removal of herniated disc material, without re-storing nucleus volume [34], and decompression of the nerves or spinal cord by increas-ing the spinal canal space. In the cervical spine, fusion was more often performed (87% of initial surgeries) and had a lower rate of reoperation (4.9%) than non-fusion surgical procedures (10%) [78]. Non-fusion procedures are possibly providing symptomatic relief but further treatment would be required as the disease progresses.
NP replacements have been investigated for surgical treatment of degenerative IVD. By intervening before irreparable damage is incurred in the AF, NP replacements could provide proper loading on the annulus to encourage healing. They should be able to transport nutrients to the AF to maintain and promote proper function of the annulus cell population since the AF has minimal vascularity [34]. However, NP replacements cannot be used when the annulus or endplates are compromised. They are also more eas-ily dislodged at the point of insertion [77]. Materials investigated for NP replacements include preformed or partially dehydrated synthetic hydrogels, and injectable elastomers and in situ curable polymers, such as silicone, polyurethane and protein-based hydrogels [79, 80]. In addition, a mechanical articulating lumbar NP replacement constructed from polyetheretherketone (PEEK) is currently being evaluated in clinical studies in the US [81].
struc-ture. Reviews have been published on the mechanical requirements of tissue engineered discs and disc components [82], mechanobiology and response of cells to mechanical stresses [83], cell types and postnatal development [7], and the use of growth factors in disc regeneration [84]. Using a 3D-printing technique, a structure resembling the IVD was fabricated using degradable polyurethane, resulting in a concave up J-shaped uncon-fined compressive stress-strain curve that reached a stress of 50 kPa at 0.5 strain [85]. However, the scaffold would not be mechanically sufficient as an IVD replacement on its own.
As an alternative to fusion, artificial total disc replacements (TDR) have been de-veloped to preserve motion following removal of an affected disc.
2.3
C
ERVICALA
RTIFICIALD
ISCSThe goal of artificial disc devices is to restore disc height and allow for segmental motion at the affected level, thereby avoiding immobilization following surgery, donor site complications, degeneration of adjacent discs, and allowing for faster return to nor-mal activities [77]. Approved artificial cervical disc devices include the Bryan disc (Medtronic), Prestige (Medtronic) and Prodisc-C (Synthes) (Figure 2.5). A review by Bartels et al. presents known artificial discs and available data on their range of motion and wear [86].
The FDA approved version of the Prestige disc, Prestige ST, has a stainless steel-on-stainless steel articulation and is secured with screws. The latest iteration, Prestige LP, is fabricated with titanium alloy, rendering it compatible with magnetic resonance imaging, and is hardened with titanium carbide at the articulating surfaces for improved wear resistance. In addition, it uses rails and roughened plasma sprayed surfaces rather than screws for fixation [77, 86, 90]. Prodisc-C has a cobalt chromium alloy articulating against an ultrahigh molecular weight polyethylene (UHMWPE) insert, in a ball and socket configuration [77]. Attachment to the vertebral bone is achieved using a keel and plasma sprayed titanium surface to encourage bone ingrowth [90]. The Prestige ST had a volumetric wear rate of 0.18 mm3 per million cycles (Mc), which was 0.19% of the total implant mass after 20 Mc [91]. Mass loss of UHMWPE in Prodisc-C due to wear was at a rate of 0.88 mg/Mc and the mean wear particle size was 0.37 μm [86]. UHMWPE wear particles are implicated in host response and aseptic loosening of artificial joints [92], but loosening and displacement of artificial discs could have serious consequences due to their location. While the Prestige and Prodisc-C designs are reminiscent of artificial hip and knee joints, the Bryan disc design is closer to that of the natural IVD and therefore it is reviewed in further detail.
2.3.1 BRYAN Disc
The Bryan disc [77, 90, 93, 94] consists of a bioconvex, hyperelastic polyurethane core sandwiched between concave titanium shells and sealed with a stiffer polyurethane sheath, which prevents tissue ingrowth into the disc. Fixation is through bone ingrowth into sintered titanium, which is osteoconductive. Saline is injected into the core during implantation and provides lubrication. This design allows for axial compliance, shock absorption and unconstrained motion similar to the native IVD [95], which are not possi-ble with the high modulus materials and design of the Prestige and Prodisc-C.
Since articulating surfaces are sealed, wear particles from the polyurethane core should remain in the Bryan disc, shielding wear debris from potential host response. In simulator testing, wear debris was contained within the disc [91]. Polymeric wear debris was found outside of the disc in some of the animals in primate and caprine models, but no inflammation or phagocytosis of wear particles was found [93]. The wear debris could have come from the damaged sheath or migrated from the core. Also, polyurethane was not found in distant sites, unlike with polyethylene, poly(methyl methacrylate) and metal wear particles. Clinical and radiological evaluations of patients with Bryan disc arthroplasties at one or two levels revealed no obvious signs of implant wear, loosening or osteolysis after eight years [95]. However, some intracellular debris and chronic in-flammation was found in the periprosthetic tissue of retrieved Bryan discs, while no me-tallic wear debris, acute inflammation or other adverse host response were found [91].
wear rate of 0.57 mm3/Mc resulted, and no metal wear debris was detected [91]. The dis-crepancy in wear rate could be due to the use of different loading profiles.
Artificial discs may be susceptible to heterotopic ossification (HO) [96], when bone growth occurs in soft tissues or outside of the skeletal structure [97]. In TDR, it has been attributed to bracing after surgery, incomplete coverage of endplates by the im-planted disc [94], and milling of bone and muscle damage during the insertion process [96], and may be prevented with nonsteroidal anti-inflammatory drugs (NSAIDs) [98]. HO incidence of up to 66.2% has been reported in Prodisc-C [99]. While some studies did not find incidences of HO in the Bryan disc after 24 [88] and 12–43 months [100], it was found in 13–18% of patients with single level arthroplasty after 12–43 months in other studies [76, 101]. HO occurred in 47.6% of patients eight years after one and two level TDR with the Bryan disc, and all but one (83.3%) developed HO in the inferior disc after bi-level arthroplasty [95]. Fusion of the prostheses occurred in six cases (22%), three of which were from the bi-level group. Since there is lower range of motion in the inferior level, the risk of HO and device fusion increases. However, decreased range of motion due to HO and implant fusion had no effect on clinical outcome, as there was no increase in pain or limitations to activity. Furthermore, adjacent level degeneration was found radiographically only in patients who had pre-existing degeneration prior to TDR.
Three patients were given fusion after disc arthroplasty for adjacent level disease in [88]. Since fusion effectively developed in most patients with bi-level Bryan disc ar-throplasty, the value of performing a subsequent TDR for adjacent level degeneration would have to be considered. On the other hand, Sekhon et al. suggested that cervical arthroplasty with the Bryan disc may be performed after previous cervical fusion unless hypermobility is present or the facet joints were previously resected [100].
dis-cussed with cervical TDR and may be prevented with a properly sized implant [98]. De-spite favourable published clinical outcomes regarding cervical TDR, there was no sig-nificant difference in pain between arthroplasty and fusion procedures 6 months to 2 years after surgery [102]. The potential complications and cost of performing cervical TDR with currently available devices may also outweigh the clinical benefits when com-pared to fusion, but the procedure shows promise as an alternative in the surgical treat-ment of discogenic neck pain and in preventing fusion-related adjacent level degenera-tion.
2.4
PVA
H
YDROGELSPVA is a hydrophilic polymer that can be dissolved in an aqueous solution and crosslinked to form hydrogels with high water content. Physical crosslinking eliminates the need for chemical crosslinkers that can be potentially toxic if left unreacted. Thermal cycling by repeated freezing and thawing is one approach to physical crosslinking, allow-ing for control over crosslinkallow-ing through freezallow-ing and thawallow-ing rates, and the number of freeze-thaw cycles. Stress-strain curves of PVA hydrogels produced in this manner are similar in shape to natural tissues and these hydrogels have been investigated for use in implantable medical devices for a range of applications.
2.4.1 Physically Crosslinked PVA
The structure and properties of F-T PVA hydrogls are dependent on the PVA so-lution and processing factors. Molecular weight may affect the size and number of crys-tallites [10, 109], and increased polymer concentration results in an overall increase in the proportion of the polymer-rich region and decrease in porosity [110]. Freezing rates af-fect the formation of ice crystals [111], while thawing rates have been found to afaf-fect gel formation and mechanical properties [11, 12, 112, 113], and hydrogels do not form at thawing rates above 10 °C/min [112]. However, controlled F-T cycling is not performed in some studies, which relied on freezing in a freezer held at constant temperature and thawing at room temperature, and could affect the structure of the hydrogel as freezing and thawing rates are not controlled [114-116]. As the number of freeze-thaw cycles (FTC) increases, the number and size of crosslinking crystalline domains increase, lead-ing to a densification of the polymer-rich region, hydrogel stability [104, 105, 109, 117] and shrinkage [12], with a corresponding improvement in mechanical properties [13, 24, 103, 105, 114]. There is a maximum number of FTCs beyond which results in no signifi-cant difference in mechanical properties [12, 13, 103, 116]. The addition of salts and electrolytes impacts the gelation, swelling and mechanical properties of PVA hydrogels [27, 118-120]. Anisotropic tensile properties have also been introduced to PVA by stretching after one FTC before additional cycling, leading a higher modulus and an elongated structure in the direction of stretching [14]. PVA hydrogels fabricated through F-T cycling are stable in water up to 70 °C, at which point crystalline domains melt out [113].
PEG could be added during PVA dissolution to induce phase separation when the solution temperature is lowered to room temperature. The molecular weight of PEG af-fected the properties of the gel [108], but this method does not offer the ability to tune properties through additional processing parameters during gelation. Repeated dehydra-tion and rehydradehydra-tion [108], and high temperature annealing [106] of these hydrogels after washing out the PEG were used to improve their creep resistance.
2.4.2 Characterization of PVA Hydrogel Structure
The study of PVA hydrogel structure has been undertaken using various analyti-cal methods. Differential scanning analyti-calorimetry (DSC) has been used to determine the degree of crystallinity of PVA. PVA melting occurs between 190 and 235 °C, and the heat of melting (ΔHm) of 100% crystalline PVA is 138.6 J/g [125]. Hydrated PVA hy-drogels have a significantly lower melting point due to the presence of a solvent [104, 126, 127]. DSC has been performed at a rate of 5–10 °C/min up to 250 °C with nitrogen purging [109, 128] for dried hydrogels. Hassan and Peppas [109] found that crystallinity ranged approximately from 30 to 60% in dried PVA hydrogels. Crystallinity increases with number of FTCs, resulting from the formation of secondary crystalline domains and the growth of primary crystallites by up to 50% [104].
Imaging techniques have been used to study the structure of physically crosslinked PVA hydrogels. 5-(4,6-dichlorotriazinyl)aminofluorescein (5-DTAF) label-ling of PVA enabled examination of the hydrogels in a hydrated state using confocal laser scanning microscopy (CLSM) with fluorescence [106, 131]. Optical microscopy of PVA hydrogel slices showed that separation of polymer rich and polymer poor regions became more evident with increased PVA concentration and number of FTCs, with pore sizes of up to 50 µm [116], which increased with water content [19, 103]. The use of scanning electron microscopy (SEM) to examine hydrogel structure requires the removal of water due to the high vacuum environment in the microscope, but attempts should be made to maintain the pore structure [103, 132, 133]. Environmental SEM was also used to ob-serve hydrogel structure in the hydrated state [123]. Our group has prepared PVA hy-drogel cross-sections for SEM by ethanol dehydration, followed by CO2 critical point drying then freeze-fracturing in liquid nitrogen [16, 24].
water that is tightly bound to PVA molecules. With increasing PVA concentration, the amount of free water and freezable bound water decreased, while the proportion of non-freezable water increased with an increasing number of –OH groups. This agrees with the model that pores are mostly filled with water while amorphous PVA molecules are swollen with water and held together by crystalline domains [117]. Pores in PVA hy-drogels were found to be interconnected [115]. With increased F-T cycling, water mobil-ity and diffusion coefficient decreased [114, 115].
2.4.3 Mechanical Properties
Impact load testing showed that PVA with water content as low as 20% can pro-vide better load damping and shock absorption than UHMWPE, transmitting a lower peak stress upon impact loading [18]. The non-linear concave-up or J-shape stress-strain curves of freeze-thaw PVA hydrogels resemble those of natural tissue in contrast to other synthetic polymers such as UHMWPE [11]. Viscoelastic mechanical behaviour has also been studied through stress relaxation, creep and dynamic mechanical testing. The focus of this section will be on compression properties.
2.4.3.1 Unconfined Compression
MPa at 0.6–0.62 strain for the 20% PVA hydrogel and 1.4 MPa at 0.45–0.47 strain for the 25% PVA hydrogel. Strain rate dependence was not found in shear, in which sample volume is conserved, leading to the hypothesis that fluid flow contributed to the compres-sive stress-strain behaviour and strain rate dependence.
Millon et al. [24] tested 10% PVA hydrogels made using 1, 3 and 6 cycles of con-trolled F-T cycling for cartilage replacement or other orthopedic applications. Uncon-fined compression was performed at 1, 10 and 100%/s to 0.45 strain in water at 37 °C. Strain rate dependence was also apparent only at high strains in 6 FTC hydrogels, and a statistical difference in stress at 0.45 strain was only found between strain rates of 1 and 100%/s, which was 0.13–0.16 MPa. Wang and Campbell [23] produced 3–40 wt% PVA hydrogels using the same F-T conditions as Millon et al. Cylindrical sample dimensions were approximated to lumbar intervertebral disc dimensions, which are approximately 4 cm in diameter and 1 cm in height [135]. Unconfined compression was performed at 3 mm/min to approximately 0.25 strain. Tangent moduli was lowest in 3 FTC-3% PVA and highest for 6 FTC-40% PVA, increasing with both number of FTC and PVA concen-tration.
Compressive moduli from the above studies are listed in Table 2.4. There are dis-crepancies in describing compressive moduli due to the non-linearity of stress-strain curves and strain rate dependence of PVA hydrogels. Tangent moduli vary to a large de-gree depending on the strain at which they were calculated, and strain rate may have an effect on the apparent stiffness. Using only one portion of the stress-strain curve would not provide a complete representation of hydrogel behaviour. Also, hydrogel composi-tion, F-T cycling parameters, and testing conditions such as temperature and immersion in fluid all influence the compressive behaviour of PVA hydrogels.
Table 2.4: Compressive moduli from unconfined compression of freeze-thaw PVA hy-drogels in the literature.
Study
PVA [%]
Sol-vent Additive FTC
Test
environment Strain rate
Modulus [MPa] (strain)
Stammen
2001 [19] 20, 25 0.9% saline – Unknown Water, 37 °C, equilibrated prior to testing
100,
1000%/min Tangent: 2.08–3.02 (0.3), 16.51–19.06 (0.6) Millon
2009 [24] 10 Water – 1, 3, 6 Water, 37 °C 100%/s Tangent: 0.039–1.18 (0.45)
Wang 2009 [23]
3–40 Water – 1, 3, 6 Water, 37 °C 3 mm/min Tangent:
0.001–1.303 (0.05), 0.001–2.117 (0.20) Joshi
2006 [58]
11–15 Water 1–5% PVP
6 PBS, 37 °C 100%/min Tangent:
0.23 (0.15), 0.4 (0.25) Holloway
2011 [116] 10–35 Water 1% PVP 6 PBS, 37 °C 100%/min Linear: 0.070–0.801 (0.01–0.05)
2.4.3.2 Stress Relaxation, Creep and Dynamic Mechanical Properties
the stiffness of the material, increasing with both polymer concentration and number of FTCs. The degree of stress relaxation was found to decrease with increasing polymer concentration in PVA hydrogels by Kobayashi [136]. However, the degrees of stress re-laxation in PVA hydrogels are much lower than in the natural IVD, which decreases to less than 10% of the initial stress after only 30 minutes [55]. Compressive stress relaxa-tion data was successfully fitted to a double exponential decay funcrelaxa-tion by both Millon et al. [24] and Wang and Campbell [23], as was previously done for tensile stress relaxation [11, 13].
Stauffer and Peppas [114] examined creep in 15 wt% PVA with 2–5 FTCs by ap-plying stress for 15 s. However, only final strain was plotted against applied stress, and creep curves were not shown. Final strains of 2 FTC hydrogels were 0.10 to 0.18, in-creasing linearly with applied stress up to 3.5 MPa, while over the range of applied stress, 5 FTC hydrogels had approximately the same final strain of 0.085. Wang and Campbell [23] applied a compressive stress of approximately 0.2 MPa for 30 s in their creep tests. The increase in strain during creep was found to be highest in hydrogels with low poly-mer concentrations. For 15–40 wt% PVA hydrogels with 6 FTCs, the increase in strain ranged from 1.8 to 2.5%, but neither the initial nor final strain was specified. Creep data in this study was fitted with the three-parameter-solid model used in IVD creep.
PVA hydrogels were simulated by a poro-viscoelastic model consisting of the three-parameter-solid model for the solid phase and a fluid phase that can be exuded dur-ing creep [137]. Creep strains of 0.1–0.2 were obtained experimentally for hydrogels containing 40–60% PVA after 8 hours at 0.5 MPa stress, and both initial and final strains decreased with increasing PVA concentration. The poro-viscoelastic model successfully modelled creep behaviour in these hydrogels. The solid polymer phase and flow of the fluid phase both likely contributed to viscoelastic properties.
cyclic strains, which may have been due to polymer deformation that was not immedi-ately recovered between loading cycles [119]. Tan δ decreased with increased loading frequency, indicating more elastic behaviour with faster loading [29]. PVA hydrogels can be characterized as highly elastic with tan δ values on the order of 0.01, compared to at least 0.1 in rubber, since the large proportion of water in hydrogels results in low inter-nal friction [139]. By increasing PVA concentration from 15% to 20% in hydrogels con-taining 3% HA, shear storage modulus increased while loss modulus remained similar, thus decreasing tan δ [29]. This indicates an increase in elastic behaviour with higher polymer content.
In general, mechanical properties are dependent on the structure of PVA hy-drogels, as stiffness increases with polymer concentration and F-T cycling. Viscoelastic properties correlate with polymer concentration and modulus of the hydrogels. Under compression, the role of water flow and permeability also appear to be important in load bearing, strain rate dependence, stress relaxation and creep in PVA hydrogels.
![Figure 2.4 : Stress-strain data of oxtail IVDs displaying low modulus toe regions and loading rate dependence [57]](https://thumb-us.123doks.com/thumbv2/123dok_us/7753414.1271402/34.612.175.507.80.287/figure-stress-strain-displaying-modulus-regions-loading-dependence.webp)