Outcomes and costs of primary care surveillance and
intervention for overweight or obese children: the LEAP 2
randomised controlled trial
Melissa Wake, paediatrician,
1Louise A Baur, professor,
2Bibi Gerner, research officer,
1Kay Gibbons, head of
Nutrition and Food Services,
1Lisa Gold, health economist,
4Jane Gunn, professor,
3Penny Levickis, research
assistant,
1Zoe¨ McCallum, paediatrician,
1Geraldine Naughton, director,
5Lena Sanci, research fellow,
3Obioha C Ukoumunne, statistician
1ABSTRACT
ObjectiveTo determine whether ascertainment of childhood obesity by surveillance followed by structured secondary prevention in primary care improved outcomes in overweight or mildly obese children.
DesignRandomised controlled trial nested within a baseline cross sectional survey of body mass index (BMI). Randomisation and outcomes measurement, but not participants, were blinded to group assignment. Setting45 family practices (66 general practitioners) in Melbourne, Australia.
Participants3958 children visiting their general practitioner in May 2005-July 2006 were surveyed for BMI. Of these, 258 children aged 5 years 0 months up to their 10th birthday who were overweight or obese by International Obesity Taskforce criteria were randomised to intervention (n=139) or control (n=119) groups. Children who were very obese (UK BMI z score≥3.0) were excluded.
InterventionFour standard consultations over 12 weeks targeting change in nutrition, physical activity, and sedentary behaviour, supported by purpose designed family materials.
Main outcomes measuresPrimary measure was BMI at 6 and 12 months after randomisation. Secondary measures were mean activity count/min by 7-day accelerometry, nutrition score from 4-day abbreviated food frequency diary, and child health related quality of life. Differences were adjusted for socioeconomic status, age, sex, and baseline BMI.
ResultsOf 781 eligible children, 258 (33%) entered the trial; attrition was 3.1% at 6 months and 6.2% at 12 months. Adjusted mean differences (intervention− control) at 6 and 12 months were, for BMI,−0.12 (95% CI −0.40 to 0.15, P=0.4) and−0.11 (−0.45 to 0.22, P=0.5); for physical activity in counts/min, 24 (−4 to 52, P=0.09) and 11 (−26 to 49, P=0.6); and, for nutrition score, 0.2 (−0.03 to 0.4, P=0.1) and 0.1 (−0.1 to 0.4, P=0.2). There was no evidence of harm to the child. Costs to the healthcare system were significantly higher in the intervention arm.
ConclusionsPrimary care screening followed by brief counselling did not improve BMI, physical activity, or nutrition in overweight or mildly obese 5-10 year olds, and it would be very costly if universally implemented. These findings are at odds with national policies in countries including the US, UK, and Australia.
Trial registrationISRCTN 52511065 (www.isrctn.org)
INTRODUCTION
Childhood obesity is now endemic in many countries.1 2The long term physical, emotional, social,
reproductive, and economic ramifications are likely to be immense. While prevention and intervention are expected to be needed throughout life for much of the population, effective strategies during childhood may best minimise psychosocial and physical morbid-ity.3 4However, because of the sheer scale of the
pro-blem, tackling childhood obesity in the secondary or tertiary health care sector is not feasible for any but those who are most severely affected.
Primary care physicians, such as general practi-tioners (GPs), seem ideally placed to take on this issue because in many countries they are the only source of primary health care accessible to families across most of the social spectrum. GPs experience barriers in tack-ling childhood obesity, yet see it as extremely impor-tant and are optimistic that they can make a difference.5 6National policies in countries including
the United Kingdom,7United States,8and Australia9
currently endorse the GP or family physician as central to surveillance for childhood overweight and obesity and counselling.
Evidence supporting such an approach in primary care, however, is conspicuously lacking.10 Despite
high political appeal, two recent systematic reviews could not recommend screening because of the poor sensitivity and specificity of body mass index (BMI) cut points, lack of management strategies with demon-strated efficacy, and lack of evidence that benefits out-weigh the harms.11 12We could locate two trials (one
randomised,13 one non-randomised14) in which a
1Royal Children’s Hospital,
Murdoch Childrens Research Institute and University of Melbourne, Parkville, Vic 3052, Australia
2Discipline of Paediatrics and
Child Health, University of Sydney and the Children’s Hospital at Westmead, Westmead, NSW 2145, Sydney, Australia
3Department of General Practice,
University of Melbourne
4
Health Economics Unit, School of Health and Social Development, Deakin University, Burwood, Vic 3125, Australia
5Centre of Physical Activity Across
the Lifespan, School of Exercise Science, Australian Catholic University, Strathfield NSW 2135, Australia
Correspondence to: M Wake, Centre for Community Child Health, Royal Children’s Hospital, Flemington Rd, Parkville, Vic 3052, Australia [email protected]
Cite this as:BMJ 2009;339:b3308
brief primary care intervention was offered to young children whose overweight/obese status was ascer-tained through office surveillance; neither was effec-tive in reducing BMI relaeffec-tive to controls. However, both were hampered by small sample sizes, and, given the clear policy imperatives to locate childhood obesity management in primary care, further research is clearly warranted.
This paper reports 12 month outcomes from the LEAP2 randomised controlled trial. Its primary aim was to reduce BMI gain in overweight or mildly obese 5-10 year old children identified through surveillance in primary care. Secondary aims were to increase phy-sical activity and improve child nutrition, to quantify any harms experienced by the child, and to compare the costs and consequences of the intervention from a health sector perspective.
METHODS
Study design and setting
A randomised controlled trial was nested within a large, cross sectional survey of BMI in family practices in Melbourne (population 3.7 million), Australia.
General practitioner recruitment and education
A non-representative sample of 66 general practi-tioners in 45 family medical practices was recruited by personalised letters sent to 1709 GPs via a paediatric special interest group spanning 11 Melbourne divi-sions of general practice, the Health Insurance Com-mission, GPs from the LEAP1 trial, and contacts made through these networks; the letter was followed by recruitment evenings and practice visits. GPs attended two 2½hour group training sessions for instruction in the“stages of change”model15and training in brief,
solution focused, family therapy.16 They received a
30 minute DVD, developed for the trial, showing role model scenarios of GPs using solution focused therapy in consultations for healthy family lifestyle.
Each GP then conducted two simulated patient ses-sions (an“initial LEAP2 consultation”of 30 minutes, and a“follow-up consultation”of 20 minutes) during standard working hours supported by a mock patient file and materials. These visits mimicked the forthcom-ing intervention consultations, except that a child did not attend with the actor portraying the parent. After each consultation, the actor evaluated the GP’s perfor-mance on 10 items, gave feedback to the GP, and com-municated a summed“global score”(out of 10) via text message to the research team. GPs were paid $A100 per simulated patient consultation. The two GPs who were given a global score≤5 for the second visit were offered an extra set of visits; one withdrew, while the other received higher scores and continued his invol-vement.
Participants
All children aged 5 years 0 months up to their 10th birthday attending participating practices for any rea-son during May 2005 to July 2006 were eligible to be invited into the BMI survey by practice staff.
Researchers also ran one or two dedicated measuring sessions in each of the larger practices, to which parents of all suitably aged children registered with the practice were invited by letter. Children in the survey were eli-gible for the trial if they were not receiving an ongoing weight management programme and were overweight or obese according to the cut-off points of the International Obesity Taskforce.17 Children were
excluded if their BMI z score was≥3.0 (transformed using the LMS method18and the 1990 UK Growth
Reference19), on the basis that a brief secondary
prevention approach was inappropriate. The research team then mailed an informed consent form and baseline questionnaire to interested parents with eligible children, and randomisation occurred once the completed forms were received by the research team. Follow-up was as close as possible to six and 12 months after randomisation, which equated to a mean of 9.0 months (SD 1.1) and 15.2 months (SD 1.2) from the baseline measurements. Thus, recruitment occurred in May 2005-July 2006, inter-vention delivery in October 2005-December 2006, the first follow-up in April 2006-March 2007, and the second follow-up in October 2006-September 2007.
Randomisation
Randomisation by child was stratified by GP and by overweight versus obese status; it was performed by an independent biostatistician using computer gener-ated random numbers. The randomisation sequence was concealed from the study investigators, and the researchers collecting data remained blind to partici-pants’trial status until follow-up was complete. Inter-vention families were notified by the non-blinded member of the research team (BG) and assisted in mak-ing the first doctor’s appointment. Control families were notified via letter; general practice records of con-trol children were subsequently audited to assess pos-sible contamination (that is, attendances for discussion of weight). General practitioners knew the assignment status of any of their children who were in the inter-vention group, but did not otherwise know who among their large client base was enrolled in the survey or trial, so were generally unaware of control group membership.
Intervention design
The intervention had the same components as in the LEAP1 trial,20designed using an intervention mapping
technique within a behavioural epidemiology frame-work. GPs used a brief, solution focused approach21
Intervention delivery
Before the first appointment, the GP received the child’s named intervention materials, BMI, and a two page summary of parent responses from the baseline questionnaire regarding current nutrition, physical activity patterns, and concern regarding their child’s weight status. Parents were offered four consultations over a 12 week period. Visit date, con-tent discussed, and contracts made were recorded on a LEAP2 form in the child’s medical record. If any
“non-LEAP2”visits occurred, the GP was asked to reinforce any LEAP2 strategies previously discussed.
Measures
Follow-up data were collected via written parent questionnaire (at baseline and six and 12 months after randomisation), child questionnaire (at six and 12 months), anthropometric measurement (baseline and six and 12 months), and accelerometry measure-ment (six and 12 months). The primary outcome mea-sure was BMI (weight (kg)/(height (m)2)). Weight was
measured in light clothing to the nearest 100 g using digi-tal scales (Tanita, Japan, ModelTHD-646) and height was measured (twice) to the nearest 0.1 cm using a por-table rigid stadiometer (Invicta, Oadby, Leicester, Model IPO955). The average of the height measure-ments was used in analyses; if the two differed by≥0.5 cm a third measurement was taken and the mean of the closest two values was used. BMI z score was also
calculated using the US Centers for Disease Control (CDC) 2000 sex-specific BMI-for-age growth charts.22
Secondary outcome measures are shown in table 1. Socioeconomic status, a potential prognostic factor, was quantified using the Australian census based Index of Relative Socio-economic Disadvantage score for the participant’s home postal code (mean score for Victoria 1020.3 (SD 59.4)).23Costs were
eval-uated from a healthcare perspective and calculated in Australian dollars ($A) at 2007 costs. Resources required to provide the LEAP2 intervention were recorded by the research team and via an audit of GP visits for intervention and control families. Resource use was valued using appropriate salary scales, travel cost allowances, and fee rates from the Medicare Ben-efits Schedule.24
Sample size
We aimed to reduce the expected increase in BMI from 0.8 to≤0.5 over 12 months. In the LEAP1 trial, the standard deviation of BMI values was 2.2 at both baseline and at 12 months after randomisation, and the correlation between the baseline and 12 month values was 0.88. Using these values, we calculated that 190 overweight or mildly obese children in each group would ensure 80% power at the 5% level of significance (two sided) to detect a reduction in mean BMI increase as small as 0.3 units.
Table 1| Secondary outcome measures used in analysis of primary care surveillance and intervention for overweight or obese children
Construct Measure Additional information
Child waist circumference Lufkin Executive Steel Tape (W606PM); measured
Average of two waist measurements; if they differed by≥1 cm, a third measurement was taken and the mean of the closest two used
Maternal and paternal body mass index
Weight (kg)/(height (m)2 ); measured and self reported
Baseline values reported for self and partner by responding parent. Values at 6 and 12 months measured for the parent(s) present with the child and reported; measured data used preferentially
Physical activity Actical Accelerometer (Mini Mitter); measured
Worn for 7 full days;≥5 valid days required. Valid days had≥10 hours of non-missing data between 6 am-11 pm. Missing data were segments with≥20 minutes of consecutive
“0”counts, or counts >0 that were constant for≥10 minutes. Outcomes across all valid days: mean activity counts/min, and % time spent in moderate to vigorous physical activity
Physical activity 4 day activity diary; parent report
Parent rating of child’s activity on 7 point scale (1=sedentary, 7=intense activity) for each of the 12 15- minute intervals between 3 30 pm and 6 30 pm over two weekdays and two weekend days (total of 48 intervals at each follow-up). Ratings dichotomised as high (≥4 (≥most children’s play))vlow activity
Nutrition 4 day food diary; parent report
Parents reported child’s consumption of each of 10 food and drink items (0, 1, 2, >2 times) for two weekdays and two weekend days, from which were derived dichotomous (“yes”v“no”) variables for five“healthy behaviours”(high fruit, vegetables, and water; low fatty/sugary foods and non-diet sweet drinks) for each day. The number of healthy behaviours per day was summed to give a score between 0 and 5 (higher score indicating more healthy behaviour), thus providing 4 measurements at each wave
Health status Paediatric quality of life inventory (PedsQL 4.0) self report and parent-proxy versions34
23 items that yield total, physical summary, and psychosocial summary scores, each with a possible range of 0-100 (100=best possible health); quantitative variable
Body dissatisfaction Body figure perception questionnaire35; child self report
Child picture scale of 1-7 (1=underweight, 7=obese) from which child picks perceived and ideal selves.“Perceived”minus“Ideal”self yields a discrepancy index, with positive and negatives scores representing desires to be thinner and fatter, respectively
Physical appearance and self worth
Modified from Harter’s perceived competence scale; child self report
Statistical analysis
We used Stata 9.2 software.25Participants were analysed
in the groups to which they were randomised. Linear and logistic regression models (for quantitative and dichoto-mous outcomes respectively) were fitted for unadjusted and adjusted models. In the latter, all comparisons were adjusted for socioeconomic disadvantage,23age at
rando-misation, sex, and baseline score for the outcome (where collected). All analyses except BMI z score were also adjusted for raw BMI at baseline.
For some outcomes, each subject accrued several scores (that is, the 48 scores for parents’ reports of their child’s physical activity and four scores for child’s nutrition—see table 1). For these measures, random effects (“multilevel”) models using maximum likeli-hood estimation26for quantitative outcomes, and
mar-ginal models using generalised estimating equations27
for dichotomous outcomes, were fitted for the regres-sion analyses to allow for within-subject correlation. The six dichotomous items on physical appearance and global self worth (see table 1) were analysed as a multivariate outcome, again using the generalised esti-mating equations method for logistic regression to allow for within-subject correlations.
Sensitivity analyses that additionally allowed for cor-relation between children seen by the same general practitioner provided essentially the same results as the main analyses, so we report only the latter here. Because some quantitative outcomes were non-sym-metrical, results were validated using bias-corrected accelerated bootstrap confidence intervals.28
RESULTS
Table 2 reports baseline characteristics of the children, which were similar in the two trial arms. The location
of participating practices covered the sociodemo-graphic spectrum, with the median practice close to the 50th centile (range from <10th to >90th centile)
on the Index of Relative Socio-economic
Disadvantage.23
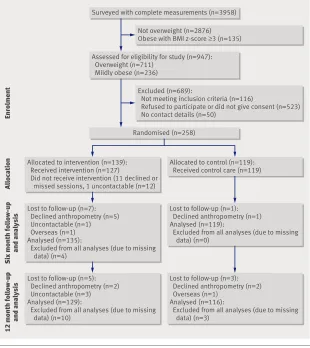
The figure shows the participant flow throughout the trial: 139 and 119 participants were allocated to the intervention and control arms, respectively. Overall attrition rates for anthropometry data collection was 3.1% (250) at six months and 6.2% (242) at 12 months. Completion rates at six and 12 months, respectively, for questionnaires were 97.3% (251) and 91.9% (237); 89.5% (231) and 77.9% (201) for useable accelerometry data; and 93.8% (242) and 88.4% (228) for 4 day food and nutrition diaries.
Primary outcome (body mass index)
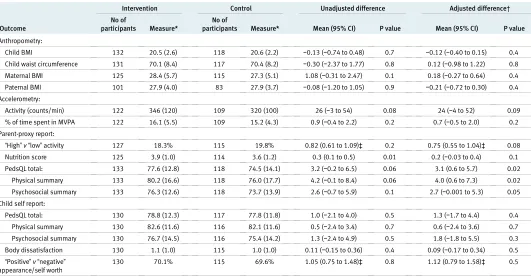
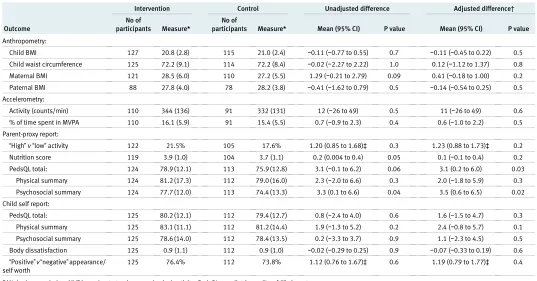
Tables 3 and 4 show unadjusted and adjusted outcome comparisons between the intervention and control arms at six months and 12 months after randomisation respectively. At six months, the adjusted mean BMI of the intervention group was 0.12 lower than that of the control group (adjusted mean difference−0.12 (95%
CI −0.40 to 0.15, P=0.38), and, at 12 months, the
adjusted mean BMI was 0.11 lower (adjusted mean dif-ference−0.11 (−0.45 to 0.22, P=0.51). Mean BMI z score (not shown) and waist circumference were simi-lar in the two trial arms.
Secondary outcomes
Overall physical activity, as measured by accelerome-try, was slightly but not significantly higher in the inter-vention than control group at six months (mean difference 24 counts/min (95% CI−4 to 52, P=0.09)) and at 12 months (mean difference 11 counts/min (−26 to 49, P=0.55)). Similarly, overall nutrition scores were only marginally better in the intervention group (mean difference at six months 0.2 (95% CI −0.03 to 0.4, P=0.10) and at 12 months 0.1 (−0.1 to 0.4, P=0.24)). Parents reported lower consumption of soft drinks in the intervention group at both time points, but no marked differences in fruit, vegetable, fat, or water consumption.
There was no evidence that the intervention was harmful as perceived by the children, whose reports of health related quality of life, body dissatisfaction, and self esteem were similar to those of control chil-dren. Compared with control parents, however, par-ents in the intervention group reported improved child health related quality of life at six months (mean difference 3.1 points higher (95% CI 0.6 to 5.7, P=0.02)) and at 12 months (3.1 points higher (0.2 to 6.0, P=0.03)), which was evident for both the physical and psychosocial summary scores.
Process evaluation
All GPs attended at least one of the GP education ses-sions—65 (98.5%) attended the first, and 64 (97%) attended the second—and all completed the two simu-lated patient consultations.
Table 2| Baseline characteristics of 258 overweight or mildly obese children aged 5-10 years who participated in study. Values are percentages (numbers) of participants unless stated otherwise
Characteristic
Intervention group
(n=139)* Control group (n=119)*
Female 60 (83) 61 (73)
Mean (SD) age (years) 7.4 (1.4) 7.6 (1.4)
Mean (SD) social disadvantage score 1028 (70) 1028 (63)
Maternal education:
Did not complete high school 31 (42) 33 (39)
Completed high school 35 (47) 32 (38)
University degree 34 (45) 34 (40)
BMI category†:
Overweight 75 (104) 78 (93)
Obese 25 (35) 22 (26)
Mean (SD) BMI 20.2 (2.3) 20.3 (1.9)
Mean (SD) BMI z-score 1.9 (0.5) 1.9 (0.5)
Mean (SD) physical activity score 3.4 (0.8) 3.4 (0.8)
% time spent in high activity (parent report) 24.2% 22.1%
Mean (SD) nutrition score 3.7 (1.1) 3.5 (1.2)
Mean (SD) PedsQL (parent report) 74.6 (14.3) 74.6 (14.5)
BMI=body mass index. PedsQL=paediatric quality of life inventory.
*Sample size ranges from 131 to 139 in intervention arm and 111 to 119 in control arm.
Fifty one (37%) of the 139 children in the inter-vention arm attended all four of the interinter-vention con-sultations, 31 (22%) attended three, 29 (21%) attended two, 16 (12%) attended one, and 12 (9%) attended none. Intervention families had a mean of 2.7 LEAP2 consultations. During the 12 months after allocation, intervention and control children both had a mean of 0.9 incidental visits to their LEAP2 GP, and incidental visits to a non-LEAP2 GP were also similar (1.4 for the intervention children and 1.6 for the controls). The general practice record audit indicated minimal con-tamination among the control children: five were weighed and/or measured by their LEAP2 GP during these visits, but there was no indication in their records that weight or weight management was discussed.
Health sector costs
The cost to the health sector of providing the LEAP2 intervention (BMI surveillance, GP recruitment and training) to the 66 participating GPs was $A152000. Including the costs of all GP consultations with partici-pating families, costs borne by the health sector were $A1317 per intervention child and $A81 per control, a difference of $A1236 (95% CI $A1205 to $A1267). It should be noted that the GPs in the LEAP2 trial pro-vided the intervention to an artificially small number of children (2.1 per GP). These costs would fall if the
intervention were provided to a greater number of chil-dren per GP—for example, to $A412 (95% CI $A381 to $A442) if each GP managed 30 children. This still, however, represents a marked increase in costs for no real improvement in the primary or secondary out-comes.
Meta-analysis
Although we aimed for 190 children in each arm of this trial, only 127 remained in the intervention arm and 115 in the control arm at 12 months. This meant that the smallest difference in BMI between the trial arms that could be detected with 80% power was 0.38, rather than the desired 0.30. However, the similarity of design and content provided an opportunity to combine the results from both LEAP trials in a meta-analysis. With a combined total of 196 subjects in the intervention arm and 191 subjects in the control arm at 12 months, the smallest BMI difference detectable with 80% power was 0.30. A fixed effects meta-analysis of combined LEAP2 and LEAP1 data showed that the adjusted mean BMI difference at six months was−0.16 (95%
CI−0.38 to 0.06) and at 12 months was−0.06 (−0.34
to 0.22). Thus, although a mean improvement in the intervention arm as large as 0.3-0.4 is possible, the body of evidence points towards no important differ-ence between the trial arms.
Post hoc analyses
Since national policies often use the proportion over-weight, rather than mean BMI, as the target for asses-sing effective intervention, we also examined outcomes according to dichotomised BMI (that is, overweight/obese versus not overweight/obese) using the International Obesity Taskforce cut points. At 12 months, 77.2% of the LEAP2 intervention chil-dren remained overweight/obese compared with 82.6% of the controls (difference −5.4% (95% CI
−15.5% to 4.6%, P=0.29)). Similar values were
obtained in the meta-analysis (80.2%v84.8%;
differ-ence−4.6% (−12.2% to 2.9%, P=0.23)).
There was no evidence at the 5% level in adjusted models that socioeconomic status (using scores from the disadvantage index) modified the effect of the inter-vention on the main outcomes of BMI, activity, or nutrition at six or 12 months. Similarly, there was no strong evidence that attending more consultations improved BMI at six months (P=0.18) or at 12 months (P=0.60) after adjustment for baseline BMI.
DISCUSSION Principal findings
This trial suggests that current international policy directions for primary care surveillance and brief coun-selling are unlikely to be effective in reducing child-hood obesity. Neither the primary outcome (BMI) nor key secondary outcomes (physical activity, nutri-tion, parental BMI) showed marked improvement. Although there was no evidence that the child experi-enced physical or psychosocial harm as a result of the intervention, a significant investment of healthcare
Surveyed with complete measurements (n=3958)
Randomised (n=258) Assessed for eligibility for study (n=947): Overweight (n=711)
Mildly obese (n=236)
Allocation
Six month follow-up
and analysis
12 month follow-up
and analysis
Enrolment
Allocated to control (n=119): Received control care (n=119) Allocated to intervention (n=139):
Received intervention (n=127)
Did not receive intervention (11 declined or missed sessions, 1 uncontactable (n=12)
Lost to follow-up (n=1): Declined anthropometry (n=1) Analysed (n=119):
Excluded from all analyses (due to missing data) (n=0)
Lost to follow-up (n=7): Declined anthropometry (n=5) Uncontactable (n=1) Overseas (n=1) Analysed (n=135):
Excluded from all analyses (due to missing data) (n=4)
Lost to follow-up (n=3): Declined anthropometry (n=2) Overseas (n=1)
Analysed (n=116):
Excluded from all analyses (due to missing data) (n=3)
Lost to follow-up (n=5): Declined anthropometry (n=2) Uncontactable (n=3) Analysed (n=129):
Excluded from all analyses (due to missing data) (n=10)
Not overweight (n=2876) Obese with BMI z-score ≥3 (n=135)
Excluded (n=689):
Not meeting inclusion criteria (n=116)
Refused to participate or did not give consent (n=523) No contact details (n=50)
resources was incurred that could be used to greater effect elsewhere.
Strengths and limitations of study
Strengths of the study include its randomised design, the objective measures of anthropometry and physical activ-ity, the strong uptake by families and GP practices spanning the range of socioeconomic status, follow-up for a full year, and the extremely high retention rate. Because of the large sample size, the confidence intervals were sufficiently narrow to conclude that any benefit to BMI trajectory was not clinically important. There was no evidence that contamination explains the null find-ings. Though we could not be sure that GPs implemen-ted the intervention as intended, GPs could only proceed to LEAP families once the two simulated patient visits had been delivered satisfactorily.
Limitations include the select volunteer nature of the participating GPs, but it seems unlikely that less com-mitted or interested GPs would achieve a better result. Only a third of the families with a child identified as eligible chose to take up the intervention; again, it seems unlikely that those who were not recruited to the trial would have fared better, and this would be a problem at the public health level only had the inter-vention been effective. It was not possible to blind the families to group membership, but this limitation would typically be expected to increase, not reduce, between-group differences on self reported measures.
Interpretation in light of other studies
These negative findings are congruent with two smal-ler trials of brief, individualised primary care approaches targeting overweight or mildly obese chil-dren identified by screening.13 14Therefore, the most
likely interpretation is that such interventions are inef-fective in reducing BMI. This could be due to insuffi-cient intervention intensity or duration; in recent studies in tertiary obesity clinics, sustained BMI reduc-tion occurred only when intervenreduc-tions occurred over 9-12 months.29 30Interventions in this BMI range might
be more effective when initiated by families seeking help rather than via a screening process. However, this would be unlikely to address the public health issue adequately, as only a minority are sufficiently concerned to seek help for their overweight children, and individual effects have uniformly been modest31 32
or absent.33
Conclusions and policy implications
This brief, physician led, primary care intervention produced no long term improvement in children’s BMI, physical activity, or nutrition. These findings cast doubt on many countries’ current policies that support universal surveillance coupled with brief, indi-vidualised secondary prevention by the primary care sector to reduce childhood obesity. Thus far, each new study has progressively added weight to the view that overweight and mild obesity in primary school
Table 3| Outcomes of trial of primary care surveillance and intervention for overweight or obese children, 6 months after randomisation
Outcome
Intervention Control Unadjusted difference Adjusted difference†
No of
participants Measure*
No of
participants Measure* Mean (95% CI) P value Mean (95% CI) P value
Anthropometry:
Child BMI 132 20.5 (2.6) 118 20.6 (2.2) −0.13 (−0.74 to 0.48) 0.7 −0.12 (−0.40 to 0.15) 0.4
Child waist circumference 131 70.1 (8.4) 117 70.4 (8.2) −0.30 (−2.37 to 1.77) 0.8 0.12 (−0.98 to 1.22) 0.8
Maternal BMI 125 28.4 (5.7) 115 27.3 (5.1) 1.08 (−0.31 to 2.47) 0.1 0.18 (−0.27 to 0.64) 0.4
Paternal BMI 101 27.9 (4.0) 83 27.9 (3.7) −0.08 (−1.20 to 1.05) 0.9 −0.21 (−0.72 to 0.30) 0.4
Accelerometry:
Activity (counts/min) 122 346 (120) 109 320 (100) 26 (−3 to 54) 0.08 24 (−4 to 52) 0.09
% of time spent in MVPA 122 16.1 (5.5) 109 15.2 (4.3) 0.9 (−0.4 to 2.2) 0.2 0.7 (−0.5 to 2.0) 0.2
Parent-proxy report:
“High”v“low”activity 127 18.3% 115 19.8% 0.82 (0.61 to 1.09)‡ 0.2 0.75 (0.55 to 1.04)‡ 0.08 Nutrition score 125 3.9 (1.0) 114 3.6 (1.2) 0.3 (0.1 to 0.5) 0.01 0.2 (−0.03 to 0.4) 0.1
PedsQL total: 133 77.6 (12.8) 118 74.5 (14.1) 3.2 (−0.2 to 6.5) 0.06 3.1 (0.6 to 5.7) 0.02
Physical summary 133 80.2 (16.6) 118 76.0 (17.7) 4.2 (−0.1 to 8.4) 0.06 4.0 (0.6 to 7.3) 0.02
Psychosocial summary 133 76.3 (12.6) 118 73.7 (13.9) 2.6 (−0.7 to 5.9) 0.1 2.7 (−0.001 to 5.3) 0.05
Child self report:
PedsQL total: 130 78.8 (12.3) 117 77.8 (11.8) 1.0 (−2.1 to 4.0) 0.5 1.3 (−1.7 to 4.4) 0.4
Physical summary 130 82.6 (11.6) 116 82.1 (11.6) 0.5 (−2.4 to 3.4) 0.7 0.6 (−2.4 to 3.6) 0.7
Psychosocial summary 130 76.7 (14.5) 116 75.4 (14.2) 1.3 (−2.4 to 4.9) 0.5 1.8 (−1.8 to 5.5) 0.3
Body dissatisfaction 130 1.1 (1.0) 115 1.0 (1.0) 0.11 (−0.15 to 0.36) 0.4 0.09 (−0.17 to 0.34) 0.5
“Positive”v“negative”
appearance/self worth
130 70.1% 115 69.6% 1.05 (0.75 to 1.48)‡ 0.8 1.12 (0.79 to 1.58)‡ 0.5
BMI=body mass index. MVPA=moderate to vigorous physical activity. PedsQL=paediatric quality of life inventory.
*Values are means (standard deviations) unless stated otherwise. Mean differences are shown for quantitative outcomes and odds ratios for dichotomous outcomes.
†Comparisons adjusted for social disadvantage index, age at randomisation, sex, baseline score for the outcome (where collected), and raw BMI at baseline. Analyses of child self reported measures were not adjusted for baseline, as only collected at 6 and 12 month follow-ups. Sample size in adjusted analyses at least 88 in the intervention arm and 75 in the control arm.
children do not meet criteria for the introduction of screening programmes.12 Resources may be better
divided between primary prevention at the commu-nity and population levels, and enhancement of clini-cal treatment options for children with established obesity.
Contributors:The project was initiated and supervised by MW, JG, LAB, ZM, and KG, who also obtained its funding. All authors contributed to developing the protocols and reviewing, editing, and approving the final version of the paper. The trial was implemented by MW, ZM, and BG, who oversaw all stages. BG and PL carried out recruitment and data collection, with other field workers. LS, Colin Riess, and Helen Cahill contributed
medical education planning, implementation, and expertise. Lucy Rogers and Rachel Barratt contributed to recruitment, retention, and data collection from families and general practitioners. OCU conducted the analyses, with the exception of the economic analysis, which was performed by LG. MW and BG wrote the paper, with critical input from the other authors. MW is the guarantor. We thank Colin Riess, Helen Cahill, Lucy Rogers, and Rachel Barratt for their contributions to the project. Funding:This study was funded by the Australian National Health and Medical Research Council (NH&MRC) Project Grant 334309. MW is supported by NH&MRC Career Development Award 284556; LG by NH&MRC Capacity Building Grant 425855; and OCU by NH&MRC Capacity Building Grant 436914. The researchers were independent of the funders.
Competing interests:None declared.
Ethical approval:The project was approved by the Royal Children’s Hospital Ethics in Human Research Committee (EHRC 25006).
1 Wang Y, Lobstein T. Worldwide trends in childhood overweight and obesity.Int J Pediatr Obes2006;1:11-25.
2 Lobstein T, Baur L, Uauy R, for IASO International Obesity Taskforce. Obesity in children and young people: a crisis in public health.Obes Rev2004;5:4-85.
3 Gortmaker SL, Must A, Perrin MJ, Sobol AM, Dietz WH. Social and economic consequences of overweight in adolescence and young adulthood.N Engl J Med1993;329:1008-12.
4 Ebbeling CB, Pawlak DB, Ludwig DS. Childhood obesity: public-health crisis, common sense cure.Lancet2002;360:473-82. 5 Gerner B, McCallum Z, Sheehan J, Harris C, Wake M. Are general
practitioners equipped to detect child overweight/obesity? Survey and audit.J Paediatr Child Health2006;42:206-11.
6 Waters E, Haby H, Wake M, Salmon L. Public health and preventive healthcare in children: current practices of Victorian GPs and barriers to participation.Med J Aust2000;173:98-71.
7 UK Department of Health. Obesity care pathway and your weight, your health. www.dh.gov.uk/PublicationsAndStatistics/ Publications/PublicationsPolicyAndGuidance/ PublicationsPolicyAndGuidanceArticle/fs/en?
CONTENT_ID=4134408&chk=Sq/wNd (accessed 28 Apr 2008). Table 4| Outcomes of trial of primary care surveillance and intervention for overweight or obese children, 12 months after randomisation
Outcome
Intervention Control Unadjusted difference Adjusted difference†
No of
participants Measure*
No of
participants Measure* Mean (95% CI) P value Mean (95% CI) P value
Anthropometry:
Child BMI 127 20.8 (2.8) 115 21.0 (2.4) −0.11 (−0.77 to 0.55) 0.7 −0.11 (−0.45 to 0.22) 0.5
Child waist circumference 125 72.2 (9.1) 114 72.2 (8.4) −0.02 (−2.27 to 2.22) 1.0 0.12 (−1.12 to 1.37) 0.8
Maternal BMI 121 28.5 (6.0) 110 27.2 (5.5) 1.29 (−0.21 to 2.79) 0.09 0.41 (−0.18 to 1.00) 0.2
Paternal BMI 88 27.8 (4.0) 78 28.2 (3.8) −0.41 (−1.62 to 0.79) 0.5 −0.14 (−0.54 to 0.25) 0.5
Accelerometry:
Activity (counts/min) 110 344 (136) 91 332 (131) 12 (−26 to 49) 0.5 11 (−26 to 49) 0.6
% of time spent in MVPA 110 16.1 (5.9) 91 15.4 (5.5) 0.7 (−0.9 to 2.3) 0.4 0.6 (−1.0 to 2.2) 0.5
Parent-proxy report:
“High”v“low”activity 122 21.5% 105 17.6% 1.20 (0.85 to 1.68)‡ 0.3 1.23 (0.88 to 1.73)‡ 0.2 Nutrition score 119 3.9 (1.0) 104 3.7 (1.1) 0.2 (0.004 to 0.4) 0.05 0.1 (−0.1 to 0.4) 0.2
PedsQL total: 124 78.9 (12.1) 113 75.9 (12.8) 3.1 (−0.1 to 6.2) 0.06 3.1 (0.2 to 6.0) 0.03
Physical summary 124 81.2 (17.3) 112 79.0 (16.0) 2.3 (−2.0 to 6.6) 0.3 2.0 (−1.8 to 5.9) 0.3
Psychosocial summary 124 77.7 (12.0) 113 74.4 (13.3) 3.3 (0.1 to 6.6) 0.04 3.5 (0.6 to 6.5) 0.02
Child self report:
PedsQL total: 125 80.2 (12.1) 112 79.4 (12.7) 0.8 (−2.4 to 4.0) 0.6 1.6 (−1.5 to 4.7) 0.3
Physical summary 125 83.1 (11.1) 112 81.2 (14.4) 1.9 (−1.3 to 5.2) 0.2 2.4 (−0.8 to 5.7) 0.1
Psychosocial summary 125 78.6 (14.0) 112 78.4 (13.5) 0.2 (−3.3 to 3.7) 0.9 1.1 (−2.3 to 4.5) 0.5
Body dissatisfaction 125 0.9 (1.1) 112 0.9 (1.0) −0.02 (−0.29 to 0.25) 0.9 −0.07 (−0.33 to 0.19) 0.6
“Positive”v“negative”appearance/ self worth
125 76.4% 112 73.8% 1.12 (0.76 to 1.67)‡ 0.6 1.19 (0.79 to 1.77)‡ 0.4
BMI=body mass index. MVPA=moderate to vigorous physical activity. PedsQL=paediatric quality of life inventory. *Values are means (standard deviations) unless stated otherwise.
†Comparisons adjusted for social disadvantage index, age at randomisation, sex, baseline score for the outcome (where collected), and raw BMI at baseline. Analyses of child self reported measures were not adjusted for baseline, as only collected at 6 and 12 month follow-ups. Sample size in adjusted analyses at least 84 in the intervention arm and 71 in the control arm.
‡Values are odds ratios (95% CI).
WHAT IS ALREADY KNOWN ON THIS SUBJECT
With around 25% of all children worldwide now overweight or obese, hospital services cannot hope to provide adequate weight management services
National policies in many countries (including the US, UK, and Australia) promote primary care surveillance and brief counselling to reduce childhood obesity
Two systematic reviews have highlighted that there is no evidence to support this approach
WHAT THIS STUDY ADDS
Primary care screening followed by brief counselling did not improve body mass index, physical activity, or nutrition in overweight or mildly obese 5-10 year olds, and the approach would be very costly if universally implemented
These findings are at odds with current national policies
8 American Academy of Pediatrics: Committee on Nutrition. Prevention of pediatric overweight and obesity.Pediatrics2003;112:424-30. 9 National Health and Medical Research Council.Clinical practice
guidelines for the management of overweight and obesity in children and adolescents. Canberra: Commonwealth of Australia, 2003. 10 Moyer VA, Butler M. Gaps in the evidence for well-child care: a
challenge to our profession.Pediatrics2004;114:1511-21. 11 Whitlock EP, Williams SB, Gold R, Smith PR, Shipman SA. Screening
and interventions for childhood overweight: a summary of evidence for the US Preventive Services Task Force.Pediatrics
2005;116:e125-44.
12 Westwood M, Fayter D, Hartley S, Rithalia A, Butler G, Glasziou P, et al. Childhood obesity: should primary school children be routinely screened? A systematic review and discussion of the evidence.Arch Dis Child2007;92:416-22.
13 McCallum Z, Wake M, Gerner B, Baur L, Gibbons K, Gold L, et al. Outcome data from the LEAP (Live, Eat and Play) trial: a randomized controlled trial of a primary care intervention for childhood overweight/mild obesity.Int J Obes2007;31:630-6.
14 Schwartz RP, Hamre R, Dietz WH, Wasserman R, Slora E, Myers E, et al. Office-based motivational interviewing to prevent childhood obesity: a feasibility study.Arch Pediatr Adolesc Med
2007;161:495-501.
15 Prochaska JO, DiClemente CC. Stages of change in the modification of problem behaviors.Prog Behav Modif1992;28:183-218. 16 Turnell A, Hopwood L. Solution-focused brief therapy.Case Stud Brief
Fam Ther1994;8:39-51.
17 Cole TJ, Bellizzi MC, Flegal KM, Dietz WH. Establishing a standard definition for child overweight and obesity worldwide: international survey.BMJ2000;320:1240-3.
18 Cole TJ, Green PJ. Smoothing reference centile curves: the LMS method and penalized likelihood.Stat Med1992;11:1305-19. 19 Cole TJ. Growth monitoring with the British 1990 growth reference.
Arch Dis Child1997;76:47-9.
20 McCallum Z, Wake M, Gerner B, Harris C, Gibbons K, Gunn J, et al. Can Australian general practitioners tackle childhood overweight/ obesity? Methods and processes from the LEAP (Live, Eat and Play) randomized controlled trial.J Paediatr Child Health2005;41:488-94. 21 Greenberg G, Ganshorn K, Danilkewich A. Solution-focused therapy. Counselling model for busy family physicians.Can Fam Physician
2001;47:2289-95.
22 Ogden CL, Kuczmarski RJ, Flegal KM, Mei Z, Guo S, Wei R, et al. Centers for Disease Control and Prevention 2000 growth charts for
the United States: improvements to the 1977 National Center for Health Statistics version.Pediatrics2002;109:45-60. 23 Australian Bureau of Statistics.2001 Census of population and
housing: Socio-economic indexes for areas. ABS catalogue 2039.0. Canberra: Commonwealth of Australia, 2003.
24 Australian Government Department of Health and Ageing.Medicare benefits schedule book 2006 (valid 1/11/06-30/10/07). Canberra: Australian Government, 2006.
25 Stata Corporation.Stata Statistical Software: Release 9.2. College Station, TX: Stata, 2005.
26 Goldstein H.Multilevel Statistical Models. 2nd ed. London: Arnold, 1995.
27 Hanley JA, Negassa A, Edwardes MD, Forrester JE. Statistical analysis of correlated data using generalized estimating equations: an orientation.Am J Epidemiol2003;157:364-75.
28 Davidson AC, Hinkley DV.Bootstrap methods and their application. Cambridge: Cambridge University Press, 1997.
29 Wilfley DE, Stein RI, Saelens BE, Mockus DS, Matt GE, Hayden-Wade HA, et al. Efficacy of maintenance treatment approaches for childhood overweight: a randomized controlled trial.
JAMA2007;298:1661-73.
30 Savoye M, Shaw M, Dziura J, Tamborlane W, Rose P, Guandalini C, et al. Effects of a weight management program on body composition and metabolic parameters in overweight children: a randomized controlled trial.JAMA2007;297:2697-704.
31 Golley RK, Magarey AM, Baur LA, Steinbeck KS, Daniels LA. Twelve-month effectiveness of a parent-led, family-focused weight-management program for prepubertal children: a randomized, controlled trial.Pediatrics2007;119:517-25.
32 Kalavainen MP, Korppi MO, Nuutinen OM. Clinical efficacy of group-based treatment for childhood obesity compared with routinely given individual counseling.Int J Obes2007;31:1500-8. 33 Hughes AR, Stewart L, Chapple J, McColl JH, Donaldson MD,
Kelnar CJ, et al. Randomized, controlled trial of a best-practice individualized behavioral program for treatment of childhood overweight: Scottish Childhood Overweight Treatment Trial.
Pediatrics2008;121:e539-46.
34 Varni JW, Burwinkle TM, Seid M, Skarr D. The PedsQL 4.0 as a pediatric population health measure: feasibility, reliability, and validity.Ambul Pediatr2003;3:329-41.
35 Collins ME. Body figure perceptions among preadolescent children.
Int J Eat Dis1991;10:199-208.