1Department of Mechanical Science and Bioengering, Osaka Univ., 1-3, Machikaneyama, Toyonaka 560-8531,
Japan
2Institute Space Dynamics, 3-6, Otodoyama, Narutaki, Ukyouku, Kyoto 616-8255, Japan
3Department of Mechanical Enginering, Ritsumeikan University, 1-1-1, Noji, Kusatsu 525-8577, Japan
Abstract. In this study, at first, the effect of strain rate on the strength and the absorbed energy of polyimide foam was experimentally examined by carrying out a series of compression tests at various strain rates, from 10−3to 103s−1. This polyimide
foam has open cell structure with small cell size of 0.3∼0.6 mm. In the measurement of impact load, a special load cell with a small part for sensing load was adopted. For the measurement of the displacement, a high-speed camera was used. It was found that the flow stress of polyimide foam and the absorbed energy up to a strain of 0.4 increased with the increase of the strain rates. Secondly, the effect of ambient temperature on the strength and absorbed energy of polyimide foam was also investigated by using a sprit Hopkinson pressure bar apparatus and testing at elevated temperatures of 100 and 200◦C. With the increase of temperature, the strength and absorbed energy decreased and the effect is smaller in dynamic tests than static tests.
1 Introduction
As well known, polyethylene and polyurethane foams have generally been used as a shock absorber and an acoustic material in daily various situations. Therefore, there are many researches concerning the constitutive relations of polymer foams in compression [1–3], even in tension [4, 5]. These general foams are suitable and useful enough to absorb impact energy at room temperature. In the environment with an elevated temperature over 100◦C, however, they are not useful because of their lower glass transition temperatureTG. The polymer foam with highTG , such as polyimide foam (TG ≥300◦C), has lately drawn considerable attention from the various fields, especially aerospace field. The mechanical properties of polyimide foams and polyimide foam filled honeycombs [6, 7] were investigated and the recovery behaviour of rigid polymer foams, including polyimide foam, following long periods of compression was also examined at elevated tempera-tures [8]. However, these researches were performed at quasi-static rate, not at dynamic rates. Therefore, it is quite meaningful to investigate the mechanical properties of polyimide foam under dynamic loading, because it is possibly used as a shock absorber at a higher temperature. In this study, the effects of strain rate on the strength and the absorbed energy of polyimide foam were experi-mentally examined by carrying out a series of compression tests at various strain rates, from 10−3 to 103s−1. The effect of ambient high temperature (100 and 200◦C) on the strength and the absorbed energy of polyimide foam was also investigated.
2 Experiment
2.1 Materials and Specimen
Two kinds of foam made of a kind of polyimide provided by Industrial Summit Technology Co., Ltd. (I.S.T.) were
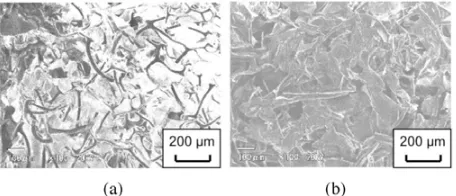
used. They have two different foaming magnifica-tions of 10 and 5, denoted by Foam-A and Foam-B, respectively. The average densities of these foams were, respectively, ρav = 128 and 254 kg/m3. The micro-structures of these forms are shown in figure 1. Typical open cells with fibrous structure are observed in the lighter foam (Foam- A), while filmy structure with many holes can be seen in the surface of Foam-B.
The specimens used are two types of rectangular paral-lelepiped specimen as shown in figure 2. Type-I specimen for quasi-static tests has a square cross section with a side of 14 mm and a height of 20 mm. This was also used for a series of dynamic tests at room temperature. Type–II has a square cross section with a side of 10 mm and 5.5 mm in height, which was only used for the tests at 20, 100 and 200◦C at dynamic rate.
2.2 Experimental methods
A series of quasi-static compression tests was carried out using Instron type universal testing machine at load-ing speed of 2 and 200 mm/min., which correspond to 1.7×10⁻³ and 1.7×10⁻¹s−1, respectively. The load and the displacement of specimen were obtained from the output of the load cell and the displacement of crosshead, respectively.
The setup used for impact compression tests is shown in figure 3. A specimen located attached the flange was impacted by a striker which is accelerated by compressed air. The deformation of a specimen was measured by a high-speed video camera (Phantom V4.2) with 10,000 frames per second. The testing speed of about 20 m/s was attained, which was also obtained from the pictures of video camera. The applied load was measured using a special load cell [9], which has a small detective cylinder attached at one end of a stress-transmitted bar with large cross section. The striker rod has a cylindrical head of
Fig. 2.Compressive specimens : (a) Type-I for quasi-static tests and (b) Type-II for dynamic tests at high temperatures.
Fig. 3.Experimental setup for impact compression test.
Fig. 4. Dropping weight machine for compression tests at medium loading rate.
50 mm in dia., 300 mm in total length and about 0.5 kg. The output of the gauges glued on the detective cylinder surface was fed into a storage oscilloscope passing through a bridge box and amplifiers.
In order to measure the stress-strain relation of the foams at a medium loading speed like 1 m/s, a dropping weight (55 kg) testing apparatus was used as shown in
around 50 s . The load was measured by the load cell used in the impact tests.
For impact compression tests at elevated temperatures, 373 (100◦C) and 473 K (200◦C), the split Hopkinson bar apparatus as shown in figure 5 was used. The striker, input bar and output bar are made of SUS304 stainless steel rod with 16 mm in diameter. The specimen pre-heated up to the temperature over a desired temperature was quickly sandwiched between input and output bars. When the temperature of the specimen decreased to the desired temperature, impact compression test can be performed at a elevated temperature. To reduce the effect of heat from the specimen pre-heated, the location of strain gauges is as far as possible from the specimen. The ordinary relations to obtain the nominal stress,σn, strain,εn, and strain rate, , of the specimen in usual Hopkinson bar technique was used as follows:
σn = Aσt
As (1)
˙ εn =
2
ρCLs(σi−σt) (2) εn =
2 ρCLs
(σi−σt)dt (3) where, tis time and σi,σr andσt are an incident pulse, a reflected pulse and a transmitted pulse propagating in the input and output bars. A, C and ρare, respectively, the cross-sectional area, the velocity of elastic wave and the density of input and output bars. AS and LS are the cross-sectional area and the gauge length of specimen, respectively.
3 Experimental results and discussions
3.1 Average stress and density of specimen
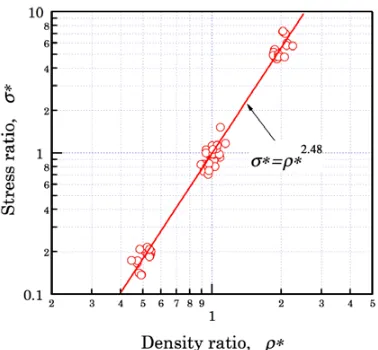
Fig. 6.Relation between average stress ratio and density ratio in Foams-A and -B.
can say that theσ∗is proportional to then-th power ofρ∗ and independent on the strain rate. The relation betweenρ∗ andσ∗can be expressed by
σ∗=ρ∗2.48 (4)
By using eq. (4), all σ–ε curves of A and foam-B were revised to have the density shown in catalogue, ρcat=120 kg/m3andρcat=240 kg/m3, respectively.
3.2 Stress-strain curves of foam-A and -B
The stress-strain curves of the Foam-A & -B compressed at various strain rates from 1.7×10⁻³s−1 to 9.5×10²s−1 are shown in figures 7(a) and 7(b), respectively. The solid line indicates the nominal stress-strain curve at lowest strain rate of 1.7×10⁻³s−1. The curve shows an initial linear elastic region, a relatively gentle increase of plastic flow stress and a region in which a little steeper increase of stress appears, although these three regions are not so clearly distinguished. Since the flow stress at a strain increases with the increase of stain rate, polyimide foam appears to have a positive strain-rate dependency. This may be caused by the strain-rate dependency of polyimide itself and the air failing to get out specimen due to high speed deformation. The level of the flow stress observed in the results of Foam-B is about sixth times greater than that of Foam-A, although the density of Foam-B is only twice as mentioned in the section 2.1. This means that the change of strength by foaming process is much greater than the change of density.
3.3 Effect of strain rate on strength and absorbed energy
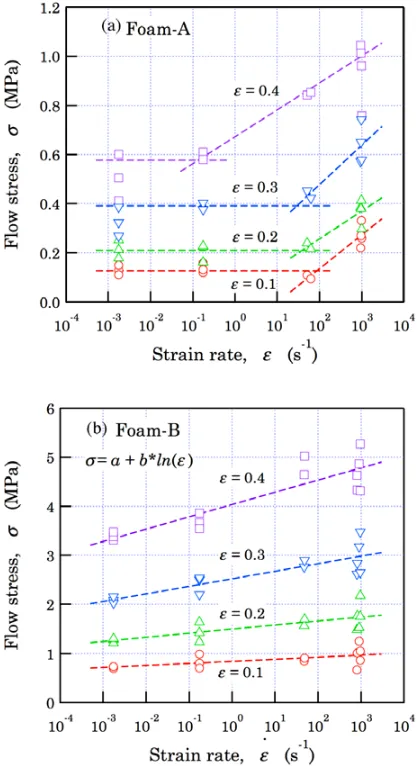
In order to examine the strain-rate dependency of poly-imide foams in detail, we plotted the flow stress at strains of 0.1, 0.2, 0.3 and 0.4 against the strain rate, as shown in Fig. 8. For the lighter foam, Foam-A, the clear strain-rate dependency only appears at the strain rate of over 10 s−1,
Fig. 7. Stress-strain curves of (a) Foam-A and (b) Foam-B obtained at various strain rates.
at least up to the strain of 0.3. For Foam-B, however, relatively large strain-rate dependency are observed in all strain rate range from 10−3∼103s−1. The lines were drawn by applying the least-square method to these data, shown by an equation of
σ=a+bIn( ˙ε) (5) where a and b are constants. The slope b representing the intensity of strain-rate dependency increases with the increase of plastic deformation. Thus, Foam-B with larger density shows greater strain-rate dependency than Foam-A, at least in small deformation.
Fig. 8.Strain-rate dependency of flow stress at strains of=0.1, 0.2, 0.3 and 0.4.
over the strain rate of 10 s−1. In addition, theU of Foam-B is about six or seven times larger thanUof Foam-A as same as in the results of flow stress.
3.4 Stress-strain curves at elevated temperature
In order to clarify the temperature dependency of the strength of polyimide foams, a series of quasi-static com-pression tests ( ˙ε=1.7×10⁻³s−1) was carried out at 20◦C (room temperature), 100◦C and 200◦C by using Type-I specimen (large size specimen in figure 2). The dynamic tests were also performed at 2.7 ∼ 3.6×10³s−1, using Type-I specimen and the sprit Hopkinson pressure bar apparatus (see figure 5) under the same temperature con-dition as the quasi-static test. The stress-strain curves obtained from these tests are shown in figure 10. From these figures, it is found that the rise of stress in both foam specimens delays with the increase of testing temperature. Namely, the flow stress obtained at room temperature is greater than the data at other temperatures. This is because weak thermal softening occurs even under the glass-transition temperature, TG. As shown in figure 10,
Fig. 9.Strain rate dependency of absorbed energy up to=0.4 of Foam-A and -B.
Fig. 10. Stress-strain curves of (a) Foam-A and (b) Foam-B obtained at various testing temperatures.
Fig. 11.Temperature dependency of flow stress of (a) Foam- A and (b) Foam-B obtained from static tests.
3.5 Temperature dependency of flow stress and absorbed energy
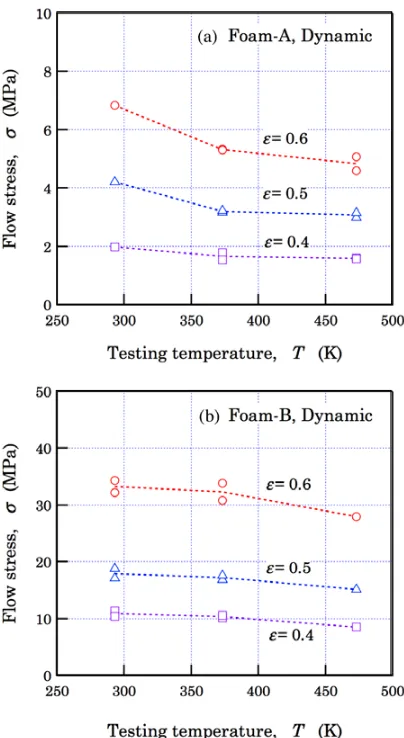
To examine the effect of temperature on the flow stress and absorbed energy in detail, the flow stresses at strains of 0.4, 0.5 and 0.6 and the absorbed energy up to a strain of 0.6 were obtained from the data shown in figure 10 and plotted against the testing temperatures.
The temperature effect on the flow stress of both foams tested at quasi-static rate was shown in figure 11. The broken lines are connecting to the individual average values. The flow stress decreases with the increase of testing temperature. Even at 200◦C, however, the flow stress is maintained to be about 60∼70% of that at 20◦C (room temperature). This is because of the relatively high glass transition temperature,TG, of this polyimide, which is about 350◦C. Thus, relatively large stress can still be maintained at 200◦C.
The variation of flow stress of both foams obtained from dynamic compression tests with temperature is shown in figure 12. Although the flow stress decreases with the increase of testing temperature, the width of the reduction is smaller than that observed in static data, i.e. only
Fig. 12.Temperature dependency of flow stress of (a) Foam- A and (b) Foam-B obtained from dynamic tests.
15∼25% of the flow stress at room temperature. This may be because the pressure of air confined inside of foams becomes as higher at as higher testing temperature. And, the air effect in dynamic tests is obviously larger than that in static tests because air does not have sufficient time to go out of the foams during dynamic tests. This may be the reason why the temperature effect in dynamic tests is smaller than that in static tests.
The absorbed energy up to a strain of 0.6 estimated from figure 10 is shown in figure 13. The absorbed energy decreases with the increase of temperature, as easily being supposed from figures 11 and 12. It is also found that the reduction ratio of dynamic data is smaller than that of static data.
4 Concluding remarks
Fig. 13.Temperature dependency of absorbed energy up to=0.6 of (a) Foam-A and (b) Foam-B.
3.6×10³s−1. The principal results obtained are as follows: 1. The flow stress during deformation and the absorbed energy up to the strain of 0.4 of Foam-B depend on
We would like to express our grateful appreciation to Mr T. Sakata and I. S. T. Co. Ltd. for the provision of the polyimide foams.
References
1. A. Nagy, W.L. Ko, and U.S. Lindholm, J. of Cellular Plastics,10, 127 (1974)
2. J.A. Sherwood and C.C. Frost, Polymer Eng. Sci.,32, 1138 (1992)
3. H. Zhao, Polymer Testing,16, 507 (1997)
4. Q. Liu and G. Subhash, Polymer Eng. Sci., 44, 463 (2004)
5. L. Sorrentino, M. Aurilia and S. Iannace, Polymer Testing,26, 878 (2007)
6. P.C.M. Tate, S. Talal, C.J. Page and R.K. Scarrow, Cellular Polymers,19, 309 (2000)
7. A. Kuwabara, M. Ozasa, T. Shimokawa, N. Watan-abe and K. Nomoto, Adv. Compo. Mater., 14, 343 (2005)
8. C. Resewski and W. Buchgraber, Materialwissen-schaft und Werkstofftechnik,34, 364 (2003)