POWER QUALITY IMPROVEMENT OF GRID
CONNECTED DISTRIBUTION SYSTEM WITH P-Q
CONTROLLER
1
Ch.Anil Kumar,
2K.Gowthami
ABSTRACT
This paper presents a The micro grid concept introduces the power is generated from the renewable energy sources like p.v wind, fuel cell, micro turbine etc will give signifying moment in near future. these power generating stations interconnected for consumer applications this results increase circuit complexity, cost and system have less reliability. The Generation of power is transmitted through transmission lines source to load it will have some power quality problems like voltage sag,swell,voltage flickers and voltage drops due to this system will loss the reliability. This can compensated in paper to improve the power quality from source to load by P-Q control through shunt active fliter . Mode, the feeder flow is regulated to a constant, the extra load demand is picked up by the hybrid source, and, hence, the feeder reference power must be known. he system can maximize the generated power when load is heavy and minimizes the load shedding area. When load is light, the UPC mode is selected and, thus, the hybrid source works more stably. The changes in operating mode only occur when the load demand is at the boundary of mode change; otherwise, the operating mode is either UPC mode or FFC mode. Besides, the variation of hybrid source reference power is eliminated by means of hysteresis. The proposed operating strategy with a flexible operation mode change always operates the PV array at maximum output power and the PEMFC in its high efficiency performance band, thus improving the performance of system operation, enhancing system stability, and decreasing the number of operating mode changes.in the MATLAB simulink environment.
Index Terms: Micro Grid, Grid-Tied Mode, Coordination Control Operations, PV System, Fuel
Cell Power Generation
.I INTRODUCTION
proposed using steady-state analysis [4]–[7]. In addition, the steady-state performance of a grid-connected wind- and photovoltaic (PV)-power system with battery storage was analyzed [8]. This paper focused on system engineering, such as energy production, system reliability, unit sizing, and cost analysis, based on long terms of data hourly, daily, and yearly recorded. A simulation package was developed for a PV power system [9]. Most applications are for stand-alone operation, where the
main control target is to balance local loads. A few grid-connected systems consider the grid as just a back-up means to use when there is insufficient supply from renewable sources [4], [5], [8]. They are originally designed to meet local load demands with a loss of power-supply probability of a specific period. Such systems, focusing on providing sustainable power to their loads, do not care much about the quality or flexibility of power delivered to the grid. From the perspective of utility, however, a system with less fluctuating power injection or with the capability of flexibly regulating its power is more desirable. In addition, users will prefer a system that can provide multiple options for power transfer since it will be favorable in system operation and management. Control strategies of such a system should be quite different from those of conventional systems. This paper addresses dynamic modeling and control of a grid-connected PV–battery system with versatile power transfer. i this system, unlike conventional systems, considers the stability and dispatch-ability of its power injection into the grid. The system can operate in different modes, which include normal operation without use of battery, dispatch operation, and averaging operation. In order to effectively achieve such modes of operation, two modified techniques are applied; a modified hysteresis control strategy for a battery charger/discharger and a power averaging technique using a low-pass filter. The concept and principle of the system and its supervisory control are described. Classical techniques of maximum power tracking are applied in PV array using MPPT control. Dynamic modeling and simulations were based on Power System Computer Aided Design/Electromagnetic Transients Program for DC (PSCAD/EMTDC), power-system transient-analysis software. The program was based on Dommel’s algorithm, specifically developed for the simulation of high-voltage direct current systems and efficient for the transient simulation of power system under power-electronic control of inverter and its control system were developed.
1.1 Grid Operation
Wherever the basic main diagram of a AC/DC micro grid shows it will consists two renewable energy sources one is P.V the output of P.V array is connected to the boost converter.
Fig.1. Block diagram of micro grid
The hybrid grid can operate in two modes One is grid-tied mode and isolated mode the present work is did in grid-tied mode The boost converter and WTG are controlled to provide the maximum power. the main converter is to provide stable dc bus voltage and required reactive power and to exchange power between the ac and dc buses. When the output power of the dc sources is greater than the dc loads, the converter acts as an inverter and injects power from dc to ac side. When the total power generation is less than the total load at the dc side, the converter injects power from the ac to dc side. When the total power generation is greater than the total load in the hybrid grid, it will inject power to the utility grid.
II MODELLING OF P.V SYSTEM
Generally, a PV module comprises of a number of PV cells connected in either series or parallel the classical equation of a PV cell describes the relationship between current and voltage of the cell (neglecting the current in
Fig.2. Equivalent circuit of PV cell
exp 1
A I R V I
I
Iph L O ph se ph
exp 1
s o rs
p ph p O
n V K I
n I n I
Where Io denotes the PV array output current, V is the PV output voltage, is the cell photocurrent that is proportional to solar irradiation, is the cells reverse saturation current that mainly depends on the temperature, is a constant, n and are the numbers of series strings and parallel strings in the PV array, respectively.
2.1 MPPT (P&O method)
Define Perturb-and-observe (P&O) method is dominantly used in practical PV systems for the MPPT control due to its simple implementation, high reliability, and tracking efficiency. Shows the flow chart of the P&O method [4-5]. The present power P (k) is calculated with the present values of PV voltage V (k) and current I (k), and is compared with the previous power P (k-1). If the power increases [6-7], keep the next voltage change in the same direction as the previous change.
2.2 Dynamic Modeling of Boost Converter
The main objective of the boost converter is to track the maximum power point of the PV array by regulating the solar panel terminal voltage using the power voltage characteristic curve.
Fig.4. Boost Converter
0 ) 1 ( 1 1
D V ESRi dt
di L
Vin C
iD1 iC1 iL1
in
C L Out in 1 C L 1 1 1 1 1 C . L . V 0 v i 1 0 V V 0 L 1 v i C R 1 C D 1 L D 1 L ESR v i 1 1 1 1 1 1
III. MODELING OF BATTERY
Battery acts as a constant voltage load line on the PV array and is charged both by PV array and induction generator .the battery is modeled as a nonlinear voltage source whose output voltage depends not only[8-9] on the current but also on the battery state of charge(SOC), which is non linear function of the current and time :
IV p-q THEORY POWER COMPONENTS
The p-q theory implements a transformation from a stationary reference system in a-b-c coordinates, to a system with coordinates α-β-0. It corresponds to an algebraic transformation, known as Clarke transformation [5], which also produces a stationary reference system, where coordinates α-β are orthogonal to each other, and coordinate 0 corresponds to the zero-sequence component. The zero sequence component calculated here differs from the one obtained by the symmetrical components transformation, or Fortescue transformation [6], by a 3 factor. The voltages and currents in α-β-0 coordinates are calculated as follows:
i dt
A dt i Q Q K i R V V b b b b Ob exp
c b a c b a c b a i i i T i i i v v v T v v v , 0
2 3 2 3 0 2 1 2 1 1 2 1 2 1 2 1 T
The p-q theory power components are then calculated from voltages and currents in the α-β-0 coordinates. Each component can be separated in its mean and alternating values , which present physical meanings:
4.1 Instantaneous Zero-Sequence Power (
p0)
0 0 0 0 0 ~ p p i v
p
0
p − Mean value of the instantaneous zero sequence power. It corresponds to the energy per time unity that is transferred from the power source to the load through the zero-sequence components of voltage and current.
0
~
p − Alternating value of the instantaneous zero-sequence power. It means the energy per time unity that is exchanged between the power source and the load through the zero-sequence components of voltage and current. The zero-sequence power exists only in three-phase systems with neutral wire. Moreover, the systems must have both unbalanced voltages and currents, or the same third order harmonics, in both voltage and current, for at least
one phase. Itis important to notice that p0cannot exist in a power system without the presence of ~p0. Since
0
~
p is clearly an undesired power component (it only exchanges energy with the load, and does not transfer any
energy to the load), bothp0 and ~p0 must be compensated.
4.2 Instantaneous Real Power ( p )
p p i v i v
0
p − Mean value of the instantaneous real power. It corresponds to the energy per time unity that is transferred from the power source to the load, in a balanced way, through the a-b-c coordinates (it is, indeed, the only desired power component to be supplied by the power source).
0
~
p − Alternating value of the instantaneous real power. It is the energy per time unity that is exchanged between the power source and the load, through the a-b-c coordinates. Since p ~ does not involve any energy transference from the power source to load, it must be compensated.
4.3 Instantaneous Imaginary Power ( q )
q q i v i v
q ~
q
− Mean value of instantaneous imaginary power.
q~
− Alternating value of instantaneous imaginary power. The instantaneous imaginary power,
q
, has to do with power (and corresponding undesirable currents) that is exchanged between
the system phases, and which does not imply any transference or exchange of energy between
the power source and the load. Rewriting equation in
a
-
b
-
c
coordinates the following
expression is obtained:
3
b a c a c b c b
a v i v v i v v i v
q
This is a well known expression used in conventional reactive power meters, in power systems without harmonics and with balanced sinusoidal voltages. These instruments, of the electro dynamic type, display the mean value of equation .The instantaneous imaginary power differs from the conventional reactive power, because in the first case all the harmonics in voltage and current are considered. In the special case of a balanced sinusoidal
voltage supply and a balanced load, with or without harmonics, q is equal to the conventional reactive
power q 3v1i1sin 1.
Fig. 1 P-Q Theory Power Components
c b a c c b b a
ai v i v i p p p v
p1
0 0
0
1 v i v i v i p p
p
Thus, to make the three-phase instantaneous power constant, it is necessary to compensate the alternating power
components p0and ~p0. Since, as seen before, it is not possible to compensate only~p0,all zero-sequence instantaneous power must be compensated.
Moreover, to minimize the power system currents, the instantaneous imaginary power, q, must also be
compensated. The compensation of the p-q theory undesired power components (~p0 , p0 and q ) can be accomplished with the use of an active power filter. The dynamic response of this active filter will depend on the time interval required by its control system to calculate these values.
V p-q THEORY APPLIED TO SHUNT ACTIVE FILTER THROUGH INVERTER
The p-q theory is one of several methods that can be used in the control active filters. p is usually the only
desirable p-q theory power component. The other quantities can be compensated using a shunt active filters. p0 can be compensated without of any power supply in the shunt active filters. The quantity is delivered from the power supply to the load through the active filter. This means that the energy previously transferred from the source to the load through the zero sequence components of voltage and current is now delivered in a balanced way from the source phases. It is also possible to conclude from the fig” below that the active filter capacitor is
To calculate the reference compensation currents in the “α” and “β” coordinates, the expression is inversed, and
the power to be compensated(p~ -p0 and
q
) are used.
q p p v v v v v v i i c c 0 2 2 ~ 1 * * Since zero sequence current must be compensated the reference compensation in the “0” coordinate is i0itself
ic0 *=i0
In order to obtain the reference compensation currents in the a-b-c coordinates the inverse of the transformation given expression * * * 2 3 2 1 2 1 2 3 2 1 2 1 0 1 2 1 3 2 0 * * * c c c cc cb ca i i i i i i
* * *
* cc cb cacn
i
i
i
i
The calculations presented so for synthesized in fig” and correspond to a shunt active filter control strategy for
constant instaneous supply power. This approach when applied to a three phase system balance sinusoidal voltage produces.
The sinusoidal supply current strategy must be used when voltages are distorted unbalanced and sinusoidal currents are distorted. The block diagram In fig” presents the calculations required in this case when this
approach is used the results. The partial implementation of the active filter depends the regulation of the voltage at the inverter DC-side [VDC –the capacitor voltage] as suggested in the fig”. where VRef IS the
reference value required proper operation of the active filter inverter.
5.1 DC-Link Voltage and Power Control Operation
Due to the intermittent nature of RES, the generated power is of variable nature. The dc-link plays an important role in transferring this variable power from renewable energy source to the grid. RES are represented as current sources connected to the dc-link of a grid-interfacing inverter. Fig shows the systematic representation of power transfer from the renewable energy resources to the grid via the dc-link. The current injected by renewable into dc-link at voltage level “VDC” can be given as
wherePRES is the power generated from RES.
The current flow on the other side of dc-link can be represented as,
DC LOSS G
DC inv DC
V P P V
P
I 2
wherePinv ,PG and PLOSS are total power available at grid-interfacing inverter side, active power supplied to
the grid and inverter losses, respectively. If inverter losses are negligible then
PG PRES
5.2 Control strategy for Grid connected Inverter
The control diagram of grid- interfacing inverter for a 3-phase
4-wire system is shown in Fig. 3. The fourth leg of inverter is used to compensate the neutral current of load. The main aim
of proposed approach is to regulate the power at PCC during:
1) PRES 0; 2) PRES ˂ Total load power
PL ; and 3) PRES ˂PL . While performing the power management operation, the inverter is actively controlled in such a way that it always draws/ supplies fundamental active power from/ to the grid. If the load connected to the PCC is non-linear or unbalanced or the combination of both, the given control approach also compensates the harmonics, unbalance, and neutral current.The duty ratio of inverter switches are varied in a power cycle such that the combination of load and inverter injected power appears as balanced resistive load to the grid. The regulation of dc-link voltage carries the information regarding the exchange of active power in between renewable source and grid. Thus the output of dc-link voltage regulator results in an active current(Im) The multiplication of active current component(Im)
The reference grid neutral current is set to zero, being the instantaneous sum of balanced grid currents. The grid synchronizing angle(θ) obtained from phase locked loop (PLL) is used to generate unity vector.
VI SIMULATION RESULTS
Fig.8.shows the output voltage of PV array corresponding solar irradiation it will increases at 0.025 to 0.3 voltage constant using P&O method. At the period of 0.3 to 0.0325 voltage drop occur during the load and source condition .the boost controller quickly recovers this drop and gives constant voltage.
Fig.9. shows the output power of PV is correspondingly increases with solar irradiation. Output power is increases 12kw to 37kw due to changing the temperature. When temperature is fixed at 0.12sec to 0.3sec power generation is fixed.
Fig.8. PV Output Voltage Fig.9.PV Output Power and Sola Irradiation
Fig.10. shows output voltage of PEM fuel cell corresponding to chemical reaction of the system initially generation voltage low when chemical done quickly correspondingly increase the voltage at certainly this voltage will be constant.
Fig.11.shows PEM fuel cell power corresponding to chemical reaction
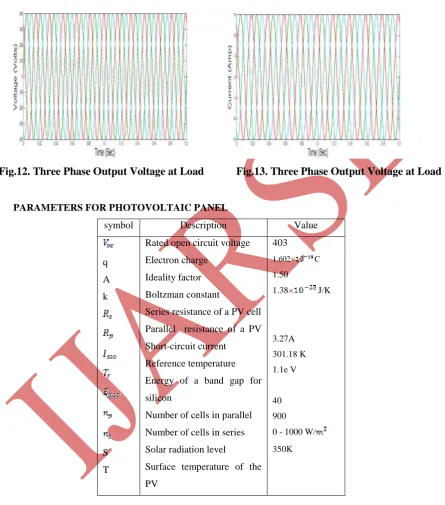
Fig.12. shows there phase voltage at load and this will be interconnected to utility grid by using the bidirectional converter it will be controlled by using p-q controller.
Fig 13. shows there phase current at load and this will be interconnected to utility grid. by using the bidirectional converter it will be controlled by using p-q controller.
Fig.12. Three Phase Output Voltage at Load Fig.13. Three Phase Output Voltage at Load
PARAMETERS FOR PHOTOVOLTAIC PANEL
symbol Description Value
q A k
S T
Rated open circuit voltage Electron charge
Ideality factor Boltzman constant
Series resistance of a PV cell Parallel resistance of a PV Short-circuit current
Reference temperature Energy of a band gap for silicon
Number of cells in parallel Number of cells in series Solar radiation level
Surface temperature of the PV
403
1.602× C
1.50
1.38× J/K
3.27A
301.18 K
1.1e V
40
900
0 - 1000 W/
350K
VII. CONCLUSION
operate the FC output in its high-efficiency performance band. With the proposed operating algorithm, the system works flexibly, exploiting maximum solar energy; PEMFC works within a high-efficiency band and, hence, improves the performance of the system’s operation. The system can maximize the generated power when load is heavy and minimizes the load shedding area. When load is light, the UPC mode is selected and, thus, the hybrid source works more stably. The changes in operating mode only occur when the load demand is
at the boundary of mode change PLoad 1; otherwise, the operating mode is either UPC mode or FFC mode.
Besides, the variation of hybrid source reference powerPMSRe f is eliminated by means of hysteresis. In addition, the number of mode changes is reduced. As a consequence, the system works more stably due to the minimization of mode changes and reference value variation.
REFERENCES
[1] R. H. Lasseter, “MicroGrids,” in Proc. IEEE Power Eng. Soc. Winter Meet., Jan. 2002, vol. 1, pp. 305–308. [2] F. Liu, S. Duan, F. Liu, B. Liu, and Y. Kang, “A variable Step size INC MPPT method for PV systems,”
IEEE Trans. Ind. Electron., vol. 55, no. 7, pp. 2622–2628, Jul.
[3] L. Piegari, R. Rizzo, "Adaptive perturb and observe algorithm for photovoltaic maximum power point tracking," Renewable Power Generation, IET, vol. 4,no.4, pp. 317-328, July 2010.
[4] T.Kerekes*,R.Teodorescu*M.Liserre**,R.Mastromauro, A. Dell’Aquila**MPPT algorithm for Voltage Controlled PV Inverters.
[5] C. Liu, B. Wu and R. Cheung advanced algorithm for Mppt control of photovoltaic systems Canadian Solar Buildings Conference Montreal, August 20-24, 2004 Refereed Paper
[6] M. D. Anderson and D. S. Carr, “Battery energy storage technologies,”Proc. IEEE, vol. 81, no. 3, pp. 475– 479, Mar. 1993.
[7] Z. M. Salameh, M. A. Casacca, and W. A. Lynch, “A mathematical model for lead acid batteries,” IEEE Trans. Energy Convers., vol. 7, no1, pp. 93–98, Mar. 1992.
[8] Non conventional energy sources by G.D. Rai.
[9] J. H. R. Enslin and P. J. M. Heskes, “Harmonic interaction between a large number of distributed power inverters and the distribution network,”IEEE Trans. Power Electron., vol. 19, no. 6, pp. 1586–1593, Nov. 2004.
[10] U. Borup, F. Blaabjerg, and P. N. Enjeti, “Sharing of nonlinear load in parallel-connected three-phas converters,” IEEE Trans. Ind. Appl., vol. 37, no. 6, pp. 1817–1823, Nov./Dec. 2001.
[11] P. Jintakosonwit, H. Fujita, H. Akagi, and S. Ogasawara, Implementation and performance of cooperative control of shunt active filters for harmonic damping throughout a power distribution system,” IEEE Trans. Ind. Appl., vol. 39, no. 2, pp. 556–564, Mar./Apr. 2003.
[12] J. P. Pinto, R. Pregitzer, L. F. C. Monteiro, and J. L. Afonso, “3-phase 4-wire shunt active power filter with renewable energy interface,” presented at the Conf. IEEE Rnewable Energy & Power Quality, Seville,
[13] F. Blaabjerg, R. Teodorescu, M. Liserre, and A. V. Timbus, “Overview of control and grid
synchronization for distributed power generation systems,” IEEE Trans. Ind. Electron., vol. 53, no. 5, pp. 1398–1409, Oct. 2006.
[14 ] J. M. Carrasco, L. G. Franquelo, J. T. Bialasiewicz, E. Galván, R. C. P. Guisado, M. Á. M. Prats, J. I. León, and N. M. Alfonso, “Powerelectronic systems for the grid integration of renewable energy sources: A survey,” IEEE Trans. Ind. Electron., vol. 53, no. 4, pp. 1002–1016, Aug. 2006.
[15 ] B. Renders, K. De Gusseme, W. R. Ryckaert, K. Stockman, L. Vandevelde, and M. H. J. Bollen, “Distributed generation for mitigating voltage dips in low-voltage distribution grids,” IEEE Trans. Power. [16] N. Mohan, T. M. Undeland, and W. P. Robbins, Power Electronics, Converters, Applications and Design,
2nd ed. New York: Wiley, 2003.
[17] R. H. Lasseter, “Microgrids,” in Proc. IEEE Power Eng. Soc. Winter Meeting, Jan. 2002, vol. 1, pp. 305– 308.
[18] R. H. Lasseter and P. Piagi, “Control and design of microgrid components,” Jan. 2006, PSERC final project reports.
[19] P. Piagi and R. H. Lasseter, “Autonomous control of micro grids,” presented at the Power IEEE Eng. Soc. General Meeting, Montreal, QC, Canada, 2006.