REGIONAL TRADE AND ECONOMIC GROWTH OF EAST AFRICA COMMUNITY STATES
JORAM MBURU MAINA
A RESEARCH PROJECT SUBMITTED TO THE DEPARTMENT OF APPLIED ECONOMICS IN PARTIAL FULFILLMENT OF THE REQUIREMENTS FOR
THE AWARD OF MASTER OF ECONOMICS (INTERNATIONAL TRADE & FINANCE) OF KENYATTA UNIVERSITY.
ii
DECLARATION
This research project is my original work and has not been submitted in any other
university for a degree award.
Signed: ... Date ...
Joram Mburu Maina
B.A.
K102/PT/12759/2009
This research project has been submitted for examination with my approval as university
supervisor:
Signed: ... Date...
Dr. Samuel Muthoga
Department of Economic Theory
School of Economics
iii
DEDICATION
This research project is dedicated to my wife Pauline for her continuous encouragement
and moral support during the period I was writing this paper and my beloved daughters
iv
ACKNOWLEDGEMENTS
To begin with, let me thank the Almighty God for giving me wisdom, knowledge and
understanding throughout my study period. My heartful thanks go to my parents Johnson
Maina and Veronica Wangari for their upbringing and supporting my education and
career path. Many thanks to all people of goodwill who have helped me complete my
studies through their prayers and resource donations. Special thanks to my supervisors,
Dr. Samuel Muthoga and the late Dr. Steve Makori for their invaluable guidance, wide
knowledge in the subject matter and ideas that made this research work complete. Last
but not least, I also wish to recognize my fellow students David Muthui, Lukas Musembi,
Kelvin Mugi and Abraham Waweru for their supportive ideas and constructive feedback
v
TABLE OF CONTENTS
DECLARATION... ii
DEDICATION ... iii
ACKNOWLEDGEMENTS ... iv
LIST OF TABLES ... viii
LIST OF FIGURES ... x
ACRONYMS AND ABBREVIATIONS ... xi
OPERATIONAL DEFINITION OF TERMS ... xiv
ABSTRACT ... xv
CHAPTER ONE... 1
INTRODUCTION ... 1
1.1 Background ……….. 1
1.1.1 Regional Integration Overview……… 1
1.1.2 East African Countries Regional Trade Integration………. 2
1.1.3 The Objectives, Challenges and Benefits of EAC Regional Trade Integration …….. 3
1.1.4 Regional Trade and Economic Performance Overview ……….. 6
1.2 Statement of the Problem ... 14
1.3 Research Questions ... 15
1.4 Research Objectives ... 15
1.5 Significance of Study ... 16
1.6 Study Scope ... 16
1.7 Study Organization ... 17
CHAPTER 2 ... 18
vi
2.1 Introduction ... 18
2.2 Theoretical Literature ... 18
2.2.1 Trade Theories ……….. 18
2.2.2 Growth Theories ……… 21
2.2.3 Relationship between Trade and Economic Growth ………. 22
2.3 Empirical Literature ... 23
2.4 Overview of Literature ... 29
CHAPTER 3 ... 30
RESEARCH METHODOLOGY ... 30
3.1 Introduction ... 30
3.2 Research Design ... 30
3.3 Theoretical Framework ... 30
3.4 Empirical Model ... 36
3.5 Definition and measurement of variables ... 37
3.6 Data Sources, Type and Refinement ... 38
3.7 Granger Causality Test ... 39
3.8 Data Analysis and interpretation of results... 39
3.8.1 Fixed Effects Model ……….. 39
3.9 Diagnostic Test ... 40
3.9.1 Panel Root Test ………. 40
3.9.2 Tests for Autocorrelation ……….. 41
CHAPTER FOUR ... 42
FINDINGS, INTERPRETATION AND DISCUSSION ... 42
4.1 Introduction ……….. 42
vii
4.3 Relationship between EAC Trade and the Region’s Economic Growth ……….. 45
4.4 Fixed effect Model Estimation ……….… 56
CHAPTER FIVE ... 61
SUMMARY, POLICY IMPLICATIONS AND RECOMMENDATIONS ... 61
5.1 Introduction ………... 61
5.2 Summary ………... 61
5.3 Conclusions ………63
5.4 Policy Implications ……… 64
5.5 Areas for Further Studies ………. 65
REFERENCES ... ... 66
viii
LIST OF TABLES
Table 1.1: EAC Trade between 2000-2013 in (US dollars) ... 8
Table 1.2: Total Trade between years 2000 and 2013 (Dollars)... 11
Table 1.3: Real GDP growth rates ... 13
Table 3.1: Table of Variables used in the Model ... 38
Table 4.1: Summary of variables and data sources ... 43
Table 4.2: Descriptive Analysis: 2001-2014 ... 44
Table 4.3: Unit root tests (ADF unit root test) ... 46
Table 4.4: Granger Causality test for Kenya ... 50
Table 4.5: Granger Causality test for Tanzania ... 52
Table 4.6: Granger Causality test for Rwanda ... 53
Table 4.7: Granger Causality test for Uganda ... 54
Table 4.8: Granger Causality test for Burundi ... 55
Table 4.9: Fixed effect Model Estimation Summary ... 57
Table A1: Johansen Cointegration Test Results for GDP per capital growth and Intra-regional Trade ... 75
Table A2: Johansen Cointegration Test Results for GDP per capital growth and Extra-regional Trade ... 76
Table A3: Johansen Cointegration Test Results for GDP per capital growth and Total Trade ... 77
Table A4: Lag selection criteria for GDP per capita growth and Intra-regional Trade .... 78
Table A5: Lag selection criteria for GDP per capita growth and Extra-regional Trade ... 79
Table A6: Lag selection criteria for GDP per capita growth and Total Trade ... 80
ix
Table A9: VAR regression model for GDP per Capita Growth and Extra-regional Trade
... 83
Table A10: VAR regression model for GDP per Capita Growth and Intra-regional Trade ... 84
Table A11: VEC for GDP per Capita Growth and Extra-regional Trade ... 85
Table A12: VAR model for GDP per capita growth and Total trade for Uganda ... 86
x
LIST OF FIGURES
xi
ACRONYMS AND ABBREVIATIONS
ADF Augmented Dickey Fuller
AGE Applied General Equilibrium
AGOA Africa Growth and Opportunities Act
AIC Akaike Information Criterion
ASEAN Association of Southeast Asian Nations
CACM Central American Common Market
CGE Computable General Equilibrium
COMESA Common Market for Eastern and Southern Africa
EAC -US TIP East Africa Community and United States of America Trade and Investment Partnership
EAC East African Community
EAC-CU East Africa Community Customs Union
EAMU East Africa Monetary Union
EC European Commission
xii
ESRF Economic and Social Research Foundation
EU European Union
FDI Foreign Direct Investment
FTA Free Trade Area
GDP Gross Domestic Product
GMM Generalized Method of Moments
GTAP Growth Trade Analysis Project
MERCOSUR Mercado Comúndel Sur (Common Market of the South)
MFN Most Favoured Nations
OECD Organisation for Economic Co-operation and Development
PTA Preferential Trade Area
RTA Regional Trade Arrangement
SADC South African Development Council
SIC Schwarz Information Criterion
SID Society for International Development
xiii
UDEAC Union Douanièreet Economique de l'Afrique Centrale
VAR Vector Auto-Regressive
xiv
OPERATIONAL DEFINITION OF TERMS
Causality: This is the existence of a relationship between two variables specifically in
cases where one variable causes some effects on another.
Steady state: Refers to a situation in which the various quantities grow at constant rates
Trade creation: Is when imports are substituted for domestic products as a result of being
a member of the same RTA as the trade partner, that is, it implies an increase in trade
between trade partners due to both joining a common RTA.
Trade diversion: This occurs after a change in the level of exports from a non-member (or
a member) importer to a member (or a non-member) due to the RTA. It can lead to
decrease or increase in trade among the RTA members.
Intra-regional trade: This refers to trade that occurs between countries within the same
geographical region.
Extra-regional trade: This refers to trade between members of a trading bloc and other
non-member countries using a Common External Tariff.
Regional Trade: This refers to trade within a trading bloc amongst its members and also
xv
ABSTRACT
1
CHAPTER ONE INTRODUCTION 1.1 Background
1.1.1 Regional Integration Overview
According to Haarlow (1997), regional integration is the process by which countries
in a specific geographical region cooperate and work together towards the attainment
of economic growth and stability. This view is supported by Lee (2003). Better
regional trade integration is achieved when member states in a trading block deepen
their trading ties through promoting free movement of goods and people along
borders, reducing trade tariffs, developing skilled human capital and avoidance of
armed conflicts between them among many other things (Davoodi, 2012).
Balassa (1961) and Jovanovic (1992) classified integration schemes into five levels
that are based on their degree of integration. A Preferential Trade Agreement (PTA) is
a trading bloc that reduces tariffs for certain goods produced by the participating
countries. According to Bhagwati and Panagariya (1993) and Grossman (1995),
member countries belonging to a Free Trade Area (FTA) agree to eliminate tariff and
non-tariff barriers amongst themselves while retaining some control over trade with
other countries not party to the agreement. With regards to Customs Union, member
countries determine jointly a tariff level among their members and agree some
uniform custom and policy during trade with other independent countries. A Common
Market has all elements in a customs union, there is free movement of goods and
people across borders although restrictions for mobility are retained against
non-member countries. According to Baldwin (1994) and Salvatore (1998) an Economic
2
than an FTA, customs union or common market. In most cases, the union coordinates
all the fiscal and monetary policies of constituent member states. The end result may
be a political union where member countries lose national sovereignty to a
supranational political authority like the envisaged European Union (EU) currently at
monetary union stage.
The benefits expected from regional integration are reduced prices of goods and
services due to a free market, increased economic welfare of society, improved trade
policies and improved productivity of workers which brings about economies of scale
due to enlargement of the market. The numerous benefits at different stages of
integration may result from either of the effects brought about by the varying degrees
of regional integration (José& Lorenzo, 2012).
1.1.2 East African Countries Regional Trade Integration
The earliest form of regional integration arrangements in East Africa was a customs
union which took place in 1917 involving Kenya, Tanzania and Uganda. The
members signed a division of assets and liabilities agreement in 1984 after dissolution
of the former EAC in 1977 (Deya, 2007).
A Permanent Tripartite Commission of East Africa was then formed in November
1993 to focus on the regional cooperation aspects. This commission would later
become the policy-making organ of Kenya, Uganda and Tanzania union. On 14th
March 1996 a Secretariat of the Permanent Tripartite Commission was established and with its headquarters located in Arusha Tanzania (Ndung’u, 2000). Following the
need to guard regional cooperation, plans were then established with the view of
3
engagement and public participation, the EAC establishment agreement was signed on 30th November 1999 in Arusha, Tanzania (Ndung’u, 2000). The treaty became
enforced on 7th July 2000 following completion of its ratification procedure. On 2nd
March 2004, EAC Summit agreed to establish a customs union which later became
operational on 1st January 2005. In the year 2007 the EAC treaty was signed by two
more members i.e. Rwanda and Burundi. The two new members would later join the
EAC Customs union on 1st July 2009. The EAC Common Market Protocol was then
enforced after all member states ratified the same in July 2010. Currently, there is an
ongoing discussion towards the formation of a monetary union which is expected to
strengthen the economies of all member states, assist them adapt to global concerns
such as climate change and take advantage of all trade opportunities in the global
arena SID, (2011).
1.1.3 The Objectives, Challenges and Benefits of EAC Regional Trade Integration
The EAC treaty spells out that the community shall pursue all available measures of
fostering integration across a number of priority sectors such as research and
development, defense, political and economic affairs among others. As defined in the
Article 5 paragraph 2 of EAC Treaty (2002), the member countries agreed to create in
phases a Customs Union and then progress to other high levels of integration with a
political Federation being the ultimate aim. This was aimed at strengthening industrial
cooperation, increase infrastructural developments and increase socio-cultural
4
The establishment of a new EAC emanated from various concerns such as the desire
for industrialization, need to reduce unemployment, achievement of high economic output, reduction of economic debts and the need to reduce poverty levels (Ndung’u,
2000). In addition, there was poor infrastructure, lack of macroeconomic stability,
poor health and education indicators and little technological readiness which
challenges could be tackled with the revival of EAC (Hartzenberg, 2011). According
to the World Economic Forum 2010, key hindrances to business in the EAC region
include limited access to finance, high levels of corruption, excessive taxation, and
slow infrastructural development. Generally, the problems facing the East African
Community can be categorized into four categories namely economic, political social
and financial struggles (Kamala, 2006). The Common Market of the region also faces
a number of challenges. Firstly, the market has been unable to equally balance all
benefits achieved among all the member states. There has been discontentment among
some countries which feel that their counterparts enjoy the greater share of benefits.
Secondly, the common market has faced serious challenges in generating constant
benefits for itself. This has been mainly due to the existence of bigger regional trade
blocs which divert trade benefits to other parts of the African continent. Moreover, the
EAC Common market faces a lot of uncertainty with regards to the best approach to
be used in transforming the common market into a monetary union. Finally, the
market is still looking for ways of advancing the existing common market and
customs union (Davoodi, 2012).
Since inception, the East African Community has achieved a number of benefits. For
instance, the community has registered increased trade among its member states by
5
increased tremendously as compared to the years before. Further, the EAC member
states now boast of reduced inflation levels brought about by the influence of the
collective economic policies that have been put in place (EAC; Mwapachu, 2011).
There have been recent achievements made in EAC regional integration according to
EAC Trade report 2013. For instance, to deepen customs union, the Single Customs
Territory was rolled out in 2014. To deepen trade integration particularly
intra-regional trade, there has been significant reduction of Non-Tariff barriers with the
EAC legislation passed recently to effectively remove non-tariff barriers paving the
way for the creation of 15 one stop border posts on the member states common
borders and revising rules of origin. Other measures taken to boost regional trade are
signing of tripartite trade agreements with other trade blocks like COMESA and
SADC, EAC-EU-EPA negotiations making substantial progress and export promotion
activities like AGOA and EAC-US Trade and Investment Partnership (TIP) with US
gaining momentum. The State of East Africa 2013 Report shows that the value of
regional trade increased from $1 billion to $ 5 billion between the years 2010 and
2012. In addition, the region recorded high imports values that even were in excess of
double the value of exports realized. The top five imports and exports value stood at
$18 billion and $7 billion respectively.
The attainment of a GDP growth of 7% as a minimum target annually will enable East
Africa meet one of the criteria for macroeconomic convergence in fiscal and monetary
harmonization of East Africa (Fondad, 2005). According to the EAC Development
and Growth Strategy (2016) the attainment of macroeconomic stability is a key focus
6
economic growth such as low inflation rates and high national savings rates have not
yet been achieved as set out during the 3rd EAC Development Strategy (2006-2010).
The 4th EAC Development Strategy notes that cross-border trade clearance delays,
lack of automated systems, bureaucracy and general lack of cooperation have been
serious challenges to effective trade and by extension economic development of the
region. Such problems have given East African countries poor trade logistics as per
the World Bank ease of doing business report of 2010.
It is clear that there is an increase in imports from outside EAC and low intra-regional
trade in EAC. Also, another concern is that, since trade has grown but food imports
has dominated imports from outside the region, it might be regional integration could
have led to more trade diversion than trade creation in some sectors. Therefore, there
is need to study the trade patterns, study trends in imports and exports and analyze the
factors that are behind the performance in regional trade and assess the contribution on
the variable of importance; economic growth.
1.1.4 Regional Trade and Economic Performance Overview
It is possible to analyze the performance of regional trade integration of EAC from
various macroeconomic indicators and compare the individual member countries
economic characteristics.
According to the Fourth EAC Development Strategy (2011-12 to 2015-16), the East
African Community aims at achieving high levels of economic growth among all its
member states characterized by high levels of cooperation. This study can analyze the
7
ascertain whether the enhanced trade has also contributed to greater economic growth
and by what extent. As depicted in Table 1.1 below on intra-EAC trade, intra-EAC
regional trade performance is growing.
The volume of intra-EAC total trade has been growing though not consistently, with
the period 2011 to 2012 recording a high growth of between 20% and 21% according
to EAC Trade Report. All the member countries recorded an increase in total
Intra-EAC trade in 2013 apart from Kenya.
The value of total regional imports dropped to 2,107 US dollars from 2,315.7 US
dollars between the years 2012 and 2013 while trade value between EAC countries
and other non-member states shifted from 3,155 US dollars to 3,698 US dollars in the
same period. Plotting a graph may provide insight into the trend of member countries
intra-EAC trade for the period under study. See below Figure 1.1 on Intra-EAC
Imports.
The volume of intra-EAC imports has been growing steadily in all the EAC countries
but declined for the period 2012 and 2013. Some of the reasons attributed to this are
the pressure on the local currencies due to the growing import bill outside the region
where the five leading exports cannot meet half the value of five leading imports in
the region.
Also, the countries lowered the external common external tariff on some commodities
hence could have resulted in import substitution from outside the region like for
8
Table 1.1: EAC Trade between 2000-2013 in (US dollars)
20 00 200 1 200 2 200 3 200 4 200 5 200 6 200 7 200 8 200 9 201 0 201 1 201 2 201 3 Imports Uganda 28
8.6 415 .0 414 .9 416 .3 551. 5
449 560. 6
617. 4
570. 6
547 576. 5 692. 6 646. 9 616. 6 Tanzani a 107 .8 97. 9 124 .2 137. 8 160. 5 175. 5 110. 1 205. 0 316. 9 295. 9 378. 1 678. 6 397
Kenya 1 8.5 17. 0 19. 1 31. 7
38.4 61.5 84.1 191. 6 182. 0 162. 5 256. 8 302. 9 365. 1 334. 5 Burundi - - - - 54.1 59.1 60.9 79.5 86.5 88.2 77.2 160.
8
168. 1
346. 4 Rwanda 11
0.0 105 .9 74. 6 80. 7
68.9 99.1 143. 4 207. 1 299. 8 363. 5 344. 6 385. 1 457. 8 412. 5 Total 41
7.1 645 .7 606 .5 652 .9 850. 7 829. 2 1,02 4.5 1,20 5.7 1,34 3.9 1,47 8.00 1,55 1.00 1,91 9.50 2,31 6.50 2,10 7.00 Exports Uganda 87.
2
86 114 .7
132 144. 7 296. 3 476. 9 654. 7 377. 4 398. 8 428. 6 503. 7 580. 3 627. 4 Tanzani a 58. 6 57. 1 102 .4 123. 8 128. 9 157. 8 205. 9 310. 5
285 394. 3
409 613. 3
1,11 8.00 Kenya 44
8.6 6 22. 5 667 .2 71 0.5 810. 1 974 .3 735 .8 952. 2 1,03 6.60 1,16 7.20 1,27 8.7 1,54 4.40 1,59 6.40 1,45 1.0 Burundi 5.4 4.0 5.5 5.3 18.1 20.2 18.6 28.3 24.9 35.1
9 Rwanda 2
3.9 16 4.2 35. 1 29. 0 25. 0 34. 9 33. 0 40. 0
37.9 93.2 50.4 81.2 343. 5
467
Total 55 9.7 93 1.3 87 4.1 97 3.9 1,1 09 1,4 38.4 1,4 09 1,85 8.1 1,78 0.50 1,96 4.40 2,17 0.60 2,56 6.60 3,15 8.40 3,69 8.59 Total EAC Trade Value
Uganda 37 5.8 50 1 52 9.6 54 8.3 696 .2 745 .3 103 7.5 1,2 72.1
948 945. 8 1,00 5.10 1,19 6.30 1,22 7.20 1,24 4.00 Tanzani a 16 6.4 15 5.0 22 6.6 261 .6 289 .4 333 .3 316 .0 515. 5 601. 9 690. 2 787. 1 1,29 1.90 1,51 5.00 Kenya 46
7.1 63 9.5 68 6.3 74 2.2 848 .5 1,03 5.8 819 .9 1,1 43.8 1,21 7.60 1,33 2.00 1,53 6.80 1,84 7.20 1,95 7.30 1,78 5.50 Burundi 59.
5 63. 1 66. 4 84. 8 104. 6 108. 4
95.8 189. 1
193 381. 6 Rwanda 13
3.9 27 0.1 10 9.7 10 9.7 93. 9 134 .0 176 .4 247 .1 337. 7 456. 6
395 466. 2
801. 3
879. 5 Total 97
6.8 1,5 77 1,4 80. 6 1,6 26. 8 1,9 59.7 2,2 67.6 2,4 33.5 3,0 63.8 3,12 4.40 3,44 2.40 3,72 1.60 4,48 6.10 5,47 0.90 5,80 5.59
9
Figure 1.1: Intra-EAC Imports, 2000-2013 (US$ Million)
Likewise, a graph can be plotted to check the trend of Intra-EAC exports over the
years. See Figure 1.2 below
Figure 1.2: Intra-EAC Exports, 2000-2013 (US$ Million)
The graph above shows a steady growth in Intra-EAC exports over the period 2000 to
2011 for some countries while others have stagnated over the same period. The
growth can be attributed to the EAC establishment treaty signed in 2000 and signing
of the treaty for a Customs Union in 2004, the expansion of the market when Rwanda
and Burundi joined in 2009 and eventually the signing of the common market protocol
in 2011 liberalizing the regional market. The recession in the European Euro Zone in 0.00
100.00 200.00 300.00 400.00 500.00 600.00 700.00 800.00
Uganda Tanzania Kenya Burundi Rwanda
0.00 200.00 400.00 600.00 800.00 1,000.00 1,200.00 1,400.00 1,600.00 1,800.00
10
2012/13 could have contributed if what is exported within the region is for
manufacture for export market. From 2012 to 2013 there is decline for Kenya whereas
Tanzania and Rwanda have increased significantly their exports to EAC partner states.
Kenya held general election in the first quarter of 2013 and the wait and see attitude of
many producers then could have impacted negatively. In addition, there was reduction
of mineral fuels exports as a result of oil refinery closure in Mombasa. Tanzania and
Rwanda recorded a significant increase in exports to Kenya.
Plotting a graph in total trade (Intra-EAC exports plus Intra-EAC imports) reveals that
Intra-EAC imports and Intra-EAC exports show a similar trend. See Figure 1.3 below.
Figure 1.3: Intra-EAC Total Trade, 2000-2013 (US$ Million)
From figure 1.3 above, volume of trade has been increasing steadily during the period
2000 to 2011. Thereafter, Uganda and Kenya recorded a decline in 2013. Rwanda,
Burundi and Tanzania have recorded a tremendous increase during the period 2012
and 2013. The possible reasons can be associated with import and exports patterns
explained above. 0.00
500.00 1,000.00 1,500.00 2,000.00 2,500.00
11
Table 1.2 below shows the trade volumes between intra-regional and extra-regional
trade for EAC.
Table 1.2: Total Trade between years 2000 and 2013 (Dollars)
Years 200 0 200 1 200 2 200 3 200 4 200 5 200 6 200 7 200 8 200 9 201 0 201 1 201 2 201 3 Total intra-EAC Trade 976. 80 1,57 7.00 1,48 0.60 1,62 6.80 1,95 9.70 2,26 7.60 2,43 3.50 3,06 3.80 3,12 4.40 3,44 2.40 3,72 1.60 4,48 6.10 5,47 0.90 5,80 5.59 Total extra-EAC Trade 7,82 6.22 8,05 7.53 8,07 7.37 9,77 3.93 11,8 50.8 8 15,1 30.8 0 18,1 00.7 7 23,2 56.4 8 30,3 09.7 7 27,4 81.8 5 32,9 03.0 4 41,3 04.1 5 43,6 00.3 7 43,4 82.5 7 Total EAC Trade 8,80 3.02 9,63 4.53 9,55 7.97 11,4 00.7 3 13,8 10.5 8 17,3 98.4 0 20,5 34.2 7 26,3 20.2 8 33,4 34.1 7 30,9 24.2 5 36,6 24.6 4 45,7 90.2 5 49,0 71.2 7 49,2 88.1 6
To have a comparison of intra-EAC total trade and extra-EAC trade plot a graph
below to show the trend.
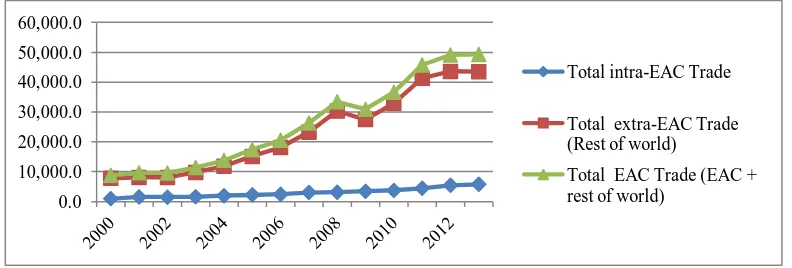
Figure 1.4: Intra-EAC Total Trade and Extra-EAC Total Trade 2000-2013 (US$ Million)
The figure above depicts that the extra-regional trade forms the bulk of the total trade
and increased more than intra-regional trade during the periods 2004 to 2008 and 2009
to 2012.
This can be illustrated in figure 1.5 below more clearly by comparing the percentages
of intra and extra regional trade to total trade. 0.0 10,000.0 20,000.0 30,000.0 40,000.0 50,000.0 60,000.0
Total intra-EAC Trade
Total extra-EAC Trade (Rest of world)
12
Figure 1.5: Percentage of Intra-EAC Trade and Extra-EAC Trade to Total Trade
The figure above shows that the percentage of Intra-EAC Trade to Total Trade ranges
between 9.3% and 16.4% while percentage of Extra-EAC Trade to Total Trade has
ranged between 83.6% and 90.7% during the period 2000 to 2013. Both extra-regional
trade and intra-regional trade stagnated at about 11% and 88% respectively.
The study can focus on the trend of other variable of interest which is economic
growth. Table 1.3 below shows the economic growth performance of the EAC
member countries since 2000. For instance, in the year 2013, Tanzania had the highest
growth rate with Kenya and Burundi following closely. Kenya had a high per capita
income compared to other countries while Burundi was the last in this category (EAC
2014). However, in the last 5 years Rwanda has been leading with an economic
growth as can be illustrated in the table below.
The data below shows that there has been a varying GDP growth rate among the EAC
member states. Rwanda and Uganda have performed well on average while Kenya
and Burundi have been trailing behind. 0.0%
10.0% 20.0% 30.0% 40.0% 50.0% 60.0% 70.0% 80.0% 90.0% 100.0%
% of Intra-EAC Trade to Total Trade
13
Table 1.3: Real GDP growth rates
Partner State 2000 20012002 2003 2004 2005 2006 2007 2008 2009 2010 2011 2012 2013
Burundi (0.9) 2.1 4.5 (1.2) 4.8 0.9 5.4 3.5 4.9 3.8 5.1 4.2 4.2 4.8
Tanzania 4.9 6.0 7.2 6.9 7.8 7.4 6.7 7.1 7.4 6.0 7.0 6.4 6.9 7.0
Uganda, 2002=100 4.4 6.5 4.7 6.2 5.8 10.0 7.0 8.1 10.4 4.1 6.2 6.2 6.9 5.8
Kenya 0.6 4.5 0.6 2.8 4.9 5.7 6.1 7.0 1.5 2.7 5.8 4.4 4.6 4.7
Rwanda, 2006=100 6.0 9.7 11.0 0.3 5.3 7.2 6.5 7.9 11.2 6.2 7.2 8.2 8.0 4.6
Source: EAC Macroeconomic Statistics – 2014)
This is reflected in the graphical representation in Figure 1.6 below.
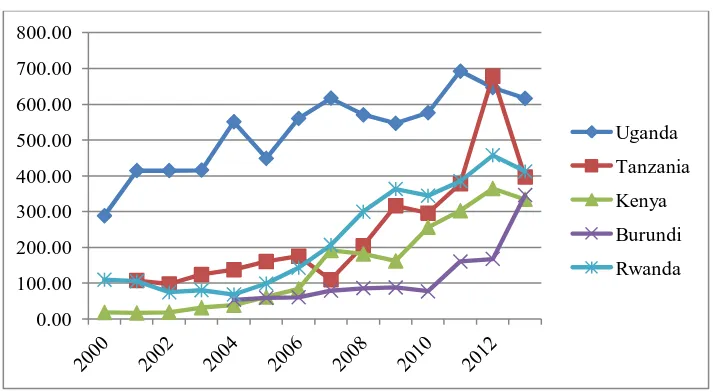
Figure 1.6; Growth Rate for East African states by year
Source: Constructed from Table 1.3 above - Real GDP growth rates -2
0 2 4 6 8 10 12
14
The graph above shows the countries have had differing trends at different times.
Tanzania has been having a more stable growth pattern while Burundi has had the
most erratic growth pattern in the beginning but normalizes from 2011. Rwanda
recorded high growth between 2000 and 2002 before recoding a significant decline in
2003. Thereafter, Rwanda recoded impressive growth until 2008 and has been on a
downward trend since then. Kenya recorded significant decline in 2003 and worse
decline in 2008 mainly attributed to the post-election violence. The decline in 2009 in
all EAC countries was instigated by high fuel prices and the global financial crisis among other factors such as Kenya’s struggle with the effects of post-election
violence. Uganda has been recording a steady growth apart from 2009. However, from 2010 to 2013, the individual countries’ growth rates have been showing a slowdown
with a declining trend yet over this period trade has grown tremendously in most
countries.
1.2 Statement of the Problem
While total intra-regional trade shows an increasing trend over the period between
2002 and 2013 for the EAC member countries, the extra-regional trade seems to be
growing faster yet their proportions to total trade shows they are almost constant.
Economic growth on the other hand has not been consistent as it has been varying
over the years more than would be expected. Intra-regional trade is expected to drive
the economic growth of the East African countries but its proportion relative to total
trade is ranked the lowest among other RTAs like EU, NAFTA and SADC (Ouma,
15
One of the provisions to increase the EAC intra-trade leading to the formation of the
EAC is Article 75 of the Treaty and the Customs Union (CU) Protocol. It provides a
number of elements which include (i) elimination of internal tariffs and other charges
of equivalent effect (ii) elimination of non-tariff barriers; (iii) establishment of a
Common External Tariff (CET); (iv) duty drawback, refund and remission of duties
and taxes, among others. It was anticipated that implementation of these provisions
would increase the value and volume of trade within the EAC (Shinyekwa S. &
Othieno L., 2013).
GDP growth rate analysis shows a major disconnect between deepening integration
and achievement of growth within a common market stage. Thus there is need to find
out why economic growth has dwindled yet major strides have been experienced
especially in recent years following integration efforts. Therefore, one may ask
whether economic growth is influenced by regional integration.
1.3 Research Questions
i. What is the relationship between regional trade of EAC states and economic
growth?
ii. What is the contribution of extra-regional and intra-regional trade in economic
growth of EAC states?
1.4 Research Objectives
i. To establish the relationship between regional trade of EAC states and
16
ii. To establish the influence of regional trade by comparing the contribution of
extra-regional and intra-regional trade on economic growth in EAC states.
1.5 Significance of Study
This research has established the contribution of the EAC trade integration to regional
economic growth and establishes whether or not the regional integration has increased
trade among its constituent member states. Various factors that either enhance or
inhibit regional trade have also been identified and the specific measures that need to
be adopted by policy makers towards generating more benefits for all parties have
been outlined.
No studies have been done explicitly to compare the differential impacts of
intra-regional and extra-intra-regional trade on the growth of GDP in RTAs in African countries
especially EAC member countries. Therefore, this study has made a contribution in
closing that research gap.
1.6 Study Scope
This research lays its primary focus on economic growth with regard to regional
integration among the EAC member states. The EAC member countries included here
are Kenya, Uganda, Tanzania, Rwanda and Burundi. The period of the study is from
2001 when EAC was reborn to 2014 based on availability of secondary data.
Macro-economic variables affecting regional integration and Macro-economic growth have been
taken into account and a model developed using measurable variables. This study
relied on secondary data from published data sources. These published sources include
EAC Macroeconomic statistics (2014), East African Community Facts and Figures
17
The study borrowed from works of other researchers without duplicating their work
and possibly addresses various concerns not outlined in previous researches.
1.7 Study Organization
The research is arranged into five chapters. The first chapter outlines the background
details of this study, objectives to be achieved and the statement of the problem.
Chapter two gives a review of key literature relevant to this study in both empirical
and theoretical aspects. The research methodology and design are then explained in
the third chapter. Chapter four deals with analysis of the data collected while chapter
five gives the findings, summary, study review and recommendations that arise from
18
CHAPTER 2 LITERATURE REVIEW 2.1 Introduction
This section reviewed existing literature from previous research which expound more
on regional trade and integration. Theoretical literature analyzes theories on regional
integration, economic growth and trade liberalization. The theoretical models used to
explain the said concerns are discussed with a view of giving crucial hints necessary
in understanding more about regional integration and economic growth in East Africa.
Empirical literature review centers on previous research findings and the methodology
that was used in establishing certain facts about the variables of concern.
2.2 Theoretical Literature
2.2.1 Trade Theories
There exist several theories that major their concerns on the subject of international
trade. These include the comparative advantage theory, absolute advantage theory,
factor proportions theory and new trade theory among others (Ranzau, 2009). Thus
these theories can be used as reference points in advancing arguments for or against
regional trade integration.
However, only two theories on international trade can be used to explain regional
integration. These are the Customs Union theory of trade creation and the Ricardian
theory of comparative advantage. Regional integration borrows heavily from these
two theories thus making them key points of reference.
2.2.1.1 Comparative Advantage Theory
The comparative advantage theory encourages countries to produce goods with low
19
argues that countries should channel their resources in production of goods where they
are more efficient and import where they are less efficient. This theory therefore
suggests that economic agents should compare opportunity costs involved in the
production of goods across countries rather than the monetary costs involved (Ranzau,
2009). The EAC member countries primarily deal with the same products i.e.
agricultural goods and import mainly machinery from developed countries since they
have same resource endowments. Thus, comparative advantage theory would not
adequately address intra-regional trade due to limited efficiency gains which could
lead to trade diversion.
2.2.1.2 The Customs Union Theory
On the other hand, the Customs Union theory as advanced by Jacob Viner (1950)
argues tariffs on trade between member states of a customs union should be lowered,
and a joint tariff be imposed on all imports from non-member states. This then results
in two outcomes namely trade creation and trade diversion. Trade creation occurs
when economic agents shift from domestic production with high costs to low cost
production in other member states within the customs union. Trade diversion then
occurs in cases where member states have to shift from low-cost external production
to high-cost production among member states of the customs union. Therefore, trade
creation improves welfare and the complete opposite happens in the case of trade
diversion.
2.2.1.3 The Modern Theories of Trade
Gravity model and the CGE (Computable General Equilibrium) model are also used
20
The Gravity model has managed to predict trade patterns for goods and services
between various countries. It argues that trade arrangements between two countries
occur as a result of the respective sizes of the two economies involved and the
distance between them. A gravity relationship, therefore, occurs in the sense that trade
costs increase with the distance between the two countries involved in trade. This
theory has been instrumental in the identification of the drivers behind mutual trade
flows e.g. common currencies and common borders. Many economic policies have
been formulated based on the use of gravity models which are very popular due to
their suitability in making empirical conclusions (H.L. David, 2007). However,
standard gravity factors address only two-thirds of the global trade (Ciuriak and Kinjo,
n.d). Thus, this makes the gravity theory unattractive for the one-third of the global
trade which may be relevant for this study.
The Computable General Equilibrium models also called the AGE (Applied General
Equilibrium) models are economic models used to estimate how economies of
countries involved in trade agreements can adjust to changes in technology and other
external factors that affect trade. CGE models borrow from input-output models,
models for planning for developing countries and also models used in economic
planning for richer countries. They assist policymakers to detect the economic impacts
of a change of one section of the economy upon the rest. Currently, one of the most
popular CGE models is the GTAP model of world trade which has been used in many
countries in economic growth planning. Such models are instrumental in economic
planning especially in instances where the relevant economies lack reliable data used
in analysis. General equilibrium models have been used in some literature reviews to
21
laid strict emphasis on macroeconomic factors that predict income gains in the context
of economies under integration agreements. However, some economists still insist that
regional integration impedes growth to a reasonable extent through trade diversion
(Grossman & Helpman, 1997).
2.2.2 Growth Theories
Endogenous growth theory and the Solow model are perfect economic models that
relate to international trade liberalization.
2.2.2.1 Neoclassical Growth Theories
The Solow model argues that long-term economic growth in any economy can only be
achieved through technological progress (Solow 1956). The theory further states that
poor countries can only catch up with other rich countries if the savings rate for
human capital and physical capital are the same.
According to the neoclassical growth theory, steady economic growth can only be
attained through a proper balance of the amounts of capital and labor in the production
technology in use (Njoroge, 2010). This means growth is achieved through exogenous
technological progress and labor increase. However, other economic theories have
argued that growth is driven by knowledge accumulation thus making technological
progress an exogenous variable and not exogenous as implied by earlier economists.
2.2.2.2 Endogenous Growth Theory
The Endogenous growth theory postulates that economic growth is determined by
endogenous factors within an economy rather than exogenous factors. The theory,
therefore, encourages economies to embrace competitive and innovative economic
22
2.2.3 Relationship between Trade and Economic Growth
Economic growth is affected by trade in a number of ways. To begin with, exchange
of knowledge in research and development issues occurs as a result of trade. In this
way, new innovations are shared among trading partners and this eventually leads to
economic growth (Barro, 2007).
Secondly, competition increases in the local market due to higher trade openness
thereby improving on productivity and which results to growth (Waziarg, 2004).
Dollar and Kraay, (2003) argue that countries with more trade flows with a high
degree of market liberalization tend to register high growth rates evidenced in their
high GDP per capita. Counter arguments to that view have however been raised by
some scholars who hold the view that market openness adversely affects economic
growth through erosion of competitive advantage, abuse of comparative advantage
and exposure to increased competition among other reasons. Some confusing results
have also risen from previous research. For example, membership of the European
Union was found to have no growth effects on constituent member states Landau,
(1996). In some other research, Henrickson established that membership in the same
union produced a long-term growth force ranging between 0.6 percent and 1.3 percent
per annum. Such significant differences have however been attributed to the poor
correlation between market liberalization process and the variables of concern.
Thirdly, many countries have experienced increased economic growth as a result of
trade widening of markets for their goods. On the contrary, economies restricted to
smaller markets have continued to register small economic growth rates (Alcala,
23
Fourthly, participation in international trade allows countries to adopt prudent
economic policies that cater for internal interests. These policies are founded on stable
macroeconomic foundations that allow the accumulation and increase of various
factors of production e.g. capital within an economy. In the long run, these economies
achieve high levels of growth which can only be traced back to engagement in
international trade agreements. Generally, increased exposure to trade serves as a
good catalyst of growth as evidenced in a number of economies. This view is further
supported by Aryeetey and Oduro (1996), Lyakurwa (1997) and Gunning (2001) who
attribute the rising economic growth rate of many countries in Africa to the existence
of strong regional trade agreements being experienced in the continent and which
thrive on a stable foundation of trade reforms and sound policies.
Integration helps countries achieve many benefits. For instance, agreements for
regional integration widens up markets for goods and services thus allowing
companies and industries to access a bigger market. Such arrangements enable
economies to take advantage of economies of scale thereby leading to accelerated
growth. Integration also accelerates trade across inter-country borders with the result
being increased monetary gains to the countries involved (Abraham Knife, 2005).
However, economic theory has not been able to determine whether the economic
benefits of integration are short term or can be sustained in the long term. This,
therefore, leaves a gap that requires empirical work to ascertain the truth of the matter.
2.3 Empirical Literature
While analyzing UDEAC, EU, CACM and ASEAN trade blocs, Vamvakidis (1998)
established that the EU registered some improved trade among its member countries
24
He, therefore, concluded that engagement in regional trade stimulated economic
growth in many countries and that varying rates of growth among countries in the
same trade bloc has no effect on the level of growth in any economy.
Frankel and Romer (1999) in the study ‘Does Trade Cause Growth?’ covered 150
countries in the penn World Table. The study estimated cross-country regressions of
income per person on international trade and country size suing instrumental variables
and compared the results with ordinary least squares (OLS) estimates from the same
equation. The study established that regional trade and income are positively
connected in that as trade increases the level of GDP, the income received by an
individual person in that economy also increases. This happens through the
accumulation of factor inputs such as human and physical capital.
Bassanini et al (2001) in the study “Economic Growth: The Role of Policies and
Institutions” used cross-country time-series regressions on OECD countries for the
period 1971 to 1998. The study aimed at establishing links between policy settings,
institutions and economic growth in OECD countries. According to this study, the
growth experienced in many developing countries in the past decades has been as a
result of human capital improvements. This has also been the case in other developed
nations such as Netherlands and Germany. The study established that accumulation of
factors of production in an economy was a key determinant of growth. Further, the
study pointed out that with increase in human and physical capital levels any economy
was destined to determine a considerable amount of growth.
The Global Economic Prospects report of 2005 showed that countries within trade
25
independently. Trade volumes were also noted to increase faster than economic
growth in the international arena for countries within trade agreements. Such
outcomes, therefore, prove that regional integration cannot be ignored in its role of
accelerating economic growth. International trade by way of easing the flow of
resources across borders and opening up of new markets ends up increasing growth. It
also reduces the cost of production as countries within the same regional trade
agreement access wider market with minimal transaction costs.
Innwon (2006) postulated that the East Asian Regional Trade Agreement would
positively impact the welfare of its member countries. The study used a CGE model to
evaluate the impact of various variables on growth and realized that regionalism
enhanced growth over time especially in cases where the trade agreement adopts an
expansionary policy whereby members cooperate with each other. This would not be
achieved in the event the countries competed with each other. Also, higher economic
and welfare gains were seen to accrue to original members of all regional trade
agreements. Further, additional trade benefits were seen to accrue for original
members despite all gains being unevenly distributed across the regional trade
arrangements.
Wooster (2007) conducted a study investigating the impacts of regional trade on
economic growth among European countries. The study focused on thirteen European
Union member countries and employed time-series regressions to analyze
inter-country data. The study found out that liberalization of trade was an important
stimulator of growth alongside population growth and Investment growth. Moreover,
it concluded that trade between members of the European Union with other
26
countries in all the countries that were under consideration. The study used real
economic variables in the study and was successful in distinguishing growth effects
arising from intra-regional trade from those of extra-regional trade. The study revealed
that extra-regional trade was more beneficial to an economy than trade among
members of one trade bloc. The study concluded that increased exposure to wider
markets witnessed when a country traded with members outside its trade bloc gave
that specific country a competitive advantage in terms of trade and this ended up
translating into higher growth rates. The competitive edge came about from the
tapping of new knowledge and skills from a variety of regions with such exchanges
only possible by way of extra-regional trade. This study borrows on the approach
where regional trade was split into the two identified categories in order to assess the
contribution of each to economic growth.
Willem (2008) researched about how convergence and growth come about as a result
of regional integration. He used standard growth models tested and proven true in
nearly 100 developing countries from Africa, Latin America and Asia for the period
1970 to 2004. His study failed to conclude whether regional integration results to
permanent economic growth effects. The study, however, did indicate that foreign
direct investments and trade promote growth to a vast extent. As such, since regional
integration increases the levels of foreign direct investments and trade, the study noted
that regional integration indirectly promoted the economic growth of many countries.
Reduction of intra-regional tariffs by lowering the price of imported goods from the
region leads to increased trade which in turn sets the conditions for growth. However,
the reduction achieves minimal impacts if the degree of trade between members of the
27
of income disparities among nations in the same trade arrangement. Integration also
helps countries to approach infrastructural projects that are key contributors to
economic growth in a bipartisan way that reduces costs and enhances efficiency of the
whole process. The study proposed further growth analytical work to be undertaken
which combines the development of methods to examine the effects of regions and
measurement of the various types of regional integration.
Empirical evidence sourced from SADC, COMESA and the EAC trade blocs on a
study about how regional integration impacts economic growth showed that the
relationship between the two main variables of interest can only originate from the
production function Njoroge (2010). In this study, a regional integration index was
constructed using the average tariff rates between countries in trade blocs and the
degree of cooperation in existence covering the period 1970 to 2008. The economic
index helped capture trade reforms within individual member states that came about as
a result of the integration. The index then captured trade reforms instituted by the
regional trade blocs as a whole towards the rest of the world. The study further
constructed a classification scheme combining tariff reduction measures on imports
necessary for deepening the cooperation among the countries involved. The analysis
of the study provided some alternative policy combinations that can be employed by
individual member countries within the selected regional trade blocs towards the
achievement of economic growth. Njoroge (2010) established a positive correlation
between economic growth and regional integration. The study confirmed that both
trade and economic integration have a positive impact on growth whether analyzed
28
for the comparison of the degree of integration across trade blocs and therefore does
not suit the study of a single regional block like is the case with this study.
Another study was carried out in Asia to ascertain the impact of both intra-regional
and extra-regional trade on the economic growth of nations. The study by Younes
(2010) assessed whether trade among member countries (intra-regional trade)
contributed more to output growth than trade with nonmember countries
(extra-regional trade) in thirteen Arab countries for the period 1990 to 2007. The study used
a standard growth model with trade intensities as focus variables besides running
granger causality tests for the trade-growth relationship. The empirical results
established that intra-regional trade was better in encouraging growth than
extra-regional trade.
Ouma (2015), in this study “Agricultural Trade and Economic Growth In East African
Community, 2000 – 2012” investigated the causes of intra-EAC agricultural sector
trade and cooperation, effect of EAC regional trade agreement on the regions
agricultural trade by analyzing the degree of trade creation and diversion effects. The
study decomposed trade and concentrated on agricultural trade. It employed panel data
approach using data between 2000 and 2012. Different panels for all the five EAC
countries were formed. The study applied the Pseudo Poisson Maximum Likelihood
which is considered relatively new and superior approach of estimation to gravity
model though it has not been applied in any earlier study in the region, and used the
bootstrap method to correct for heteroskedasticity. The study established that the
causes of intra-EAC agricultural exports, the effect of EAC regional agreement on the region’s agricultural exports, and the underlying connection between the agricultural
29
determinants of bilateral trade proposed by the modern theories of trade do have
different effects on trade volumes in different nations. The study confirmed a positive
correlation between increased agricultural exports and economic growth in some
countries, no correlation in others and still negative correlation in few others.
Agricultural exports also have a positive effect, no effect and negative impacts on
growth in different countries. This study is different from Ouma (2015) in that it used
aggregate trade but decomposed it into extra-regional and intra-regional trade.
However, it borrows from Ouma (2015) panel data approach with data between 2001
and 2014. The study then adopts standard neoclassical models to determine the
existing relationships between the variables of interest.
2.4 Overview of Literature
This research was intended to establish the contribution of regional trade on the
economic growth of the EAC member states.
This study borrowed from the works of Wooster (2007) and Younes (2010) by using
real economic variables and splitting regional trade into intra-regional and
extra-regional trade in achieving the study objectives. Their study covered European and
Arab countries respectively while this study took to East Africa Community to
establish the link between regional trade and economic growth. It borrowed on
Bassanis (2001) by incorporating human capital as a key factor of production.
This study applied panel data approach as used in Ouma (2015) but did not segregate
30
CHAPTER 3
RESEARCH METHODOLOGY 3.1 Introduction
This chapter presents the methodology that was employed in this study. It entails the
research design, theoretical framework, empirical model, definition and measurement
of variables, data sources and data analysis.
3.2 Research Design
This research sought to unravel the impacts of trade within a regional setup on the
economic growth of countries within East Africa. The research design is
non-experimental panel study. The research used data recorded between years 2001 and
2014. The collected data was analyzed using cross-country time-series regressions
after undergoing time series property tests. Panel data analysis was adopted in this
study because of the sample size and the data used is cross-sectional. Besides, the
econometric analysis allows short-term adjustments and convergence speeds to vary
across countries while imposing (and testing) restrictions only on long-run
coefficients.
3.3 Theoretical Framework
The neoclassical growth theory is adopted for this research. A constant return to scale
production function as modeled by neoclassical economists was employed in this
study. Four variables are the focus of this model: Technology (A), Labor (L), Capital
(L) and Output (Y). According to the neoclassical economists production will not
occur unless some amount of these four variables are combined. Equation (3.1) shows
the functional form of the production function:
31
It should be noted that A and L enter multiplicatively in this production function and
the model assumes constant returns to scale. It should be noted that A is exogenously
determined and that AL represents effective labour. This study follows the standard
neoclassical growth model, employed by Mankiw (1993), which is derived from
constant returns to scale production function with labor and capital as the inputs which
are paid at their marginal products to arrive at an augmented Solow model in (3.2) by
allowing equation (3.1) to be further expressed as follows, with production at time t:
……….…… [3.2]
Where:
β represents partial output elasticity with respect to human capital (H).
H represents human capital.
L represents labour.
Y represents output.
K represents physical capital.
α represents partial output elasticity with regards to physical capital (K).
A (t) shows the level of efficiency with respect to technology.
The equations below give the time paths of the identified variables.
To arrive at the marginal products of the respective factor inputs we get the derivative
of the factor input with respect to time t assuming technology is constant. It should be
noted that the variables with dot marks represent derivatives of the original variables.
We now have the Solow-Swan Model by transforming equation (3.2) into a
differential equation as follows:
32
……… [3.3]
Whereby k represents K/L the ratio of capital to labor
y represents Y/L the individual output of a worker
h represents H/L average number of human capital
The rate of investment in physical capital is given by sk while rate of investment in
human capital is denoted by sh.
g represents the rate of change in technological progress while n indicates the labor
growth rate. The depreciation rate is denoted by d.
Equilibrium values ie k* and h* are determined after solving the available system of equations. Assume that α+β<1
…… [3.4]
If we substitute equation 3.3 into equation 3.1, we can determine the equilibrium by
use of logarithms. This new equation can be written in terms of human capital
investment or in the form of equilibrium value of human capital along with other
constituent variables. Given that this research values human capital using literacy
33
The equilibrium output level can be expressed as:
+ ……… [3.5]
The above equation only holds under assumptions that dependent variables remain
stable over time. Where this assumption is not adhered to, the expression ln (d+n+g) is
complemented with an equivalent rate of change to cater for the ensuing instability.
The resulting equation is then linearized and expressed in the simplest way possible.
Solving the differential equations arising from equations 3.1 and 3.2 however gives an
equilibrium level of human capital in actual terms. To be precise the specified
equations (having made growth rates the subject of the equations) can be substituted
into equation 3.3. The ensuing investment rates are then substituted out to give the
following equation.
α
……… [3.6]
Linearizing this equation helps us solve the expression for ln h
……… [3.7]
In this case
ѱ Represents a funtion of (d+n+g) and (α) & (β)
If equation 3.6 is rearranged to solve the value of ln h we get the following expression
Ln h* (t) = lnh(t) + (1-ѱ)/ѱ∆ ln (h(t)/A(t))
34
The equilibrium value of human capital cannot be ascertained even now
We therefore substitute equation 3.7 (giving the expression for ln h) into equation 3.4
in a bid to determine the actual value of equilibrium human capital values with respect
to investment and stock of human capital.
As noted in the literature review the resulting equilibrium equation can only hold if
the east African countries which are under study are always in a state of equilibrium
without any form of economic disturbances. Given the recorded growth rates in East
Africa were captured with no considerations to economic stability the model needed to
be adjusted to suit the transitional changes that happened. As a result, the temporary
dynamics can be expressed in linear form as:
.……… [3.9]
Given that λ is equivalent to (1-α-β) (g(t) + n(t) +d)
Solving the above equation gives us:
……… [3.10]
Given that
Expressing equation 3.9 in terms of h* and y* like is the case with equations 3.4 and
3.7 results to:
) ln α αlng+nt+d+ g
A 0 )gt…………... . [3.11]
The above equation holds under the assumption that the rate of technological progress
35
In special case scenarios where variable g cannot be observed, the indicators of this
variable can be distinguished from other constants by use of empirical methods. The
output equation by estimation can then be given as:
–
( )……… [3.12]
The above equation 3.11 can be used to estimate values for all time intervals. Large
time intervals such as 10 year periods lead to loss of key observations and therefore to
overcome such inefficiency, this study will employ single year time spans. Given the
high likelihood of annual data to contain unstable temporary components, such
shortcomings can be overcome by use of short run regressors. The equation can then
be expressed in a new form assuming the equilibrium condition for error correction
i.e. 1 < - (1- еλt) < 0)
b2 lnht+b3 lnn(t)+ɛ ………...……… [3.13]
The growth of GDP per capita according to literature review is a tool for estimating
regressions in growth.
We can therefore use the annual data available pooled across different countries and
then expressed in a time series form. The equilibrium output equation then becomes:
am+1, it+b1, i lnsi, tK+ b2, i lnhi, t+b3, i ni, t+ j=4mbj, ilnVi, t j+εi,
t………. [3.14]