Available online: https://pen2print.org/index.php/ijr/ P a g e | 1555
An Investigation of Perturb and Observe Based MPPT
Algorithm for PV System
T Nishanth1 and V Nirmala Devi2
1PG Student, Dept. of Electrical and Electronics Engg. Dr.KVSRIT, Kurnool, A.P, India.
2Associate Professor, Dept. of Electrical and Electronics Engg. Dr.KVSRIT, Kurnool, A.P, India.
Abstract:-Renewable energy is one of the most available and exploitable forms of energy of the various renewable energy sources photovoltaic energy has emerged as the most viable source of electric power and is economically competitive with conventional sources. With the increasing demand on electricity and rising prices of conventional sources, photovoltaic energy is a promising alternative; it is freely available and less operational and requires low maintenance. Maximum power point tracking techniques (MPPT) are used in photo voltaic (PV) systems to maximize the PV array output power by tracking continuously. Among all the different techniques Perturb and Observe (P&O) technique is most extensively used in commercial MPPT systems because it is straight forward and low cost to implement.
1. INTRODUCTION
Energy is a primary and most universal measure of all kinds of work by human beings and nature. In the world, everything that happens is the expression of flow of energy in one of its forms. Electrical energy, among all special types of energy is one of the most important that people require every day. Increasing energy demand and environmental issues over the non- renewable energy sources have significantly developed the interest in renewable energy sources to replace non-renewable energy sources. The electrical power generation awareness based on different renewable energy sources are reviewed in this chapter. Among all the renewable energy sources the photovoltaic (PV) are gaining more popularity due to their ease of installation, low maintenance and in isolated mode of power generation these are proven as an effective solution for feeding energy demand in rural areas. A photovoltaic system with Maximum power point tracking (MPPT) algorithm is presented which increases the system efficiency.
A solar cell in the PV system has the non-linear characteristics and the output power of the PV system mainly depends on irradiance or insulation and temperature. Thus, the PV system due to these non linear characteristics produces less efficiency in the output power. To increase the efficiency of the PV system, maximum power point tracking techniques are introduced. There are various MPPT techniques that are used in the recent days to produce high tracking efficiency and good performance of PV system. Some of the MPPT techniques used for PV system to track
maximum power are curve fitting technique, open-circuit voltage technique; short-circuit current technique,
Incremental conductance technique, perturbation and observation technique and other techniques. Among these techniques perturbation and observation technique is most commonly used.
This paper shows PV modeling with MATLAB/SIMULINK maximum power point tracking by using P&O technique. Then the results are compared and the performance of the PV system is evaluated.
2. SYSTEM CONFIGURATION
The system consists of a PV module, DC/DC converter, P&O MPPT block and load. Let us see the each block in detail.
Fig.1. Block diagram of proposed system configuration
Available online: https://pen2print.org/index.php/ijr/ P a g e | 1556 solar cell expect with the change in the magnitude of current
and voltages. A solar module normally provides with 36 or 72 individual cells [6] - [7]. Multiple PV modules connected in series and or parallel to form an array.
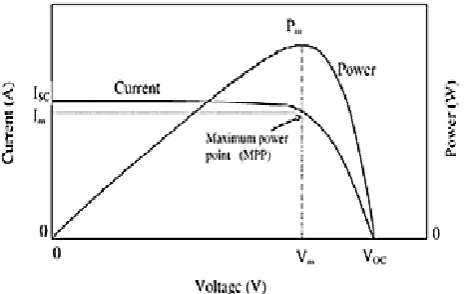
PV cells in nature shows nonlinear I-V and P-V characteristics which differ with irradiation and temperature of cell. The typical I-V and P-V characteristics of PV cell are shown in Fig.2.
Fig. 2.Characteristics of PV cell
The I-V Characteristics of PV array is nonlinear, which make it difficult to find the MPP. From the I-V curve and P-V curves at fixed irradiance, open circuit voltage decreases with increase in temperature.
A DC-DC converter converts directly from DC-DC and is simply known as a DC converter. A DC converter can be considered as an ac transformer with a continuously variable turn ratio and it can be used to step down or step up a DC voltage source as transformer. DC converters can be used as switching-mode regulators to convert a DC voltage to a regulated DC output voltage. The regulation is normally obtained by PWM at a fixed frequency and the switching device is basically BJT, MOSFET or IGBT.
3. PERTURB AND OBSERVATION ALGORITHM
P&O algorithms are extensively used in MPPT because of their simple structure and the few precise parameters which are required. In this technique, a small perturb is introduced, it makes the power of PV module changes. If the power is increases, then perturbation will go in the same path in the next sequence, otherwise the perturb path will be reversed. Therefore, when the steady state is reached, the P&O algorithm will oscillate around it resulting in a loss of PV power, after that perturbation reverses in cases of constant or slowly changing atmospheric conditions. In turn
to decrease the power loss size of perturbation is kept very little. [11].
In this topology,P&O method is measured by adapting the step size. When the system operating far from the MPP then the size of perturbation is improved, and when the real operating point starts to oscillate close to the MPP, the algorithm changes the reference voltage in order to reduce step size, so the fluctuation is reduced to a large extent. By reducing the step size oscillations at MPP is reduced but tracking speed will be very low. The P&O block diagram shown in below Fig.3.
Measure V(K) and I(K) Calculate Power P(K)>P(K-1) V(K)>V(K-1)
Vref(K)= Vref(K-1)+C
V(K)>V(K-1)
Vref (K)= Vref(K-1)+C Vref (K)=
Vref(K-1)-C
Vref (K)= Vref(K-1)-C
YES NO
NO
NO YES YES
Fig 3.Perturb and Observe (P&O) algorithm
Further evaluating the voltage and power equations, MPPT controller may track the accurate direction to achieve MPP of PV array. The maximum power operating point rapidly tracks by considering derivative of power and voltage(dp/dv) equate to zero with varying cell temperature and solar irradiance.
Power slope dp/dv will be evaluated digitally by sampling the PV array current and voltage at consecutive time intervals (k-1) and (k) as follows.
dP / dV (k) = P(k) – P(k-1) / V(k) –V(k-1)(1) Where,
P(k) = Present value of power P(K-1)= Previous value of power V(k) = Present value of voltage V(K-1) =Previous value of voltage
Available online: https://pen2print.org/index.php/ijr/ P a g e | 1557
dp(k)/dv(k-1) =0 (2)
4. RESULT ANALYSIS
A.Simulation Diagram of Photovoltaic System:
The mathematical model of PV array is designed in MATLAB/Simulink to be compatible with a given load to achieve maximum power transfer from solar arrays, is shown in Fig.4.When the temperature constant and varies irradiance then power gradually minimum to maximum. Similarly when the temperature varies and irradiance constant then power gradually maximum to minimum respectively.
Fig 4. Simulation Diagram of Photovoltaic System
The Current vs. Voltage (I-V) characteristics and the Power vs. Voltage (P-V) characteristics of the photovoltaic system at rated values of solar irradiation (1kw/m2) and temperature (25ₒC) is shown in below Fig.5. and Fig 6.
Fig.5. I-V Characteristics
Fig.6. P-V Characteristics
If there is any changes in solar irradiation or in temperature or in both, the V-I characteristics and P-V characteristics will also changes, this will also effects the PV system output power. The I-V and P-V curves for changes in the solar irradiation are shown in Fig.7 and Fig.8.
Fig.7 I-V Characteristics for Different Solar Irradiation
Fig.8 P-V Characteristics for Different Solar Irradiation
From Fig 7 and Fig 8 it shows that, as solar irradiation increases from minimum to maximum, power increases from minimum to maximum at constant temperature of 25ₒC. Similarly as the temperature changes power will also changes. The V-I and P-V characteristics for changes in temperature is shown in Fig 9 and Fig 10.
Available online: https://pen2print.org/index.php/ijr/ P a g e | 1558 Fig.10 P-V Characteristics for Different Temperature
From Fig 9 and Fig 10 it shows that, as temperature increases power decreases at constant solar irradiation of 1000w/m2.
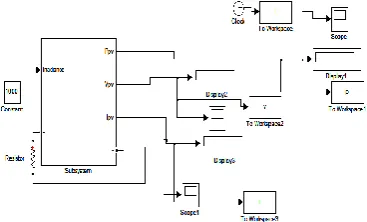
B. Simulation diagram of P&O MPPT Controller
Fig.11. Simulink Diagram of P&O MPPT control
The Fig.11 shows the Simulink diagram of P&O MPPT controller. The irradiance input block and the Duty cycle block where different duty cycles are given to the system and the another block is the Boost converter.
Fig.12Output Voltage of P&O
Fig.13 Output Current of P&O
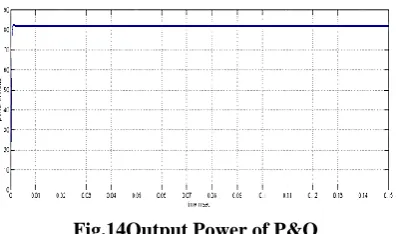
Fig.14Output Power of P&O
Fig 12, Fig 13 and Fig 14 shows the Output voltage, Current and power respectively at T = 25oC and λ=1000W/m2. The output voltage, current and power of the boost converter for the Perturb &Observe based maximum power point tracking of PV system are shown in Fig 15, Fig 16 and Fig 17 respectively.
Fig.15 Output Voltageof Boost converter
Fig.16 Output Currentof Boost converter
Available online: https://pen2print.org/index.php/ijr/ P a g e | 1559 Boost converter output voltage, current and powerof
P&O at T=25oC and λ=1000W/m2 The values of PV power, voltage and current for different irradiance at constant temperature with P&O based MPPT are measured and the changes in maximum voltage and maximum current and maximum power are shown in Table.1 It shows that power gradually decreases due to decrease of irradiance. So that the oscillations are increases and the stability goes down.
The performance of the system with P&O and without P&O is tabulated for different irradiance values. The temperature is fixed at T = 250C andλ=1000W/m2is also fixed.
Table 1
ANALYTIC ASSESSMENT OF P&O MPPT CONTROL ALGORITHM BASED PV SYSTEM
Irradiation (W/m2)
Temperature (0C)
VPV (volts) IPV (Amps) PPV (Watts) Tracking Efficiency (%)
200 25 11.2 1.05 11.5 11.5
400 25 13.35 2.15 27.9 27.9
600 25 14.26 3.17 44.6 44.6
800 25 14.89 4.23 61.69 61.69
1000 25 16.63 5.08 82.4 82.4
From the table 1 it is evident that the tracking efficiency at irradiance 1000W/m2 is high (82.4%) and it is lowest at the irradiance 200W/m2 (11.5%).
5. CONCLUSION
The maximum power point tracking is a technique used with PV system to improve its conversion efficiency. To eliminate mismatch between the load line and V-I characteristic, an MPPT control algorithm is necessary. Perturbation and Observation method is relatively simple and easily of implementation could be realized easily with simulation. P&O method has dramatic fast tracking capability;a better response for the system under rapid atmospheric condition variations can be obtained by increasing the execution speed.The P&O method gives high efficiency about 82.4% and performs well with changing irradiation and temperature.
REFERENCES
[1]I.H. Altas; A.M. Sharaf, “A Photo voltaic Array Simulation Model for Matlab-simulink GUI Environment”.IEEE- 2007.
[2]Chihchiang Hua and Chihming Shen, “Study of Maximum Power Tracking Techniques and Control DC-AC Converters for Photovoltaic Power System”, IEEE transactions 1998.
[3]S. Meenakshi, K. Rajambal, C.Chellamuthu, and S. Elangovan, “Intelligent Controller for a Stand-Alone Hybrid Generation System”, IEEE proceedings 2006.
[4]B. Kavidha, K. Rajambal, “Transformerless Cascaded Inverter Topology for Photovoltaic Applications”, Proceedings of India International Conference on Power Electronics 2006.
[5]Balakrishna s, Thansoe, Nabil A, Rajamohan G, Kenneth A.S, Ling C.J, “The Study and Evaluation of Maximum Power Point Tracking Systems: International Conference on Energy and Environment 2006” (ICEE 2006).
[6]R.Kiranmayi, K Vijayakumar Reddy and M Vijayakumar, “Modeling and an MPPT Method for Solar Cells: Journal of Engineering and Applied Sciences”, 3(1):128-133, 2008.
[7]Yen-Jung Mark Tung, Dr.Aiguo Patrick Hu and Dr.Nirmal- Kumar Nair, “Evaluation of Micro Controller Based Maximum Power Point Tracking Methods Using Dspace Platform”, Australian university power engineering conference 2006.
[8]Mohamed Azab, “A New Maximum Power Point Tracking for Photovoltaic Systems”, proceedings of world academy of science, engineering and technology, October 2008.
[9] A. Yafaoui, B.Wu and R.Cheung, “Implementation of Maximum Power Point Tracking Algorithm for Residential Photovoltaic Systems” 2nd Canadian solar buildings conference Calgary, June 10-14, 2007.
[10] Roberto Faranda, Sonia Leva, “Energy Comparison of MPPT Techniques for PV Systems”, Wseas transactions of
power systems, June 2008.
[11] K.H. Hussein, I.Muta, T.Hoshino, M.Osakada, “Maximum Photovoltaic Power Tracking: And Algorithm for Rapidly Changing Atmospheric Conditions” IEEE Proc-Generation, Transmission, Distribution, vol.142, No.1, January 1995.
[12] Yeibg-Chau Kuo, Tsornf-Juu Liang, Jiann-Fuhchen, “ Novel Maximum- Power-Point-Tracking Controller for Photovoltaic Energy Conversion System” IEEE Transactions on industrial electronics, vol.48, NO.3, June 2001.
Available online: https://pen2print.org/index.php/ijr/ P a g e | 1560 Power Point Tracking” IEEE transactions on industrial
electronics, vol.54, NO.3, June 2007.
[14] M.Salhi, R.El-Bachtiri, “Maximum Power Point Tracking Controller For PV Systems Using A Pi Regulator With Boost Dc/Dc Converter” ICGST-ACSE journal, vol.8, Isuue III, January 2009.
[15] S.Jain and V.Agarwal, “Comparison of the Performance Of Maximum Power Point Tracking Schemes Applied To Single Stage Grid Connected Photovoltaic Systems”, IET Electr. Power Apll, 2007, 753-762.
Mr T Nishanth was born in Kurnool, India in 1993. He received the B.Tech (Electrical and Electronics Engineering) degree from JNTUA University, India in 2014. Currently he is doing M.Tech in Power Electronics and Electrical Drives in Dr.KVSRIT, Kurnool affiliated to JNTUA University. His field of interest includes Power electronics, Electrical Drives, Renewable energy system Photovoltaic systems and MPPT control techniques.