Electronic Thesis and Dissertation Repository
4-2-2019 1:00 PM
Evaluating restoration success by tracking the structural and
Evaluating restoration success by tracking the structural and
functional recovery of restored, drained, and intact wetlands
functional recovery of restored, drained, and intact wetlands
Renee C. Howard
The University of Western Ontario
Supervisor Creed, Irena F.
The University of Western Ontario Co-Supervisor Trick, Charles G.
The University of Western Ontario Graduate Program in Biology
A thesis submitted in partial fulfillment of the requirements for the degree in Master of Science © Renee C. Howard 2019
Follow this and additional works at: https://ir.lib.uwo.ca/etd
Part of the Natural Resources and Conservation Commons
Recommended Citation Recommended Citation
Howard, Renee C., "Evaluating restoration success by tracking the structural and functional recovery of restored, drained, and intact wetlands" (2019). Electronic Thesis and Dissertation Repository. 6122.
https://ir.lib.uwo.ca/etd/6122
This Dissertation/Thesis is brought to you for free and open access by Scholarship@Western. It has been accepted for inclusion in Electronic Thesis and Dissertation Repository by an authorized administrator of
ii
Abstract and Keywords
Wetland restoration efforts have increased on the Canadian prairies to
compensate for widespread loss of wetland area, form, and function. Restoration activity presumes a direct replacement for natural wetlands, where restored wetlands provide equivalent ecological functions and services. However, restoration projects often show limited recovery success in biological structure and biogeochemical function. Using plant functional traits is an emerging
approach to assessing ecological process and may provide a better indicator of wetland functional recovery than vegetation structural indicators alone. Here, I tracked vegetation structural metrics (i.e., species richness, composition, and cover) and plant functional traits over a chronosequence of restored wetlands to compare structural and functional recovery and evaluate restoration success. Results suggest rapid structural recovery (within five years of restoration) and similar functional diversity among drained, restored, and natural wetlands. The approach taken towards wetland restoration, combined with a heavily impacted agricultural landscape, may be limiting the recovery potential of wetlands, thereby creating a homogenization of wetland form and function.
iii
Co-Authorship Statement
Chapter 2 is a manuscript based on data and analysis presented in a manuscript accepted as: Salaria, S., Howard, R., Clare, S., & Creed, I. F. 2018. Incomplete recovery of plant diversity in restored prairie wetlands on agricultural landscapes. Restoration Ecology. DOI: 10.1111/rec.12890. Contributions of co-authors: R. Howard and S. Salaria designed the research project, collected and analyzed the data, and contributed to the writing and editing of the manuscript. Additionally, R. Howard conducted an additional year of data collection, analysis, and included a climate analysis as part of this chapter. S. Clare conceived the research project and contributed to writing and editing of the manuscript. I.F. Creed conceived and designed the research project, assisted in the analysis and interpretation of results, and helped to write and edit the manuscript.
Chapter 3 is a manuscript that will be submitted to a peer-reviewed journal with S. Clare and I.F. Creed as co-authors. R. Howard will be lead author as she conceived the research project, completed the collection of data, analysis, and interpretation of results, and will lead the writing of the manuscript. S. Clare and I.F. Creed contributed to the conceptual design, interpretation of results, and will provide assistance in the writing and editing of the manuscript.
iv
Acknowledgments
This project was funded by the Alberta Land Institute as part of the Living Laboratory Project (principal investigators include Dr. Irena Creed and Dr. Peter Boxall, University of Alberta, and Dr. Shari Clare, University of Alberta as co-investigator). Additional financial support was provided from an ABATE grant awarded to Dr. Irena Creed. Other forms of support were provided by Ducks Unlimited Canada, the University of Alberta, and Fiera Biological Consulting.
This thesis is the product of the support, kindnesses, energies, and efforts of many people. I am grateful for all the help received, and I recognize that I’m surrounded by really amazing people. I want to express my sincere gratitude and appreciation to the following:
First, to Dr. Irena Creed, who blindly took me on, let me run with ideas, and maintained the direction when I lost sight of it. You’re an inspiration as a scientist, as a mentor, and a person, and I am grateful for the opportunities and insights you’ve provided to me. My appreciation also goes to my co-supervisor, Dr. Charlie Trick, who came on board halfway through my project and showed interest, enthusiasm, support, and patience throughout.
Next, to Drs. Nusha Keyghobadi and Hugh Henry, who were excellent advisors by providing support, encouragement, and direction exactly when
needed. Thank you for agreeing to be part of this project, and I‘m pleased to have met and worked with you both.
To those who provided study sites, workspace, equipment, field, and lab support: I extend my thanks to Robbin Hunka and Ducks Unlimited Canada, Glen Hvenegaard and Augustana University, as well as to Klaus Strenzke and Alan Harms from the University of Alberta for research help and space both in the field and out. I am grateful for and would like to acknowledge the assistance and resources provided by Dr. Greg Thorn, curator, and the University of Western Ontario Herbarium (UWO). Both were instrumental to my success and
v
To the Creed Crew: Jackie, Oscar, Erika, Rick, Veerta, Aleksey, Sonja, Michael, Dave, Kevin, Malihe, Eric, and Camille. I’ve heard that friends come into your life for one of three reasons, friends for a reason, friends for a season, and friends for a lifetime. I have found one of those in each of you. Thank you. I hope I get the opportunity to work with you again.
To my parents and all the people waiting for me back home: your support, encouragement, and unwavering belief that I would excel were overwhelming, and always appreciated. Shari and Joe, thank you for your support, leadership, and friendship. I value and admire the dedication and commitment you show towards everything you do.
To Kris: you’ve provided unconditional love throughout this whole
endeavour, and I’m thankful, grateful, and am incredibly lucky to have you. You can have your partner back now.
Finally, we could all heed a little advice from a wetland:
‘Make a splash, take time to reflect, listen to nature, reed more, be green,
vi Table of Contents
Abstract and Keywords ... ii
Co-Authorship Statement ... iii
Acknowledgments ... iv
Table of Contents ... vi
List of Tables ... viii
List of Figures ... ix
List of Appendices ... x
1 Chapter 1. Introduction ... 1
1.1 Problem Statement ... 1
1.2 Scientific Justification ... 1
1.2.1 Wetlands and Consequences of Their Loss ... 1
1.2.2 Wetland Management in Canada and on the Prairies ... 3
1.2.3 Wetland Replacement by Restorative Action ... 4
1.2.4 The Conceptual Basis behind Restoration ... 5
1.2.5 A Trait-based Approach to Functional Recovery ... 10
1.3 Research goals, hypothesis, and predictions ... 11
1.4 Thesis organization ... 12
1.5 References ... 13
2 Chapter 2. Incomplete Recovery of Plant Diversity in Restored Prairie Wetlands on Agricultural Landscapes ... 17
2.1 Introduction... 17
2.2 Methods ... 19
2.2.1 Study area ... 19
2.2.2 Sampling ... 22
2.2.3 Plant Diversity ... 23
2.2.4 Morphology ... 24
2.2.5 Statistical Analysis ... 24
2.2.6 Precipitation and Climate ... 25
2.3 Results ... 25
2.3.1 Effect of Age on Wetland Recovery ... 26
2.3.2 Effect of Morphology on Recovery ... 31
2.3.3 Effect of Annual Variability on Structural Metrics... 33
2.3.4 Comparison Precipitation Between Sampling Years ... 35
2.4 Discussion ... 37
2.4.1 Assessment of Degraded Conditions Prior to Wetland Recovery ... 37
2.4.2 Effect of Age on Wetland Recovery ... 39
vii
2.4.4 Benchmarks for Measuring Restoration Success ... 43
2.4.5 Variability in Wetlands and the Influence of Precipitation ... 45
2.5 Conclusions and Lessons for Wetland Managers ... 46
2.6 References ... 47
3 Chapter 3. A Functional Approach to Evaluating Wetland Restoration Success 52 3.1 Introduction... 52
3.2 Methods ... 56
3.2.1 Study area and sample sites ... 56
3.2.2 Wetland sampling and vegetation dominance ... 57
3.2.3 Sample handling and processing ... 58
3.2.4 Statistical Analyses ... 60
3.3 Results ... 64
3.3.1 Trait response by species ... 64
3.3.2 Community level trait response ... 67
3.3.3 Functional diversity ... 69
3.4 Discussion ... 72
3.5 Conclusion... 79
3.6 References ... 80
4 Chapter 4. Conclusions ... 87
4.1 Research Findings ... 87
4.2 Research Significance ... 90
4.3 Recommendations for Future Research ... 92
4.4 References ... 94
5 Appendices ... 96
viii List of Tables
Table 2.1. Raw mean values ±SE of structural metrics in 2016, represented by age class….. ... 27
Table 2.2. Spearman rank correlation values between wetland morphometrics and plant structural diversity metrics in 2016..……….……….…….…31
Table 2.3. Monthly water year precipitation compared between 2016 and 2017. Water year is defined from October through September of the following year. ... 37
Table 3.1. Common plant functional traits used to evaluate ecosystem process and function as established in the literature. ... 55
Table 3.2. Metrics used to assess functional diversity in a chronosequence of restored wetlands……...……….63
Table 3.3. Functional diversity (FD) metric values (raw) by wetland…….……….71
Table A1. Species observed in Drained (D), Nat(Ag) (N), and Nat(Res) P
wetlands………97
ix List of Figures
Figure 2.1. Location of study sites used to assess structural recovery in restored wetlands. ... 20
Figure 2.2. Estimated marginal means (± SE) of (A) percent cover of
hydrophytes, (B) percent cover of native species, and (C) percent cover of non-native species across a chronosequence of restored wetlands at a standard wetland size of 0.378 ha as observed in 2016.. ... 28
Figure 2.3. Estimate species richness (+/- SE; estimated marginal means at a constant wetland size of 0.378 ha) across a chronosequence of restored
wetlands assessed in 2016. ... 29
Figure 2.4 NMDS of community composition observed in 2016 grouped by
wetland restoration age classes (represented by triangles).. ... 30
Figure 2.5. Wetland morphometrics fitted on NMDS ordination of community composition in 2016.. ... 32
Figure 2.6. Morphometries of study wetlands. ... 33
Figure 2.7. Structural diversity metrics (± SE) compared between 2016 and 2017. ... 34
Figure 2.8. NMDS of community composition as assessed in 2017. ... 35
Figure 2.9. Comparison of cumulative precipitation in 2016, 2017, and to the 30-year precipitation normal over the growing season for a centrally located point within the study area. ... 36
Figure 3.1. Mean (+/- SE) plant functional trait values as a function of time since restoration. ... 66
Figure 3.2. Community weighted mean (CWM) trait values (+ SE) in restored wetlands as a function of time since restoration. ... 68
x List of Appendices
Appendix A. Complete list of species observed among wetlands ... 96
Appendix B. Study sites used to assess structural and functional recovery of restored wetlands ... 116
1 Chapter 1. Introduction
1.1 Problem Statement
Wetlands have historically sustained major impacts and high rates of loss on prairie landscapes as a result of the encroachment of development and/or drainage for crop production (Golden et al. 2017). With this wetland loss is an associated loss of wetland functions and ecosystem services (Creed at al. 2017). In the Canadian prairies, wetland restoration is increasingly being used as a tool to return wetland functions and ecosystem services back to the landscape, and the implication is often that ecosystem functions and services provided by the lost natural wetlands have been repaired. Creating wetland habitat (i.e., more wetland area) is easy and relatively successful when hydrologic conditions are restored (Zedler & Kercher 2005). However, ecological processes and functioning take longer to develop than vegetation diversity and structure, and require more time and resources to measures (Meli et al. 2014). Ultimately, return of ecosystem function and services of wetlands post-restoration are required to provide resilient habitats, regulate hydrology, and maintain multi-functional landscapes. Finding a reliable method for assessing and monitoring the recovery of wetland functions is required given that wetland policies and restoration guidelines across North America include functional equivalence as a primary goal or desired outcome (e.g., Alberta’s Wetland Policy, Government of Alberta 2013).
1.2 Scientific Justification
1.2.1 Wetlands and Consequences of Their Loss
water at or near the ground surface of the soil for all or varying periods of the year, the development of hydric soils (further discussed in Chapter 2) that
distinguish wetland soils from adjacent uplands, and finally, the presence of biota and vegetation adapted to wet conditions. Despite being variable in character, wetlands have been valued and depended upon for centuries as a source of food, trade, material, and for other products and services (Mitsch and Gosselink 2007).
Wetland habitats have long been threatened by urban expansion,
agricultural intensification, and land development, resulting in widespread, global loss in number and area (Davidson 2014). Globally, up to 50% of wetlands have been lost, though these estimates may be conservative and are dated (from the early 1990s) (Davidson 2014). Further, estimates of wetland loss increase significantly (to 80 or 90%) in some areas where wetlands feature (or historically featured) prominently on the landscape; for example, in the Prairie Pothole Region (PPR) where wetlands historically covered ~20% of the landscape. (Mulhouse and Galatowitsch 2003). The PPR is located in the northern Great Plains states of the USA and much of the southern portion of the Prairie Provinces (i.e., Alberta, Saskatchewan, and Manitoba) of Canada (Figure 2.1, inset), and is named after the pothole wetlands that characterize the region. Pothole wetlands are small, shallow wetlands formed following the retreat of the Laurentide ice sheet at the end of the Wisconsinan glaciation (Dyke and Prest 1987). While often considered geographically isolated from one another, in fact, prairie pothole wetlands are hydrologically connected through groundwater, and form one of the largest wetland complexes in North America (Tiner 2003; Van de Valk 2005). The main cause of wetland loss in the PPR has been the conversion of natural landscapes into agriculture (Tiner 1984).
globally wetlands represent three percent of total land area, but sequester 30 percent of all soil carbon (Zedler & Kercher 2005). Wetlands store carbon in their vegetation and soils, thus when natural wetlands are drained for cultivation, large quantities of stored organic carbon decompose and are lost to the atmosphere as carbon dioxide (Zedler & Kercher 2005). Further, wetland habitats are an
interface between terrestrial and aquatic habitats, supporting a high diversity of plants and wildlife species and contributing disproportionately to primary
productivity on the landscape (Kennedy and Mayer 2002).
When wetlands are removed for agricultural, industrial, or other land developmental purposes, the functions and ecosystem services that wetlands provide are lost. The impacts of wetland loss on the Canadian Prairies include increased flooding events (Acreman and Holden 2013), increased frequency of nuisance algal blooms (Davis and Froend 1999), and shifts in landscape level hydrology (Cohen et al. 2016). The Millennium Ecosystem Assessment
conducted an economic valuation of wetland ecosystem services and determined that the total economic value of natural wetlands was far greater than the
economic value of wetlands converted to agriculture ($5,800 per hectare compared to $2,400 per hectare when drained and used for agricultural
purposes) (MEA 2005). Yet, despite the intrinsic and economic values provided by wetland habitats, wetland drainage and deterioration activities are widespread in the interest of economic development (Davidson 2014).
1.2.2 Wetland Management in Canada and on the Prairies
Great efforts have gone into implementing policy to conserve and protect remaining wetlands, and into wetland restoration initiatives to improve landscape function and provisioning of ecosystem services. In Canada, wetland policy implementation, development, and enforcement are a consolidated effort among the federal government, provincial governments, and other wetland management programs (e.g., Ducks Unlimited Canada, North American Waterfowl
(situated within National Parks, military reserves, National Wildlife Areas, and much of the land in the northern territories) (Rubec & Hanson 2009). The federal policy outlines a ‘mitigation hierarchy’, which includes steps, in order of
preference, for mitigating impacts to wetlands (Government of Canada 1991; Rubec & Hanson 2009). Separately, provincial governments manage most of the country’s wetlands and associated functions. While each province has a set of regulations, policies, and practices concerning wetland policy, many operate under a similar mitigation hierarchy (Rubec & Hanson 2009; Clare et al. 2011). Under this hierarchy, both federally and provincially, wetland conservation and avoiding impacts to wetlands are prioritized, then if avoidance of impacts is not practicable then the process progresses through to minimization. Finally, compensation is mandated when impacts to wetlands are unavoidable, usually through restoration, enhancement, or creation activities.
In Alberta, a new wetland policy was implemented in 2013; it is among a wave of policy updates and new policy developments that take a functional approach to wetland management. The Alberta Wetland Policy places a higher value on wetlands that contribute to water quality improvements, hydrology, biodiversity, and human use functions (Government of Alberta 2013). As with the federal policy, Alberta follows a three-stage hierarchy to guide management of wetlands and impacts. Avoidance of wetlands is the preferred response for managing wetlands, followed by an expectation to minimize impacts, and then finally wetland replacement, as opposed to compensation, as a last resort requirement when wetland impacts cannot be avoided or minimized. This policy provides an assessment of the contributions of a specific wetland to the
ecosystem and uses wetland relative value to establish restoration requirements if wetland impacts are unavoidable (Government of Alberta 2013).
1.2.3 Wetland Replacement by Restorative Action
Wetland loss in the Prairie Pothole Region has been caused by an
wetland functions and services. Restoration is defined as the practice of renewing or recovering function to a degraded, damaged, or destroyed ecosystem (SER 2002). Wetland restoration has been shown to mitigate the effects of wetland drainage and loss, but some damages are more difficult to restore, most notably, the loss of ecosystem services (Zedler & Kercher 2005). Ditch-drained wetlands typical of the Prairie Pothole Region are deemed to be among the simplest systems to restore. By constructing a ditch plug (or earthen berm) within the drainage ditch that previously drained the wetland, hydrology of the wetland basin is restored. It is expected that natural re-colonization of wetland plant species will follow (Galatowitsch & van der Valk 1996a). This idea of natural re-colonization, was termed the “efficient community hypothesis” and formed the leading
conceptual model for wetland restoration in the 1980s. However, rather than following the anticipated predictable pattern of recovery for wetlands, research suggests that restored wetlands deviate from their expected recovery path (Galatowitsch & van der Valk 1996b; Suding 2011; Moreno-Mateos et al. 2012). An emerging consensus is that the wetland vegetation structure and diversity does not recover to the condition of nearby, undisturbed natural wetlands of similar class, size, and condition. There is a critical need to understand the recovery of wetlands following restoration in an effort to more effectively manage these systems and the provisioning of functions and services they provide.
1.2.4 The Conceptual Basis behind Restoration
are fundamental components to understanding and achieving restoration success.
Successional theories describe an orderly predictable return of communities after a disturbance, until a climax community has been achieved (Clements 1916). This theory suggests that the species living in a particular place will gradually change over time as the physical and chemical environment in an area changes. Primary succession describes the changing community that occurs on an entirely new habitat that has not previously been colonized (Gorham et al. 1979). Secondary succession follows, where the community composition changes as the dynamics within the community change (e.g., competition, nutrient conditions, environmental factors) (Horn 1974). Finally, climax
communities are achieved when the species in a community are stable and are no longer undergoing change in composition under a set of environmental conditions (Horn 1974).
State and transition models are another framework that can explain community assembly following restoration (Young 2005). State transitions are described as discrete communities that exist under a set of conditions (i.e., climate, soil, topographic) (Westoby et al. 1989). A state is defined as long-term persistence of a new plant community or a new range of variation within a community that previously did not exist (Bestelmeyer et al. 2017). State transitions can be driven by internal mechanisms such as competitive
interactions, or by external drivers such as change in climate. Further, changes can be gradual such as by periodic grazing activity, or abrupt such as by an extreme drought (Bestelmeyer et al. 2017). State and transition models were developed to allow for flexibility and nonlinearity otherwise not observed with succession models (Zweig et al. 2009).
communities hypothesized to be due to random differences in colonization, establishment, and priority effects (Johnson 2005). Specifically, assembly theory suggests that from a pool of available species in a region, various filters work to limit the species that comprise the community. Some important filters that control wetland species composition may include water levels, fertility, disturbance, competition or other interactions (Keddy 1999).
These models of community development do not work in isolation. Instead, in combination, these evolving theories try to explain differences, change, and/or patterns in community assembly (Chang et al. 2016). Further, increasingly, the concept of alternative stable states is being used to describe community
assembly in restored systems (Lewontin 1969). A concept that incorporates aspects of succession, state and transition models, and assembly filters,
alternate stable states describes stable ecosystems that exist under different sets of unique biotic and abiotic conditions. The theory suggests that ecological
thresholds separate discrete states, but under significant perturbations, shifts between states are possible and can be catastrophic (Scheffer et al. 2001). Stability of an ecosystem determines how significant a perturbation has to be in order to shift states, and theoretically, the resistance and resilience of the system determine ecosystem stability (Mitchell et al. 2000). Ecosystem resilience is the ability of a system to return to normal following a disturbance or stress (Leps et al. 1982), whereas resistance is the ability of a system to avoid being displaces during a disturbance. Stability is an essential determinant of healthy communities and an important concept for ecological restoration (Leps et al. 1982).
Concurrent and related to community assembly, the mechanisms behind the coexistence of species in a community and ecosystem functioning are central to ecological restoration. Several theories exist to explain the occupation of a community by multiple species. To start, niche theory describes the general ecological requirements of a species given the physiological and biotic limits that restrict where they can thrive (Young et al. 2005). Competition for resources was considered the driver for the development of niche space in a community, such that the theory suggests no two species can occupy the exact same niche (competitive exclusion) (Palmer et al. 2006). Consumer differences in resource use determine the outcome of competition (survival, coexistence, or extinction).
Equalizing and/or stabilizing mechanisms are also used to explain the coexistence of species (Chesson et al. 2000). This idea suggests that heterogeneity in an environment results in trade-offs among species, which enables species co-existence. Stabilizing mechanisms increase intraspecific interactions relative to interspecific interactions (such as in relation to resource partitioning) thereby reducing competition since segregation of strategies ensure that species persist through time (Chesson et al. 2000). Whereas equalizing mechanisms minimize fitness differences between species, which increases competition thereby excluding those species unable to compete, which
contributes to stable coexistence of a few competitive species (Chesson et al. 2000). Similarly, resource based theories of competition explain coexistence through differential resource requirements and uptake strategies among co-occurring species.
Finally, life-history strategy and trade-off concepts enable coexistence since species exhibit trade-offs in their response to competition, stress, and
history traits differ among species allowing coexistence (Grime 1977). Of the theories presented, no one concept explains species coexistence in every
community, but rather these concepts should be used by restoration practitioners to explain patterns of community development, species persistence through time, and change in community composition.
Generally, a community with many persistent and coexisting species is a common objective of habitat restoration projects (Palmer et al. 2006), where high diversity is traditionally the main focus (Cadotte et al. 2011). Diversity – function (or biodiversity - ecosystem function (BEF)) relationships are widely studied and continue to feature prominently in ecological research, increasingly so in the field of restoration ecological (Benayas 2009). The theory suggests that biodiversity is a key factor in ecosystem functioning. Ecosystems contain an assemblage of species whose individuals cycle material between organic and inorganic forms referred to as ecosystem processes (Naeem 2006). Ecosystem processes are generally measured as rates of flux among pools of dead, living, or inorganic matter (Naeem 2006). These fluxes can be compared among ecosystems in order to understand ecosystem response to change, such as addition of loss of species, land modification, or restoration efforts (Naeem 2006).
Further, species diversity is hypothesized to play a major in ecosystem stability. Four hypotheses are said to describe the role of species diversity on ecosystem stability (Mitchell et al 2000). First, the diversity - stability hypothesis predicts that ecosystem stability increases as species diversity increases
(MacArthur 1955). The rivet hypothesis suggests that an ecosystem will continue to function normally if there are only a few extinctions, but the loss of a critical species or number of species may cause instability within an ecosystem (Ehrlich & Erlich 1981). The redundancy hypothesis suggests that certain species are able to expand their hold in the ecosystem to compensate when neighbouring species are lost (Walker 1992). And finally, the idiosyncratic hypothesis proposes that although ecosystem function changes when diversity changes, the
complexity of ecosystems and the varied responses of the species (Lawton 1994).
The ecological concepts and theories described above provide a glimpse of the deep ecological roots that restoration is built upon. Without a doubt,
understanding theses concepts of community ecology will help contribute to re-establishing compositionally and functionally diverse communities to the
landscape.
1.2.5 A Trait-based Approach to Functional Recovery
(e.g., limiting invasion, maximize survival, achieving desired functions) (Laughlin 2014), to evaluate the performance of species for establishment and persistence following restoration (Pywell et al. 2003), and to further describe and understand the diversity - ecosystem function relationship (Cadotte, Carscadden, &
Mirotchnick 2011).
1.3 Research goals, hypothesis, and predictions
This observational study evaluated the vegetation communities of 42 prairie pothole wetlands, which included drained, natural, and restored wetlands ranging from one year through 24 years since restoration. The goal of this research project was to track, analyze, and compare structural and functional recovery of vegetation in restored wetlands in an effort to identify indicators of success, infer return to function, and evaluate trajectories of recovery between structural and functional approaches. This research project tested two hypotheses.
1) Structural diversity of restored wetlands recovers rapidly but is dependent on wetland morphometry.
I predict that plant species diversity, community composition, and cover estimates of restored wetlands will be comparable to natural wetlands within a few growing seasons, and that larger wetland area, smaller perimeter to area ratios, and gentler slopes will support vegetation communities that more closely resemble those of natural wetlands.
2) Functional recovery of restored wetlands is slow to recover and will be reflected in plant functional traits and wetland functional diversity.
1.4 Thesis organization
1.5 References
Acreman, M. & Holden, J. (2013). How wetlands affect floods. Wetlands, 33(5),
773-786.
Aronson, M. F., & Galatowitsch, S. (2008). Long-term vegetation development of restored prairie pothole wetlands. Wetlands, 28(4), 883-895.
Benayas, J. M. R., Newton, A. C., Diaz, A., & Bullock, J. M. (2009). Enhancement of biodiversity and ecosystem services by ecological restoration: A meta-analysis. Science, 325(5944), 1121-1124.
Bestelmeyer, B. T., Ash, A., Brown, J. R., Densambuu, B., Fernández-Giménez, M., Johanson, J., ... & Shaver, P. (2017). State and transition models:
Theory, applications, and challenges. Rangeland Systems. Springer, Cham. p. 303-345.
Cadotte, M. W., Carscadden, K., & Mirotchnick, N. (2011). Beyond species: Functional diversity and the maintenance of ecological processes and services. Journal of Applied Ecology, 48(5), 1079-1087.
Chang, C., & HilleRisLambers, J. (2016). Integrating succession and community assembly perspectives. F1000Research, 5.
Chesson, P. (2000). Mechanisms of maintenance of species diversity. Annual Review of Ecology and Systematics, 31(1), 343-366.
Clare, S., Krogman, N., Foote, L., & Lemphers, N. (2011). Where is the avoidance in the implementation of wetland law and policy? Wetlands Ecology and Management, 19(2), 165-182.
Clements, F. E. (1916). Plant succession: An analysis of the development of vegetation. Carnegie Institution of Washington.
Cohen, M. J., Creed, I. F., Alexander, L., Basu, N. B., Calhoun, A. J., Craft, C., ... & Jawitz, J. W. (2016). Do geographically isolated wetlands influence
landscape functions? Proceedings of the National Academy of Sciences,
113(8), 1978-1986.
Creed IF, Lane CR, Serran JN, Alexander L, Basu NB, Calhoun A, Cohen MJ,
Craft C, D’Amico E, DeKeyser E, Fowler L, Golden HE, Jawitz JW, Kalla P,
Kirkman K, Lang M, Leibowitz SG, Lewis DB, Maron J, McLaughlin DL, Raanan-Kiperwas H, Rains MC, Rains KC, Smith L. (2017). Enhancing protection for vulnerable waters. Nature Geoscience, 10, 809-815.
Davidson, N. C. (2014). How much wetland has the world lost? Long-term and recent trends in global wetland area. Marine and Freshwater Research,
65(10), 934-941.
Davis, J. A., & Froend, R. (1999). Loss and degradation of wetlands in
southwestern Australia: Underlying causes, consequences and solutions.
Wetlands Ecology and Management, 7(1-2), 13-23.
de Bello, F., Lavorel, S., Díaz, S., Harrington, R., Cornelissen, J. H., Bardgett, R. D., ... & da Silva, P. M. (2010). Towards an assessment of multiple
ecosystem processes and services via functional traits. Biodiversity and
Conservation, 19(10), 2873-2893.
Díaz, S., Lavorel, S., de Bello, F., Quétier, F., Grigulis, K., & Robson, T. M. (2007). Incorporating plant functional diversity effects in ecosystem service assessments. Proceedings of the National Academy of Sciences, 104(52),
20684-20689.
Dyke, A.S., & Prest, V.K. (1987) Late Wisconsinan and Holocene history of the Laurentide ice sheet. Géographie Physique et Quaternaire, 41, 237–264
Ehrlich, P., & Ehrlich, A. (1981). Extinction: The causes and consequences of the disappearance of species. Random House, New York.
Engst, K., Baasch, A., Erfmeier, A., Jandt, U., May, K., Schmiede, R., & Bruelheide, H. (2016). Functional community ecology meets restoration ecology: Assessing the restoration success of alluvial floodplain meadows with functional traits. Journal of Applied Ecology, 53(3), 751-764.
Erwin, K. L. (2009). Wetlands and global climate change: The role of wetland restoration in a changing world. Wetlands Ecology and Management, 17(1),
71.
Eviner, V. T., & Chapin III, F. S. (2003). Functional matrix: A conceptual framework for predicting multiple plant effects on ecosystem
processes. Annual Review of Ecology, Evolution, and Systematics, 34(1),
455-485.
Galatowitsch, S. M. (1993). Site selection, design criteria and performance assessment for wetland restorations in the prairie pothole region. PhD Dissertation, Iowa State University, Ames, Iowa. 124 p.
https://lib.dr.iastate.edu/rtd/10428.
Galatowitsch, S. M., & van der Valk, A. G. (1996a). Characteristics of recently restored wetlands in the prairie pothole region. Wetlands, 16(1), 75-83. Galatowitsch, S. M., & van der Valk, A. G. (1996b). The vegetation of restored
and natural prairie wetlands. Ecological Applications, 6(1), 102-112.
Golden H, Creed IF, Ali G, Basu N, Neff B, Rains M, McLaughlin D, Alexander L, Ameli A, Christensen J, Evenson G, Jones C, Lane C, Lang M. (2017). Scientific tools for integrating geographically isolated wetlands into land management decisions. Frontiers in Ecology and the Environment, 15(6),
319-327.
Gorham, E., Vitousek, P. M., & Reiners, W. A. (1979). The regulation of chemical budgets over the course of terrestrial ecosystem succession. Annual
Review of Ecology and Systematics, 10(1), 53-84.
Government of Alberta. (2013). Alberta Wetland Policy. Water Policy Branch, Alberta Environment and Parks. Edmonton, Alberta.
https://www.alberta.ca/alberta-wetland-policy.aspx
Government of Canada. (1991). The Federal Policy on Wetland Conservation. Environment Canada, Ottawa.
Grime, J. P. (1977). Evidence for the existence of three primary strategies in plants and its relevance to ecological and evolutionary theory.The American Naturalist, 111(982), 1169-1194.
Horn, H. S. (1974). The ecology of secondary succession. Annual review of ecology and systematics, 5(1), 25-37.
Keddy, P. (1999). Wetland restoration: The potential for assembly rules in the service of conservation. Wetlands, 19(4), 716-732.
Laughlin, D. C. (2014). Applying trait‐based models to achieve functional targets for theory‐driven ecological restoration. Ecology Letters, 17(7), 771-784.
Lawton, J. H. (1994). What do species do in ecosystems? Oikos, 71(3) 367-374.
Lepš, J., Osbornová-Kosinová, J., & Rejmánek, M. (1982). Community stability, complexity and species life history strategies. Vegetatio, 50(1), 53-63. Lewontin, R. C. (1969). The meaning of stability. In Brookhaven Symposia in
Biology, 22, 13-24.
MacArthur, R. (1955). Fluctuations of animal populations and a measure of community stability. Ecology, 36(3), 533-536.
Marton, J. M., Creed, I. F., Lewis, D. B., Lane, C. R., Basu, N. B., Cohen, M. J., & Craft, C. B. (2015). Geographically isolated wetlands are important
biogeochemical reactors on the landscape. Bioscience, 65(4), 408-418.
Meli, P., Benayas, J. M. R., Balvanera, P., & Ramos, M. M. (2014). Restoration enhances wetland biodiversity and ecosystem service supply, but results are context-dependent: A meta-analysis. Public Library of Science
ONE, 9(4), e93507.
Millennium Ecosystem Assessment (MEA). (2005). Ecosystems and Human Well-Being: Wetlands and Water. Synthesis. World Resources Institute, Washington, DC. 68 p.
Mitchell, R. J., Auld, M. H., Le Duc, M. G., & Robert, M. H. (2000). Ecosystem stability and resilience: A review of their relevance for the conservation management of lowland heaths. Perspectives in Plant Ecology, Evolution and Systematics, 3(2), 142-160.
Mitsch, W. J., & Gosselink, J. G. (2007). Wetlands. John Wiley & Sons, NY. 456 p.
Moor, H., Rydin, H., Hylander, K., Nilsson, M. B., Lindborg, R., & Norberg, J. (2017). Towards a trait‐based ecology of wetland vegetation. Journal of
Ecology, 105(6), 1623-1635.
Moreno-Mateos, D., Power, M. E., Comín, F. A., & Yockteng, R. (2012).
Structural and functional loss in restored wetland ecosystems. Public Library
of Science Biology, 10(1), e1001247.
Mulhouse, J. M. & Galatowitsch, S. M. (2003). Revegetation of prairie pothole wetlands in the mid-continental US: Twelve years post-reflooding. Plant
Ecology, 169, 143–159.
Naeem, S. (2006). Biodiversity and ecosystem functioning in restored ecosystems: Extracting principles for a synthetic perspective. In
Foundations of Restoration Ecology. Island Press, Washington, DC. p. 210-237.
Palmer, M. A., Zedler, J. B., & Falk, D. A. (2006). Ecological theory and
restoration ecology. In Foundations of Restoration Ecology . Island Press, Washington, DC. p. 3-26
Rubec, C. D., & Hanson, A. R. (2009). Wetland mitigation and compensation: Canadian experience. Wetlands Ecology and Management, 17(1), 3-14.
Sciences, 164(S3), S143-S164.
Ruiz-Jaén, M. C., & Aide, T. M. (2005). Vegetation structure, species diversity, and ecosystem processes as measures of restoration success. Forest
Ecology and Management, 218(1-3), 159-173.
Scheffer, M., Carpenter, S., Foley, J. A., Folke, C., & Walker, B. (2001) Catastrophic shifts in ecosystems. Nature, 413(6856), 591-596.
Tiner Jr, R. W. (1984). Wetlands of the United States: Current status and recent trends. United States Fish and Wildlife Service. 59 p.
Tiner, R. (2003). Geographically isolated wetlands of the United States.
Wetlands, 23(3), 494-516.
van der Valk A. G. (2005). The prairie potholes of North America. In: Fraser LH, Keddy P. A. (eds.) The world’s largest wetlands: ecology and conservation. Cambridge University Press, Cambridge, p. 393–423
Violle, C., Navas, M. L., Vile, D., Kazakou, E., Fortunel, C., Hummel, I., &
Garnier, E. (2007). Let the concept of trait be functional! Oikos, 116(5), 882-892.
Wali, M. K. (1999). Ecological succession and the rehabilitation of disturbed terrestrial ecosystems. Plant and Soil, 213(1-2), 195-220.
Walker, B. H. (1992). Biodiversity and ecological redundancy. Conservation Biology, 6(1), 18-23.
Westoby, M., Walker, B., & Noy-Meir, I. (1989). Opportunistic management for rangelands not at equilibrium. Journal of Range Management, 42(4), 266-274.
Young, T. P. (2000). Restoration ecology and conservation biology. Biological
Conservation, 92(1), 73-83.
Young, T. P., Petersen, D. A., & Clary, J. J. (2005). The ecology of restoration: Historical links, emerging issues and unexplored realms. Ecology Letters, 8(6), 662-673.
Zedler, J. B. (2000). Progress in wetland restoration ecology. Trends in Ecology
& Evolution, 15(10), 402-407.
Zedler, J. B., & Kercher, S. (2005). Wetland resources: Status, trends, ecosystem services, and restorability. Annual Reviews in Environmental Resources, 30,
39-74.
Zirbel, C. R., Bassett, T., Grman, E., & Brudvig, L. A. (2017). Plant functional traits and environmental conditions shape community assembly and
ecosystem functioning during restoration. Journal of Applied Ecology, 54(4),
1070-1079.
2 Chapter 2. Incomplete Recovery of Plant Diversity in
Restored Prairie Wetlands on Agricultural Landscapes
2.1 Introduction
Wetlands provide many important ecosystem services, such as carbon sequestration (Mitsch et al. 2013), flood and drought control (Rains et al. 2016), and water quality improvement (Marton et al. 2015). Furthermore, wetlands are biodiversity hotspots and support many species at risk (Calhoun et al. 2017) as well as half of North America’s waterfowl population (Junk et al. 2013). Yet, wetlands are at risk of degradation and loss from land conversion activities, with recent global estimates of wetland area loss ranging between 54-57% (Davidson 2014). While these vulnerable waters continue to be threatened (Creed et al. 2017), habitat restoration is increasingly being used as a strategy to reverse historical and on-going wetland losses and degradation.
The practice of wetland restoration has grown rapidly in response to increasing land development, natural habitat degradation, and understanding of the ecological importance of these systems. The recovery of wetland vegetation follows a complex successional trajectory, where rather than expecting to see predictable plant community development characterized by annuals dominating first, followed by herbaceous perennials, and eventual colonization of woody perennials (trees and shrubs) (Noon 1996), it is anticipated that the plant community will be determined by the seeds and propagules present in the remnant seedbank (Galatowitsch & Van der Valk 1996), and the dispersal and colonization abilities of incoming species (Zedler 2000).
Evidence suggests that it is not uncommon for a restored wetland to deviate from its expected recovery path (Suding 2011; Moreno-Mateos et al. 2012). Once a system is degraded, new abiotic and biotic conditions can develop where
macroinvertebrates, and plant assemblages, though mostly driven by the latter) was on average 26% lower in restored wetlands than natural wetlands, even a century post-restoration. This shows that while a number of ecological theories interplay in the restoration of a wetland system (including successional theories, dispersal limitation, and disturbance theory to name a few, see Zedler 2000), restored wetlands are not reaching their natural state equivalent.
The goal of most wetland restoration efforts is to return the degraded ecosystem back to its ‘pre-disturbed’ state (Hobbs & Harris 2001); however, in most cases, restored wetlands are unlikely to reach a natural reference condition (Moreno-Mateos et al. 2012). This has led to a need to view restored wetlands as novel ecosystems that have been driven and influenced by human action and environmental change, resulting in ecosystems that are characterized by species in combinations or relative abundances not previously observed within natural reference systems (Hobbs et al. 2006). While controversy exists over the utility and management implications of novel ecosystems (Miller & Bestelmeyer 2016), many researchers think that the novel ecosystem concept provides a way forward for managing wetland ecosystems in a landscape fraught with environmental and anthropogenic change and associated legacy effects. Nevertheless, most
restoration efforts are still focused on achieving similarity to a given reference state (Hallet et al. 2013), and many restoration practitioners use history as a guide to select reference benchmarks for restoration (Hallet et al. 2013; Higgs et al. 2014). Consideration must be given to the natural history of the surrounding landscapes and historic impacts on reference and restoration sites because they can have major implications on determining restoration success.
plant structural diversity in restored prairie wetlands is rapid (i.e., equivalence between restored and natural reference is achieved within a few growing seasons). The second hypothesis was that wetland morphology (i.e., area, shape, slope, and perimeter to area ratio) influences plant structural diversity potential. These hypotheses were tested within the Prairie Pothole Region, an area that has been traditionally agriculturally intensive, heavily impacted by wetland loss, and where wetlands are predicted to be profoundly affected by climate change (Rashford et al. 2016).
2.2 Methods
2.2.1 Study area
The study was conducted on geographically isolated wetlands (wetlands surrounded completely by upland with no obvious surficial connection to another wetland) in the Central Parkland ecoregion of Alberta, Canada (Figure 2.1). The mean annual temperature of the region is 2.6 °C and the climate is characterized by warm summers and cold winters based on Canadian Climate Normals
Figure 2.1. Location of study sites used to assess structural recovery in restored wetlands. The study area includes 18 restored wetlands, 8 natural wetlands, and 3 drained wetlands located in Alberta, Canada.
In the Prairie Pothole Region, wetlands can be classified by the vegetation occupying the central or deepest part of the wetland. Temporary wetlands are characterized by a central zone represented by fine stemmed grasses and sedges whereas seasonal wetlands are defined by a central zone dominated by coarse grasses, sedges, and associated forbs (Stewart & Kantrud 1971).
Restored temporary and seasonal wetlands were selected from properties owned by Ducks Unlimited Canada (DUC), and ranged in size from 0.06 to 1.06 ha (Table B1). This range in sizes reflected the dominant size class of wetlands in this prairie region (Serran & Creed 2016), as well as the dominant size class of restored wetlands in the Parkland ecoregion (DUC 2016). The chronosequence approach, where study sites are selected that have similar attributes but are of different ages, is a reliable method to study temporal dynamics of plant
approach for tracking vegetation recovery within restored wetlands. This study included a chronosequence of 29 wetlands that included drained, restored (ranging between 3 and 24 years since restoration), and natural reference wetlands. Drained wetlands (n=3) were actively being cultivated at the time of sampling, and included two wetlands that were completely drained and one wetland with incomplete drainage. The restored wetlands were further
categorized into age classes: 3-5 years since restoration (5 wetlands), 6-10 years since restoration (5 wetlands), 11-15 years since restoration (5 wetlands), and >20 years since restoration (3 wetlands). Additionally, the natural reference wetlands were further classified as “natural agriculture” (Nat(Ag), n=3) and “natural reserve” (Nat(Res), n=5). The natural agriculture wetlands had not been impacted by historical drainage and were located within the same parcels as one of the restored wetlands. Land use surrounding the natural agriculture wetlands has historically included cultivation and livestock grazing, and given the proximity between the Nat(Ag) and the restored wetlands, land management practices adjacent to these wetlands was assumed to be comparable. The natural reserve wetlands were situated within the Cooking Lake – Blackfoot Provincial Recreation Area where surrounding land use has historically included recreation such as hiking, horseback riding, and cycling, as well as livestock grazing. These natural reserve wetlands and the surrounding landscape may have been subjected to other historical and contemporary disturbances, including weed control measures and other management activities; however, specifics are unknown.
Wetlands were restored by DUC via construction of an earthen berm across drainage ditches to restore the hydrology of the wetland basin. No hydrophytes or aquatic plants were planted or seeded within restored wetland basins, and as such, the flora reflected natural colonization from seed banks or dispersal.
However, following construction, earthen berms were often seeded with an equal portion of grass seed mix containing Bromus riparius (meadow brome), Medicago
sativa (alfalfa), Schedonorus arundinaceus (tall fescue), and Elymus trachycaulus
(slender wheatgrass), and Hordeum vulgare (barley) at a rate of 34 kg per
weeds (R. Hunka, DUC, personal communication, 3 January 2017). Glyphosate spot treatment and periodic mowing were conducted in uplands surrounding restored wetlands to control the spread of weeds, particularly Cirsium arvense
(Canada thistle). While land use practices surrounding restored wetlands varied among grazing, haying, or left idle based on DUC’s land management goals and objectives, these differences were not considered as part of this study, since these activities were scheduled for later in the season and after field sampling was completed.
2.2.2 Sampling
In 2016, wetlands were delineated in the field based on hydrophytic vegetation and hydric soil indicators. While boundary delineations can often be easily determined using vegetation indicators, soil indicators can identify
seasonally saturated conditions and provide a better determinant of soil
saturation and wetland conditions than vegetation alone (Government of Alberta 2015). Hydric soil indicators common of the soils in the study area can include a deep organic soil layer, redoximorphic features such a depletion of color of the soil (gleying) within 30cm of the surface, and/or oxidized rhizospheres, identified as a red color located within plant root pores resulting from oxidation of reduced iron when soil moisture drops (Government of Alberta 2015).
In both 2016 and 2017, each wetland was visited and sampled once
between June and August. This timeframe corresponds to peak growing season in the region. In 2016, the majority (25) of wetlands were sampled between June 1 and July 1, including all drained, all restored, all Nat(Ag) and one Nat(Res) wetland. The remaining four Nat(Res) wetlands were sampled between July 10 and Aug 10 due to permitting and access constraints. In 2017, all wetlands were sampled between June 19 and August 15, with the majority of sampling (21 sites) conducted in July, as a result of significant standing water present in wetlands at the beginning of the sampling season.
vegetation zones (Little 2013). Wetland zonation is typical of prairie wetlands, where rings of distinct vegetation communities are observed resultant from the hydrologic gradient found within wetlands (Stewart & Kantrud 1971). Square meter quadrats were randomly placed along four transects that were oriented at 90° from each other, and within each quadrat all herbaceous vegetation was sampled. Following a species accumulation analysis, eight quadrats per
vegetation zone was determined to be the optimum sampling effort for a variety of wetland size classes assessed in this study. As such, total number of quadrats sampled per wetland ranged from 6 – 30 quadrats depending on the size of wetland and number of vegetation zones present. All species within a quadrat were identified and percent cover was estimated using an 8-point cover classification system (Mueller-Dembois & Ellenberg 1974). A random walk through was also conducted within each wetland to record any rare species, species occurring in patches, or species not previously identified through quadrat sampling (Mueller-Dembois & Ellenberg 1974).
2.2.3 Plant Diversity
Wetland plant diversity was measured in several ways. First, the average percent cover of hydrophytes, native species, and non-native species were calculated for each wetland by taking the midpoint value of each cover class range for each quadrat sampled. All species detected were assigned a wetland indicator status (WIS) based upon the National Wetland Plant List (Lichvar et al. 2016; U.S. Army Corps of Engineers 2016). All species designated as facultative, facultative wetland, and obligate wetland species were classified as hydrophytes. Native status was assigned as per the Alberta Conservation Information
following methods by Colwell et al. (2012). Rarefaction allows for the interpolation of species richness estimates at a lower effort than was conducted in the field, whereas extrapolation allows the estimation of species richness beyond the original sampling intensity. Species richness within each wetland was estimated for 12 quadrats per wetland, and species data collected during quadrat sampling was used to calculate richness estimates using either rarefaction or extrapolation curves. Finally, all species identified within a wetland (i.e., species observed during quadrat sampling and the random walk through) were used in for a community composition analysis. The Sørensen Index was used to estimate similarity in community composition as a distance measure between wetlands (Sørensen 1948). Sensitive species identified as plants with relatively small distributional ranges, small population sizes, or occurrences of ≤100 in Alberta (ACIMS 2015) were excluded from the analysis to remove unnecessary variability in the data (McCune & Grace 2002).
2.2.4 Morphology
Wetland morphometries were derived from the wetland field delineations conducted in 2016 and included area, slope, perimeter-to-area ratio, and shape. Slope was estimated as the mode within each wetland determined from a
hydrologically corrected 25 m digital elevation model (Alberta Environment and Parks 2008) that was resampled to generate a 5 m grid in ArcGIS Desktop 10.4 (ESRI, Redlands, CA). Shape was measured as the departure from a circular shape (McGarigal & Marks 1995).
2.2.5 Statistical Analysis
Analysis of variance (ANOVA) was used to compare structural metrics. Where wetland area was correlated to plant diversity metrics, analysis of covariance (ANCOVA) was used to control for wetland area (i.e., for percent cover of hydrophytes and native species, as well as species richness). All figures present estimated marginal means at a constant wetland area of 0.378 ha, in an effort to remove the influence of wetland area on metric results. This wetland area represents the average size of wetlands assessed in the study.
QQ plots, the Shapiro-Wilk normality test, Bartlett’s test, and two-way ANOVA with an interaction term to ensure homogeneity of variance, normality of
residuals, and homogeneity of regression slopes. Spearman rank correlation was used to assess the relationship between plant diversity metrics and wetland morphometrics. Pairwise comparisons were conducted using the Sidak test. ANCOVA was performed in SPSS version 24 (IBM Corp, Armonk, NY, U.S.A.) at a significance level of 0.05.
A nonmetric multidimensional scaling (NMDS) was performed using the Sørensen Index to assess differences in community composition, as the data were nonlinear. NMDS was run iteratively until a stable solution was achieved with a recommended goodness of fit below 0.2 (Clarke 1993; McCune & Grace 2002). Wetland area, perimeter-to-area ratio, shape, slope, and wetland age classes were fitted on the ordination to determine correlation with community composition. Morphometric variables were standardized prior to running the ordination to ensure a mean of 0 and standard deviation of 1. NMDS analysis and variable fitting were performed in R using metaMDS() and envfit() functions in the vegan package (Oksanen et al. 2017; RStudio, Boston, MA, U.S.A.). Significant differences in community composition were tested using PERMANOVA in Primer Version 7 (Clarke & Gorley 2015).
2.2.6 Precipitation and Climate
An analysis of precipitation across sampling years was conducted in an effort to explain some variability among years. Spatial climate models derived for North America were used to interpolate daily precipitation values from October 2015 through September 2017 (McKenney et al. 2011). Further, 30-yr climate normal (1987 - 2017) for a centralized point within the study area (township 49, range 20, W4M) was determined from data retrieved from the Alberta Climate Information Service (ACIS 2018).
2.3 Results
species were only observed in 2016, whereas an additional 10% of species were only identified in 2017. 90 species were observed in 5 wetlands or less whereas 42 species were observed in at least 50% of all study sites. The species most frequently observed across wetlands include Cirsium arvense (observed in 29 wetlands), Poa palustris (28 wetlands), Poa pratensis (27 wetlands), Taraxacum
officinale (27 wetlands), Sonchus arvensis (26 wetlands), Carex atherodes (26
wetlands), and Eleocharis palustris (26 wetlands).
2.3.1 Effect of Age on Wetland Recovery
ANCOVA revealed a significant difference in percent cover of hydrophytic
species among wetland age groups in 2016 (F(6,21) = 2.741, p = 0.040, partial 2 = 0.439, observed power = 0.753) (Table 2.1; Figure 2.2A). Given a constant
wetland size of 0.378 ha, drained wetlands had a lower percent cover of
hydrophytic species (13.23 ± 10.44) when compared with wetlands restored 3-5 years (45.06 ± 7.85), 6-10 years (57.55 ± 8.23), 11-15 years (33.67 ± 7.65), 20-30 years (34.75 ± 9.92), agricultural natural wetlands (26.92 ± 11.25), and natural reserve wetlands (47.23 ± 8.19). Pairwise comparisons suggested that drained wetlands have significantly lower hydrophytic cover than wetlands restored 6-10 years (p = 0.0268), otherwise no significant differences were observed in percent cover of hydrophytic species. Similarly, there was a significant difference in percent cover of native species among age groups in 2016 as determined by
ANCOVA (F(6,21) = 3.293, p = 0.019, partial 2 = 0.485, observed power = 0.838) (Table 2.1; Figure 2.2B). Drained wetlands had a lower percent cover of native species (9.07 ± 9.99) when compared with wetlands restored 3-5 years (44.66 ± 7.51), 6-10 years (58.47 ± 7.88), 11-15 years (36.78 ± 7.33), 20-30 years (36.80 ± 9.50), agricultural natural wetlands (34.04 ± 10.77), and natural reserve
there was a high cover of bare ground in all drained wetlands as a result of recent and regular cultivation activities, which accounts for low total (hydrophytes,
native, and non-native species) cover observed within these wetlands.
Table 2.1. Raw mean values ±SE of structural metrics in 2016, represented by age class. Cover values represent mean cover within a wetland based on quadrat sampling. Species richness is an estimate at 12 quadrats sampled. Nat(Ag) represents natural wetlands on agricultural landscapes and Nat(Res) represents wetlands located within a natural reserve.
Average Size (ha)
Sample
Size Hydrophytes Cover Natives Cover Cover Non-natives Estimated Species Richness Mean SE Mean SE Mean SE Mean SE Drained 0.12 3 6.11 6.07 2.39 2.35 16.89 1.08 12.33 1.67
Age 3-5 0.25 5 41.40 5.26 41.23 4.75 13.99 6.02 28.60 1.66
Age 6-10 0.15 5 51.16 8.13 52.47 8.00 11.56 3.53 24.60 1.86
Age 11-15 0.38 5 33.83 10.59 36.93 10.07 12.29 3.11 21.00 5.36
Age 20-30 0.45 3 36.71 12.95 38.64 13.58 13.66 4.27 22.00 0.58
Nat(Ag) 0.60 3 38.31 15.03 44.73 13.78 9.89 4.78 28.33 3.48
Figure 2.2. Estimated marginal means (± SE) of (A) percent cover of hydrophytes, (B) percent cover of native species, and (C) percent cover of non-native species across a chronosequence of restored wetlands at a standard wetland size of 0.378 ha as observed in 2016. Age 0 represents drained wetlands, Nat(Ag) represents natural wetlands on agricultural landscapes, and Nat(Res) represents wetlands located within a natural reserve. Different letters indicate significant differences.
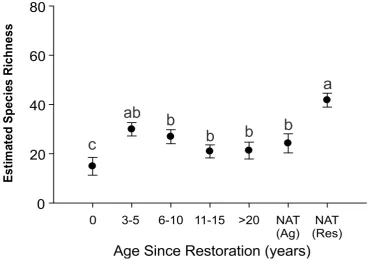
ANCOVA indicated species richness in 2016 was significantly different
age classes 6-10 years (p = 0.0303), 11-15 years (p = 0.0004), 20-30 years (p = 0.0021), and agricultural natural wetlands (p = 0.010) (Table 2.1; Figure 2.3).
Figure 2.3. Estimate species richness (+/- SE; estimated marginal means at a constant wetland size of 0.378 ha) across a chronosequence of restored wetlands assessed in 2016. Age 0 represents drained wetlands, Nat(Ag) represents natural wetlands on agricultural landscapes, and Nat(Res) represents wetlands located within a natural reserve. Different letters indicate significant differences.
The NMDS ordination of community composition in 2016 revealed three community clusters (Figuer 2.3). Drained wetlands separated from the other wetland classes along the first axis, natural reserve wetlands separated along the second axis, and restored wetlands showed convergence in community
(p = 0.007), 20-30 years (p = 0.013), and agricultural natural wetlands (p = 0.045). The NMDS iterative algorithm stopped after 20 random starts and provided a solution with a stress of 0.15 indicating a good representation of the underlying structure.
2.3.2 Effect of Morphology on Recovery
In 2016, wetland size and slope had a significant effect on wetland recovery (Table 2.2). Wetland area was positively correlated with species richness (r = 0.474, p = 0.009), percent cover of hydrophytes (r = 0.414, p = 0.025) and natives (r = 0.429, p = 0.020), but not percent cover of non-native species (r = 0.099, p= 0.608). On the other hand, wetland slope was positively correlated with percent cover of non-native species (r = 0.456, p = 0.013) (Table 2.2). Wetland perimeter-to-area ratio and shape had no significant association with structural diversity metrics in 2016 (Table 2.2).
Table 2.2. Spearman rank correlation values between wetland morphometrics and plant structural diversity metrics in 2016. Significant (α =0.05) correlations are bolded and p-values are provided in parentheses.
Plant Diversity Metrics Area (ha) Perimeter-to-areaRatio (m-1) Shape (% rise)Slope
Species Richness (0.009) 0.474 (0.0751) -0.335 (0.321) 0.190 (0.624) 0.094
Percent cover Hydrophytes (0.025) 0.414 (0.175) -0.258 (0.063) 0.349 (0.942) -0.014
Percent cover Natives (0.020) 0.429 (0.151) -0.272 (0.066) 0.345 (0.720) -0.069
Percent cover Non-natives 0.099 (0.608)
0.001 (0.995)
0.054 (0.780)
0.456 (0.013)
Wetland area (r2 = 0.287, p = 0.013) and perimeter-to-area ratio (r2 = 0.248, p = 0.022) significantly (but weakly) explained dissimilarity in community
composition among sites. Perimeter to area ratio fitted on the NMDS of
Figure 2.5. Perimeter to area ratio (P:A) fitted on NMDS ordination of community
composition in 2016.The centre point of arrows represent the mean P:A of wetlands, and the direction of arrows represent general morphometries of wetlands, where natural wetlands were associated with smaller P:A ratios and drained wetlands were associated with larger perimeter to area ratios.
Figure 2.6. Morphometries of study wetlands. Wetlands are identified by a letter
representing type of wetlands (R= restored, D = drained, N = Nat(Ag), and P = Nat(Res)) and a number representing wetland number (in the case of drained and all natural sites) or age (in the case of restored wetlands). When more than one restored wetlands were of the same age they were further distinguished by a lower case letter (a – d).
2.3.3 Effect of Annual Variability on Structural Metrics
All wetlands were re-assessed in 2017, and structural metrics were
analyzed. Results suggest, in general, native cover and hydrophyte cover were higher in 2017 when compared to 2016 (Figure 2.7A and 2.7B, respectively). All restored and natural wetlands contained average native and hydrophyte covers between approximately 60% and 80% cover. Drained wetlands had lower
compared to wetlands Age 3-5 (10 %), Age 11-15 (4.5 %), Age >20 (6.2 %), and Nat(Ag) wetlands (6.2 %) (F(6,21) = 3.0891, p = 0.02501). No significant
differences were observed across the chronosequence when analyzing cover of natives (F(6,21) = 2.3003, p = 0.073) or cover hydrophytes (F(6,21) = 2.2836, p = 0.075).
When comparing species richness between years, 2017 had higher estimated species richness in every age class, with the exception of Nat(Res) wetlands (Figure 2.7D). Nat(Res) had 38 species in 2017 compared to 42 species in 2016. ANOVA suggests that in 2017, no significant differences were observed in estimated species richness at 12 quadrats across wetland age classes (F(6,21) = 2.0254, p = 0.1073).
Figure 2.7. Structural diversity metrics (± SE) compared between 2016 and 2017. 2016 values are estimated marginal means, whereas 2017 values are raw values. (A) percent cover of native species, (B) percent cover of hydrophytes, (C) percent cover of non-native species and (D) estimated species richness at 12 quadrats. Age 0 represents drained wetlands, Nat(Ag) represents natural wetlands on agricultural landscapes, and Nat(Res) represents wetlands located within a natural reserve.
A B
When analyzing community composition among wetlands in 2017, a similar differentiation of the species that comprise drained wetlands was observed. Drained wetlands separate along the x-axis from restored and natural wetlands as was observed in 2016. However, the community composition of natural
wetlands in natural reserves was not distinctly different from restored and Nat(Ag) wetlands, as was the case in 2016 (Figure 2.8). PERMANOVA confirmed
differences in community composition among wetlands (pseudo-F(6,21) = 2.90, p = 0.001).
Figure 2.8. NMDS of community composition as assessed in 2017. Wetlands are grouped by restoration age classes represented by polygons. Nat(Res) represents natural wetlands in natural reserves and Nat(Ag) represent natural wetlands on agricultural landscapes (stress = 0.16).
2.3.4 Comparison Precipitation Between Sampling Years
approximately 80 mm more precipitation than average. The cumulative
precipitation in 2017 was slightly higher than the 30-yr normal for the first half of the growing season (early July), after which cumulative precipitation values were slightly less than the 30-yr normal.
Figure 2.9. Comparison of cumulative precipitation in 2016, 2017, and to the 30-year precipitation normal over the growing season for a centrally located point within the study area.
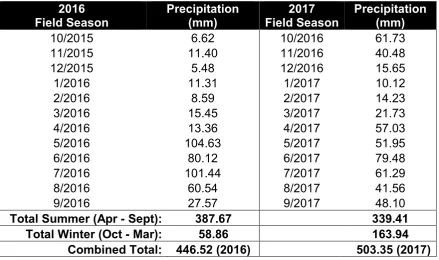
Table 2.3. Monthly water year precipitation compared between 2016 and 2017. Water year is defined from October through September of the following year.
2016 Field Season
Precipitation (mm)
2017 Field Season
Precipitation (mm)
10/2015 6.62 10/2016 61.73
11/2015 11.40 11/2016 40.48
12/2015 5.48 12/2016 15.65
1/2016 11.31 1/2017 10.12
2/2016 8.59 2/2017 14.23
3/2016 15.45 3/2017 21.73
4/2016 13.36 4/2017 57.03
5/2016 104.63 5/2017 51.95
6/2016 80.12 6/2017 79.48
7/2016 101.44 7/2017 61.29
8/2016 60.54 8/2017 41.56
9/2016 27.57 9/2017 48.10
Total Summer (Apr - Sept): 387.67 339.41
Total Winter (Oct - Mar): 58.86 163.94
Combined Total: 446.52 (2016) 503.35 (2017)
2.4 Discussion
2.4.1 Assessment of Degraded Conditions Prior to Wetland Recovery
On the Canadian prairies, wetland drainage for agricultural production has historically been the main cause of wetland loss (Zedler & Kercher 2005). Thus, assessing the condition of drained wetlands allows for the quantification and characterization of the degraded state of these impacted habitats prior to
restoration. Typically, wetlands are drained through a ditch that is constructed to convey water away from the wetland basin. The duration that a wetland has been drained and completeness of drainage are factors that can influence species richness and community composition of a site (Weinhold & van der Valk 1989).