Scholarship@Western
Scholarship@Western
Electronic Thesis and Dissertation Repository
10-24-2018 10:00 AM
Wearable sensors and total knee arthroplasty: Assessing
Wearable sensors and total knee arthroplasty: Assessing
quantitative function to improve the patient experience
quantitative function to improve the patient experience
Megan Fennema
The University of Western Ontario
Supervisor
Teeter, Matthew G.
The University of Western Ontario
Graduate Program in Medical Biophysics
A thesis submitted in partial fulfillment of the requirements for the degree in Master of Science © Megan Fennema 2018
Follow this and additional works at: https://ir.lib.uwo.ca/etd
Part of the Medical Biophysics Commons, and the Orthopedics Commons
Recommended Citation Recommended Citation
Fennema, Megan, "Wearable sensors and total knee arthroplasty: Assessing quantitative function to improve the patient experience" (2018). Electronic Thesis and Dissertation Repository. 5918.
https://ir.lib.uwo.ca/etd/5918
This Dissertation/Thesis is brought to you for free and open access by Scholarship@Western. It has been accepted for inclusion in Electronic Thesis and Dissertation Repository by an authorized administrator of
Osteoarthritis (OA) is a chronic degenerative disease for which the only long-term solution
is total knee arthroplasty (TKA), though many patients are not satisfied with their TKA.
Satisfaction in TKA patients is not well understood. Subjective questionnaires and
objective functional tests have been previously used to assess TKA outcomes, but both
have disadvantages. Wearable sensors have facilitated affordable biomechanical
measurement in OA and TKA populations. The objective of this work was to use wearable
sensors alongside functional tests with TKA patients to identify quantitative function that
related to subjective function and satisfaction. A wearable sensor-setup was validated
before implementation in a TKA population. Quantitative sensor metrics describing the
motion of individual leg segments was found to correlate with subjective function and
satisfaction. This study provided strong evidence towards the connection between
quantitative function and patient experience and may be able to identify functional
deficiencies for targeted therapy to improve satisfaction.
Keywords
Osteoarthritis, Total Knee Arthroplasty, Orthopedic, Inertial Measurement Units,
Wearable Sensors, Biomechanics, Functional Test, Timed-Up-And-Go Test, Patient
Co-Authorship Statement
The following thesis contains one manuscript that has been submitted for publication
(Chapter 2) and a manuscript that is in preparation for submission to a scientific journal
(Chapter 3). As the first author of these manuscripts, I was a significant contributor to all
aspects of the studies as well as the manuscript preparations. Specific involvement
included: contributions to study design, collection of all data, statistical analysis, clinical
interpretation of data, drafting and final approval of the manuscripts. Dr. Matthew Teeter,
as the principle investigator and my supervisor, provided support throughout the
experimental process and was responsible for the study conceptions and final approval of
study designs, guidance on data interpretation, and editorial insight.
Chapter 2 is an original validation study entitled “Repeatability of measuring knee flexion
angles with wearable inertial sensors” and has been submitted to The Knee in April 2018 and is currently under review. This manuscript was co-authored by Megan C. Fennema,
Riley A. Bloomfield, Dr. Brent A. Lanting, Dr. Trevor B. Birmingham, and Dr. Matthew
G. Teeter. As first author I contributed to manuscript preparation, design and execution of
the study, analysis and interpretation of data, and manuscript preparation. Riley Bloomfield
provided software design of the wearable sensors being validated and assistance with
experiment execution. Dr. Brent Lanting provided guidance on study design. Dr. Trevor
Birmingham provided access to laboratory equipment and guidance on data analysis.
Chapter 3 is an original research article entitled “Novel sensor-instrumented
Timed-Up-and-Go metrics relate to subjective function and satisfaction in TKA patients” and is in
preparation for submission to the Journal of Arthroplasty in 2018. This manuscript was co-authored by Megan C. Fennema, Riley A. Bloomfield, Dr. Douglas D. Naudie, Dr. James
L. Howard, Dr. Brent A. Lanting, and Dr. Matthew G. Teeter. As first author I contributed
to study design, collection and interpretation of data, and manuscript preparation. Riley
Bloomfield provided software and user interface design of wearable sensors and ongoing
technological support. Dr. Douglas Naudie and Dr. Howard provided support through
patient referral. Dr. Brent Lanting provided guidance on study design and support through
Acknowledgments
Firstly, I would like to thank my supervisor, Dr. Matthew Teeter for providing me with the
opportunity to help start up an exciting new research project in his lab. His support,
guidance, and mentorship have been greatly appreciated in developing myself as a trainee
and as a researcher. Starting in his young lab was an unknown, but the lab he has built in
the short amount of time I have been a trainee is a testament to his drive and insane ability
to multitask. I could not imagine a more dependable and hardworking supervisor who will
no doubt bring about positive change to his chosen field in the long career ahead of him.
To my advisory committee, Dr. Brent Lanting and Dr. Trevor Birmingham. Your support,
advice, and perspective provided greater direction to my research and kept my focus on the
big picture. I would also like to thank the surgeons that made my clinical research possible,
Dr. Howard, Dr. Naudie, and Dr. Lanting (again), for their excitement and support for this
research project in their clinics. I am truly grateful to have collaborated with individuals
who are so highly thought of by their coworkers and patients. I would also like to
acknowledge the supplementary financial support granted to me by the Transdisciplinary
Bone & Joint Institute Training Award.
To the members of the Teeter lab both past and present, your teamwork is inspiring, and I
am very happy to have worked with all of you. Riley Bloomfield, your patience, hard work,
and partnership in our research has been invaluable, I could not have done it without you.
Madeleine Van De Kleut, I am glad to have had you to keep me company throughout the
CMHR program. Jordan Broberg, thanks for your quiet humour and mutual love of The
Tragically Hip. Jared Webster, thank you for our chats about life plans after grad school,
they gave me direction. Harley Williams, your pep and positive nature made working with
you very easy and I am glad to have had that opportunity. Max Perelgut, I enjoyed your
loud humour as much as Jordan’s quiet humour, thank you for the laughs. Rudy Baronette,
I originally asked you about your experience in this lab before I joined, thank you for
helping make the decision easy, and for occasionally scoring some goals in soccer. Mike
Lavdas, you have been a great addition to the Teeter lab in the past few months I have
I was working on the robot, and I agree that Matt should try bubble tea. I must also thank
the co-op, summer, and volunteering students who I have met and who have made
contributions to this lab: Jacob Wihlidal, Jeff Kim, Nirmit Shah, Fay Zhuang, Taran
Schubert, Katherine Goss, Neha Sam, and Kimberly Lam Tin Cheung.
To everyone at Robarts who has made this degree a positive experience, thank you for your
friendship. Eric Lessard, I genuinely enjoyed your jokes, but I think that means I have a
terrible sense of humour; please also thank Amanda for me for knocking you down a peg
when desperately needed. Amy Schranz, thank you for wanting to talk about dogs as much
as I do and for being the kind of person that I can truly be myself around. Olivia Stanley,
for continuously teaching me new things about subjects you are passionate about. Heather
Young, thanks for both the lighthearted and thought-provoking chats. Derek Gillies, I
always appreciate your sarcasm, deadpan delivery, and friendship. Rachel Eddy, I admire
your powerful attitude, you’ve taught me to care less about others’ opinions. Thanks also
to Dickson Wong, Jason Kai, Lisa Hur, Dante Capaldi, Khadija Sheikh, as well as everyone
at coffee time for making my time at Robarts memorable.
Finally, and most importantly, I would like to thank my family and friends for all their love
and support. To my parents, Don and Christine, thank you for teaching me to love learning.
To my brothers, Ryan and Kyle, you two were my friends before anyone else and I’m proud
of the men you are becoming. Emily and Diana, thank you for your encouragement, laughs,
and friendship for life. Most importantly, I would like to thank my partner, who has
supported me throughout every obstacle in my adult life. Jordan, the last decade has seen
a lot of growth between the two of us and I cannot wait to see the people we grow to be in
Table of Contents
Abstract ... i
Co-Authorship Statement... ii
Acknowledgments... iii
Table of Contents ... v
List of Tables ... viii
List of Figures ... ix
List of Appendices ... x
List of Abbreviations ... xi
Chapter 1 ... 1
1 Introduction ... 1
1.1 Osteoarthritis ... 1
1.1.1 Osteoarthritis Pathophysiology ... 1
1.1.2 Physical Burden ... 1
1.1.3 Economic Impact ... 2
1.2 Total Knee Arthroplasty ... 2
1.2.1 Knee Anatomy & Biomechanics ... 2
1.2.2 TKA Procedure ... 4
1.2.3 TKA Outcomes ... 5
1.3 TKA Assessment Tools ... 5
1.3.1 Surgeon Assessment ... 5
1.3.2 Patient Reported Outcome Measures ... 6
1.3.3 Functional Tests ... 7
1.3.4 3D Motion Capture Laboratories ... 8
1.4 Thesis Objectives and Hypotheses ... 9
1.5 References ... 10
Chapter 2 ... 14
2 Repeatability of measuring knee flexion angles with wearable inertial sensors ... 14
2.1 Introduction ... 14
2.2 Methods... 15
2.2.1 Robot & Phantom Setup ... 15
2.2.2 Motion Capture Modalities ... 16
2.2.3 Experimental Procedure ... 18
2.2.4 Data Processing ... 19
2.3 Results ... 20
2.4 Discussion ... 25
2.5 References ... 29
Chapter 3 ... 30
3 Novel sensor-instrumented Timed-Up-and-Go metrics relate to subjective function and satisfaction in TKA patients ... 30
3.1 Introduction ... 30
3.2 Methods... 31
3.2.1 Study Design ... 31
3.2.2 Patient Procedure ... 31
3.2.3 Sensor Setup... 32
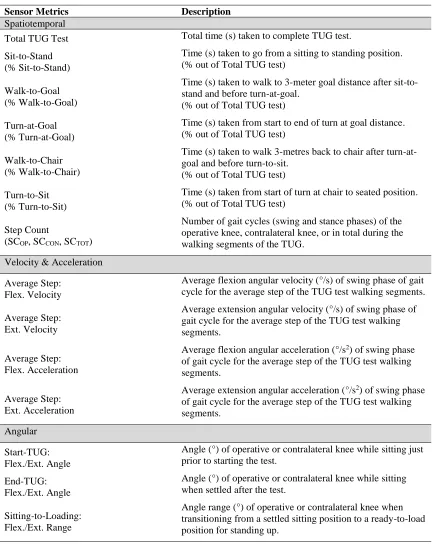
3.2.4 Sensor Metrics ... 32
3.2.5 Statistical Analysis ... 35
3.3 Results ... 35
3.4 Discussion ... 41
Chapter 4 ... 49
4 Conclusions and Future Directions ... 49
4.1 Overview of Objectives ... 49
4.2 Summary of Results ... 49
4.3 Future Directions ... 50
4.3.1 Continuation of TKA Studies ... 50
4.3.2 At-Home Monitoring ... 51
4.3.3 Classification through Machine Learning ... 51
4.4 Conclusions ... 52
4.5 References ... 53
List of Tables
Table 1: Mean ± standard deviation (SD) and 95% confidence intervals (CI) of maximum
flexion in degrees for each test and each modality. ...24
Table 2: Mean ± standard deviation (SD) and 95% confidence intervals (CI) of minimum
flexion in degrees for each test and each modality. ...24
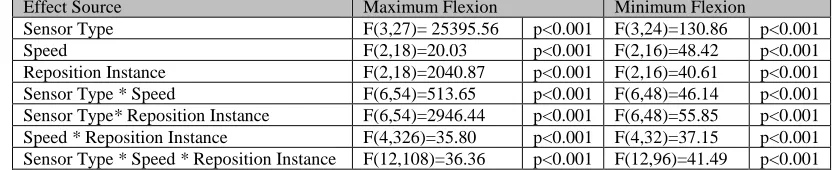
Table 3: F(dfeffect source, dferror) and p values for factors affecting maximum and
minimum flexion of leg phantom. ...24
Table 4: List of sensor metrics and descriptions. ...33
Table 5: Spearman (ρ) correlation matrix of PROMs versus temporal sensor metrics.
Moderate or greater correlations are denoted in bold and insignificant correlations are not
shown. ...36
Table 6: Spearman (ρ) correlation matrix of PROMs versus selected sensor metrics.
Moderate or greater correlations are denoted in bold and insignificant correlations are not
shown. ...37
Table 7: Mean ± standard deviation values of PROMs and sensor metrics significantly
different between BMI groups. ...38
Table 8: Mean ± standard deviation values of PROMs and sensor metrics significantly
List of Figures
Figure 1: Ligaments and menisci of the knee. ... 3
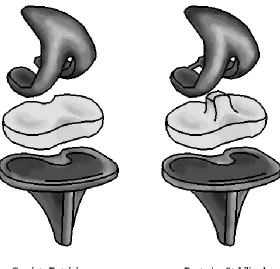
Figure 2: Cruciate retaining and posterior stabilized knee implants. ... 5
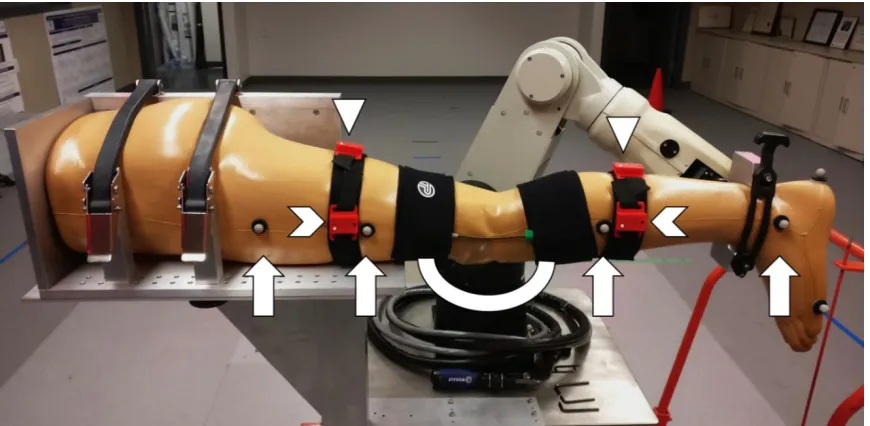
Figure 3: Experimental setup of the motion capture modalities on the leg phantom. ... 18
Figure 4: Motion pathway of the robotic leg phantom during each individual test. ... 19
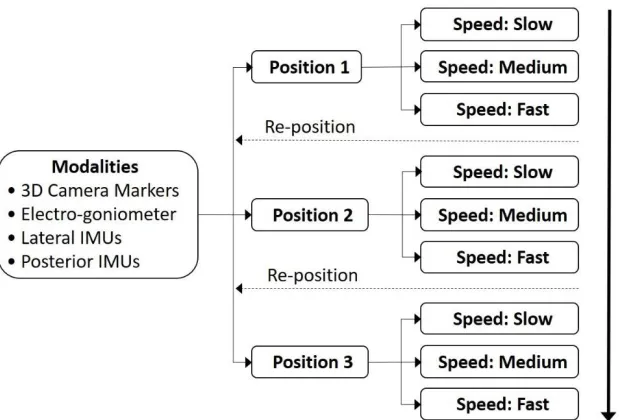
Figure 5: This flow chart depicts the experimental flow of the nine robot tests. ... 19
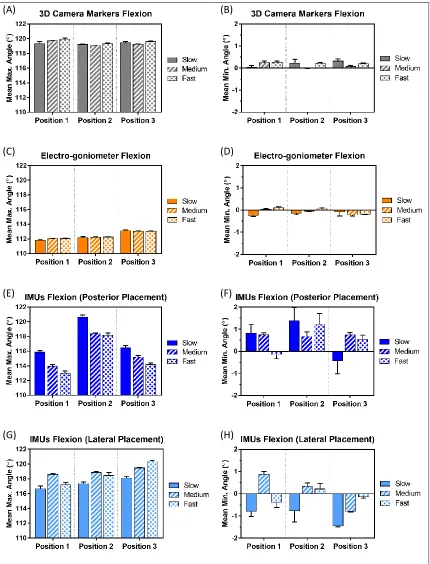
Figure 6: This composite figure depicts the mean angles measured by each modality during each of the nine tests, where A, C, E, and G are maximum flexion angles, and B, D, F, and H are minimum flexion angles of the 3D motion capture camera markers, electro-goniometer, posterior IMU setup, and lateral IMU setup, respectively. ... 22
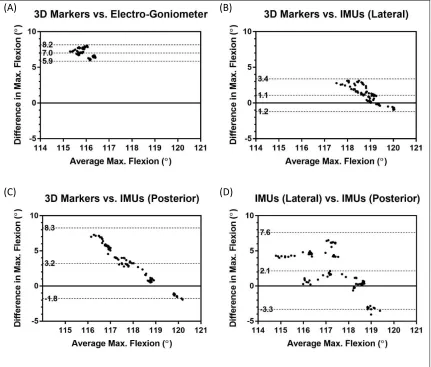
Figure 7: Bland-Alman plots of the maximum flexions for the different sensing modalities vs. the 3D camera markers (A-C), and the Lateral IMU setup vs. the Posterior IMU setup (D). Hashed lines denote the lower 95% limit of agreement, bias, and upper 95% limit of agreement. ... 23
Figure 8: Wearable sensors (closed and open cases) with quarter for scale. ... 32
List of Appendices
Appendix A: PROMs and Sensor Metrics Table of Values ...55
Appendix B: Correlations of PROMs and Sensor Metrics ...57
Appendix C: UCLA Activity Score Questionnaire ...62
Appendix D: Short Form-12 (SF-12) Questionnaire ...63
Appendix E: Western Ontario and McMaster Universities Osteoarthritis Index (WOMAC) Questionnaire ...64
Appendix F: Knee Society Score (KSS) Questionnaire ...65
Appendix G: Health Science Research Ethics Board Approval Notice ...71
List of Abbreviations
3D Three Dimensional
AAD Additive Angular Displacement ACL Anterior Cruciate Ligament ANOVA Analysis of Variance
ASTM American Society for Testing and Materials AUC Area Under Curve
BMI Body Mass Index CI Confidence Interval CR Cruciate Retaining
DMOAD Disease Modifying Osteoarthritis Drug IMU Inertial Measurement Unit
ISO International Standards Organization KSS Knee Society Score questionnaire LCL Lateral Collateral Ligament MCL Medial Collateral Ligament M:F Male to Female ratio CON Contralateral-limb OA Osteoarthritis OP Operative-limb
PCL Posterior Cruciate Ligament
PROM(s) Patient Reported Outcome Measure(s) PS Posterior Stabilized
ROC Receiver-Operator Characteristic (eg. ROC curve) SAAD Average Step Additive Angular Displacement
SC Step Count
SD Standard Deviation
SEM Standard Error of Measurement SF-12 Short Form 12 questionnaire
TAAD Total TUG Additive Angular Displacement TKA Total Knee Arthroplasty
TUG Timed-Up-and-Go
UCLA University of California, Los Angeles (eg. UCLA Activity Score) WOMAC Western Ontario and McMaster Universities Osteoarthritis Index
Chapter 1
1
Introduction
1.1
Osteoarthritis
1.1.1
Osteoarthritis Pathophysiology
Osteoarthritis (OA) is a chronic degenerative disease that targets both weight bearing and
non-weight bearing joints of the body.1 Healthy joint cartilage acts as a lubricated surface
for articulation and load transmission, and adapts to loading by increasing regional
thickness.1, 2 Due to being avascular, articular cartilage is sensitive to injury and is
especially sensitive to degenerative changes.2 Once OA has initiated, cartilage
degeneration overtakes adaptive processes and articular cartilage deteriorates.1, 2 In
addition to cartilage degeneration, changes to the synovium, meniscus, ligaments, and
subchondral bone also occur.2 Clinical symptoms that comprise a diagnosis of OA include
joint space narrowing, malalignment, pain, stiffness, and disability.1, 3 The pathology of
OA is multifaceted, with mechanical, structural, genetic, and environmental factors playing
a part in its development.1-3 The risk for developing OA increases with age, obesity,
previous joint injury, and presence of metabolic disease.1-3 Risk for developing OA can be
reduced by maintaining a mobile lifestyle, managing weight, and reducing risk of joint
injury.2 The pathogenesis of this disease is still under review and the complete picture of
OA is not yet resolved.1, 3 The multi-factorial nature of OA contributes to the complexity
in deriving disease modifying OA drugs (DMOADs).1, 3 No DMOADs currently exist, and
even if novel DMOADs were derived in the near future it would still take decades before
they would be available for public use.2 The only long-term solution for OA is joint
replacement, though the lifetime of this solution is also limited. This lack of effective
medicinal treatment for OA contributes to the global burden of OA.
1.1.2
Physical Burden
OA affects millions of people worldwide and is the leading cause of chronic disability in
individuals over 70.2, 4 The number of individuals affected by OA will continue to increase
million individuals are affected by OA.5 The progressive degeneration of joints in this
disease causes severe pain, stiffness, loss of function, and swelling, together these result in
limited ability to complete normal activities of daily living and decreases in quality of
life.2, 4, 5 Most commonly, joints affected by OA include hands, hips, knees, feet, and joints
of the spine.5 OA of the hip and knee joints tend to cause the greatest quality of life burden
due to the effect on weight-bearing ability.4 The physical burden to national and global
populations is widespread and consequentially there are impacts to the economy.
1.1.3
Economic Impact
The direct cost of OA is projected to increase to $7.6 billion in Canada by 2031.6 The
greatest contributor to direct cost is hospitalization, and 95% of this hospitalization cost is
due to hip and knee surgeries.6 $4.7 billion of the direct cost of OA in 2031 will solely be
a result of the hospitalization, physician, and prescription drug costs of hip and knee
replacements.6 While the direct cost of OA is heavy, the indirect costs of OA increase the
total cost substantially. The disability associated with OA causes productivity costs due to
work loss, and from 2010 to 2031 this cost will increase by almost 50%.7 The increase in
direct and indirect costs due to OA highlight the need for preventative and effective
treatment of OA.
1.2
Total Knee Arthroplasty
1.2.1
Knee Anatomy & Biomechanics
Before describing the total knee arthroplasty (TKA) surgical procedure and its outcomes,
it is important to have a background of the knee anatomy and function. While the knee is
sometimes thought of as a hinge, there is more complexity involved to facilitate the
articulation between the upper and lower leg. Body weight is transmitted from the femur
to the tibia, with the patella acting to increase leverage during knee extension (Figure 1).8,
9 Ligaments, muscles, and menisci act to facilitate and stabilize the knee joint at rest and
during motion.9 There are four ligaments worth noting in the context of TKA (Figure 1).
The anterior cruciate ligament (ACL) resists anterior displacement of the tibia, the posterior
cruciate ligament (PCL) resists posterior tibia displacement, and the medial collateral
of the knee, respectively.4 The quadriceps muscle group, located on the front of the thigh,
is the primary mechanism for extension of the tibia and the hamstring muscle group,
located on the back of the thigh, is the primary knee flexion facilitator.9 These muscle
groups also offer dynamic stability of the knee.9 The menisci are cartilaginous tissue acting
as load bearing surfaces between the femur and tibia that also guide rotation and stabilize
translation of the joint (Figure 1).9 During level walking, the medial contact point of the
tibia and femur creates a pivot for axial rotation, while the lateral contact of the tibia and
femur allows more anterior and posterior translation.10 Similarly, during greater knee
flexion the medial portion of the femur experiences minimal change in contact position on
the tibia while axially rotating, and the lateral contact position of the femur rolls posteriorly
along the tibia with increased flexion.10 Together, the quadriceps and hamstring muscle
groups enact extension and flexion, the ligaments keep the femur and tibia within normal
limits during this motion, and the medial and lateral menisci offer smooth, cushioning
surfaces for this motion. The knee joint is a complex system that is consequently difficult
to provide with an ideal replacement.
1.2.2
TKA Procedure
TKA is a surgical solution reserved for individuals with severe knee OA which restores
quality of life and ability to participate in normal activities of daily living for its recipients.
This procedure replaces the diseased femoral, tibial, and sometimes patellar components
of the knee joint with artificial components.11 The femoral implant is typically composed
of metal, the tibial component is a flat metal platform with a polyethylene insert (Figure
2), and the patellar implant is a dome-shaped polyethylene cap, though a patellar implant
is not always implemented.4 TKA is the recommended treatment for severe OA and is
effective in treating the pain and loss of function associated with this disease.11
In general terms, the TKA procedure involves resection of diseased bone from the femur,
tibia, and sometimes patella which is then replaced by implants. Bone resection of the
femur and tibia and balancing of ligament tensions during the TKA surgery influence the
rotation of the femoral component post-TKA.12 Consequently, a surgical goal of TKA is
bone resection and ligament balancing to create a symmetrical gap between the femur and
tibia.12 Techniques vary with surgeon preferences for creating balanced flexion and
extension gaps. After resection, the implant type inserted is at the discretion of the surgeon
and the implant may or not be cemented in place – depending on bone quality.4 Implant
type may vary depending on a surgeon’s choice to retain a healthy PCL or sacrifice a
damaged PCL, resulting in cruciate retaining (CR) implant or a posterior-stabilizing (PS)
implant that has a post as a feature of the polyethylene tibial insert to prevent posterior
displacement of the femur (Figure 2).4 An implant may also have a fixed or mobile
polyethylene cushion which may differ depending on the activity level, age, or weight of
the patient.4 There are many opportunities for variation in the TKA procedure, which may
1.2.3
TKA Outcomes
TKA has been widely accepted as a successful surgical treatment for knee OA based on
implant survival and surgeon-based outcomes.14 However, greater improvements in
functional outcomes are perceived by surgeons than are reported by patients.15 Many
people are dissatisfied and continue to experience pain and functional difficulties after their
TKA surgery.14, 16 Dissatisfaction is multifactorial and more severe dissatisfaction may be
associated with instability, stiffness, and lack of social support.17 It is important to keep
patient experiences in mind when assessing treatment to improve patient outcomes and
prevent future healthcare burdens.
1.3
TKA Assessment Tools
1.3.1
Surgeon Assessment
Throughout the TKA process the surgeon is involved with assessing the function and
physical examination, and obtaining a clinical history from the patient.18 Though OA is
primarily evaluated through a history and physical examination, X-rays may be used to
identify alignment of the knee, joint space narrowing, increased bone density, or bony
overgrowths.18 The physical examination can be used to assess and monitor range of
motion, alignment deformity, limitation during active and passive movement, joint
instability, joint swelling, or pain during motion.19 A patient’s clinical history is also an
important tool for a surgeon in evaluating symptoms of pain, stiffness, or function and their
progression.19 Surgeon assessment varies between surgeons as can be expected, but there
is also variation between the doctor’s assessment and the patient’s experience.20 This is
cause for the development of techniques that encompass the patient experience and
quantitative outcomes.
1.3.2
Patient Reported Outcome Measures
Patient reported outcome measures (PROMs) take the form of surveys in which patients
answer questions aimed to quantify qualities such as pain, function, or satisfaction. PROMs
are frequently used in clinics to assess outcomes of TKA at pre- and post-surgery time
points. The Short Form 12 (SF-12), the Western Ontario and McMaster Universities
Osteoarthritis Index (WOMAC), and the Knee Society Score (KSS) questionnaires are
commonly implemented in clinics to assess general health, lower limb function with
respect to OA, and TKA specific functional outcomes, respectively.21-24 The WOMAC is
the most commonly used survey tool to assess TKA outcomes.21 This questionnaire uses a
Likert scale to score 5 questions related to pain, 2 questions related to stiffness, and 17
questions related to function. The SF-12 and KSS assess outcomes in a similar
fashion.22, 24 PROMs offer simple, resource efficient, and validated methods for
quantitatively monitoring TKA outcomes.21 However, there are disadvantages associated
with PROMs. Surveys are often prone to floor or ceiling effects, where participants choose
the lowest or highest score available.25 This is common for PROMs assessing TKA patients
due to the large improvement often provided by this surgery.25 This can conceal potentially
key distinctions between subjects. As well, due to the ordinal nature of PROMs the
Therefore, it is important to use surveys that have valid content for the intended purpose to
more accurately assess outcomes.
1.3.3
Functional Tests
Functional tests are another method used to monitor TKA outcomes that is widely used in
the research field. These tests rely on a participant completing a physical task that has the
goal of being analogous to normal activities of living. Examples of functional tests include
the 6-minute-walk test, the sit-to-stand test, or the timed-up-and-go test.26 These tests
typically quantify function using start to finish variables such as distance traveled or time
to complete. Functional tests offer further simple and resource efficient methods of
evaluating OA and TKA outcomes.26, 27 While the typical singular outcomes of functional
tests can condense general function into a quantity, these values are not descriptive of
differences in strategies or adaptations that a participant may employ to complete the test.
1.3.3.1
The Timed-Up-and-Go Test
The timed-up-and-go (TUG) test has been previously used to evaluate the functional
performance of patients with knee pathologies.28, 29 During this test, the participant stands
up from a chair, walks 3 m to a measured goal, turns around at the goal, walks back to the chair, then turns around to sit back down in the chair.30 This test is less intensive than the
6-minute walk test and stair ascending/descending tests, and it is more likely that
post-operative patients are able to complete it at earlier timepoints.29 The TUG test has excellent
same-day test-retest reliability with TKA patients.28 Changes in TUG test time above
2.27 s can be attributed to a “real” change in function for TKA patients outside of standard errors of the mean (SEM).28 As well, the TUG test has been demonstrated to be an
appropriate tool for assessment of function shortly after TKA with respect to amount of
change and relationship to patient-perceived improvement.31 The feasibility and
measurement properties of the TUG test make it an excellent tool for use in both clinical
1.3.4
3D Motion Capture Laboratories
Motion capture cameras are the gold standard for external motion tracking and have
previously been applied to functional assessment of TKA patients.32-35 This type of
assessment requires stationary labs with an expensive setup of infrared cameras that track
reflective markers, and trained personnel. Often these labs also implement ground force
plates to measure loading during gait which can be used to calculate moments of force –
commonly referred to as torque – at the knee. Common measures extracted from these
methods include knee flexion angles, ranges of motion, moments about the knee, or ground
reaction forces during gait.32, 36 Studies using 3D motion labs have previously shown that
there are kinetic and kinematic differences between pre-TKA, post-TKA, and healthy
asymptomatic adults, as well as improvements post-TKA that bring patients closer to
asymptomatic biomechanics.32-35 Research using these gait labs have shown that TKA
patients walk with less range of motion during the different phases of gait compared to
control populations.36 This is believed to affect patients’ ability to perform functional
activities.36 Abnormal moment patterns about the flexion axis have been shown to
differentiate between a majority of control and TKA subjects, and increases in moments in
the adduction axis have been linked to implant alignment and loosening.36 While 3D
motion capture labs have given insight into the biomechanics of TKA patients, these labs
cannot be easily applied to assess or monitor patients outside of research participation.
1.3.5
Wearable Motion-Based Sensors
Wearable sensors have become increasingly popular amongst the public in recent years,
making it a more affordable opportunity for research. Inertial measurement units (IMUs)
are one of these motion-based sensor types that have increased in prevalence. IMUs are
composed of three micro-electromechanical systems: a gyroscope, a magnetometer, and an
accelerometer. These components work together to retrieve angular data in the form of
displacement, velocity, and/or acceleration. Previous work has exploited these
characteristics to quantify gait and lower limb motion.37-39 Spatiotemporal and kinematic
parameters derived from individual sensors during functional activities have discriminated
between OA patients and healthy subjects,40 and have shown differences between pre- and
angular displacement of specific body landmarks, peak angular velocities or accelerations
of these landmarks in different planes of motion, cadence, stride velocity, or stride
length.42, 43 A novel application of these sensors is to use information gathered from
multiple sensors to calculate angles of joint motion.44-47 While this technique involves more
intensive sensor software development, it allows for the collection of measurements
analogous to the kinematic metrics derived in specialty 3D motion capture labs at a fraction
of the cost. IMUs have great potential for evaluating and monitoring pathologies affecting
motion in research and clinical settings.
1.4
Thesis Objectives and Hypotheses
Given the rise in popularity and decreasing price of wearable sensors, this technology
offers a feasible opportunity for more personalized medicine in an orthopedic clinic setting.
This work aims to set the tone for implementing wearable technology in the clinic for TKA
populations while keeping the patient experience at its core. The objectives of this thesis
are to: (1) validate an IMU setup in a controlled environment for the measurement of knee
joint angles, and (2) implement the IMU setup during trials of the TUG test in a population
of post-TKA patients to derive novel metrics relating to PROMs that can be used to assess
quantitative function that is patient-important. We hypothesize that the IMU setup will
measure knee joint angles with acceptable accuracy and precision at different speeds and
after re-positioning. We also hypothesize that when implemented into a group of 1- or
2-year post-TKA patients during TUG tests that new sensor-derived metrics will relate to
1.5
References
1. Vincent KR, Conrad BP, Fregly BJ, Vincent HK. The pathophysiology of osteoarthritis: a mechanical perspective on the knee joint. PM R. 2012;4: S3-9.
2. Mobasheri A, Batt M. An update on the pathophysiology of osteoarthritis. Ann Phys Rehabil Med. 2016;59: 333-39.
3. Dobson GP, Letson HL, Grant A, McEwen P, Hazratwala K, Wilkinson M, et al. Defining the osteoarthritis patient: back to the future. Osteoarthritis Cartilage. 2018.
4. Thakur Dangi R. Joint reconstruction and replacement: Materials, technologies, and global markets. BCC Research, 2014.
5. Bombardier C, Hawker G, Mosher D. The Impact of Arthritis in Canada: Today and Over the Next 30 Years. Arthritis Alliance of Canada, 2011.
6. Sharif B, Kopec J, Bansback N, Rahman MM, Flanagan WM, Wong H, et al. Projecting the direct cost burden of osteoarthritis in Canada using a microsimulation model. Osteoarthritis Cartilage. 2015;23: 1654-63.
7. Sharif B, Garner R, Hennessy D, Sanmartin C, Flanagan WM, Marshall DA. Productivity costs of work loss associated with osteoarthritis in Canada from 2010 to 2031. Osteoarthritis Cartilage. 2017;25: 249-58.
8. Fox AJ, Wanivenhaus F, Rodeo SA. The basic science of the patella: structure, composition, and function. J Knee Surg. 2012;25: 127-41.
9. Flandry F, Hommel G. Normal anatomy and biomechanics of the knee. Sports Med Arthrosc Rev. 2011;19: 82-92.
10. Komistek RD, Dennis DA, Mahfouz M. In vivo fluoroscopic analysis of the normal human knee. Clin Orthop Relat Res. 2003: 69-81.
11. Dieppe P, Basler HD, Chard J, Croft P, Dixon J, Hurley M, et al. Knee replacement surgery for osteoarthritis: effectiveness, practice variations, indications and possible determinants of utilization. Rheumatology (Oxford). 1999;38: 73-83.
12. Daines BK, Dennis DA. Gap balancing vs. measured resection technique in total knee arthroplasty. Clin Orthop Surg. 2014;6: 1-8.
13. Nikolaou VS, Chytas D, Babis GC. Common controversies in total knee replacement surgery: Current evidence. World J Orthop. 2014;5: 460-8.
15. Kane RL, Saleh KJ, Wilt TJ, Bershadsky B. The functional outcomes of total knee arthroplasty. J Bone Joint Surg Am. 2005;87: 1719-24.
16. Bourne RB, Chesworth BM, Davis AM, Mahomed NN, Charron KD. Patient satisfaction after total knee arthroplasty: who is satisfied and who is not? Clin Orthop Relat Res. 2010;468: 57-63.
17. Howells N, Murray J, Wylde V, Dieppe P, Blom A. Persistent pain after knee replacement: do factors associated with pain vary with degree of patient dissatisfaction? Osteoarthritis Cartilage. 2016;24: 2061-68.
18. Swagerty DL, Jr., Hellinger D. Radiographic assessment of osteoarthritis. Am Fam Physician. 2001;64: 279-86.
19. Sinusas K. Osteoarthritis: diagnosis and treatment. Am Fam Physician. 2012;85: 49-56.
20. Janse AJ, Gemke RJ, Uiterwaal CS, van der Tweel I, Kimpen JL, Sinnema G. Quality of life: patients and doctors don't always agree: a meta-analysis. J Clin Epidemiol. 2004;57: 653-61.
21. Alviar MJ, Olver J, Brand C, Tropea J, Hale T, Pirpiris M, et al. Do patient-reported outcome measures in hip and knee arthroplasty rehabilitation have robust measurement attributes? A systematic review. J Rehabil Med. 2011;43: 572-83.
22. Scuderi GR, Bourne RB, Noble PC, Benjamin JB, Lonner JH, Scott WN. The New Knee Society Knee Scoring System. Clin Orthop Relat Res. New York, 2012: p. 3-19.
23. McConnell S, Kolopack P, Davis AM. The Western Ontario and McMaster Universities Osteoarthritis Index (WOMAC): a review of its utility and measurement properties. Arthritis Rheum. 2001;45: 453-61.
24. Clement ND, MacDonald D, Simpson AH. The minimal clinically important difference in the Oxford knee score and Short Form 12 score after total knee arthroplasty. Knee Surg Sports Traumatol Arthrosc. 2014;22: 1933-9.
25. Marx RG, Jones EC, Atwan NC, Closkey RF, Salvati EA, Sculco TP. Measuring improvement following total hip and knee arthroplasty using patient-based measures of outcome. J Bone Joint Surg Am. 2005;87: 1999-2005.
26. Dobson F, Hinman RS, Roos EM, Abbott JH, Stratford P, Davis AM, et al. OARSI recommended performance-based tests to assess physical function in people diagnosed with hip or knee osteoarthritis. Osteoarthritis Cartilage. 2013;21: 1042-52.
28. Yuksel E, Kalkan S, Cekmece S, Unver B, Karatosun V. Assessing Minimal Detectable Changes and Test-Retest Reliability of the Timed Up and Go Test and the 2-Minute Walk Test in Patients With Total Knee Arthroplasty. J Arthroplasty. 2017;32: 426-30.
29. Kennedy DM, Stratford PW, Wessel J, Gollish JD, Penney D. Assessing stability and change of four performance measures: a longitudinal study evaluating outcome following total hip and knee arthroplasty. BMC Musculoskelet Disord. 2005;6: 3.
30. Podsiadlo D, Richardson S. The timed "Up & Go": a test of basic functional mobility for frail elderly persons. J Am Geriatr Soc. 1991;39: 142-8.
31. Poitras S, Wood KS, Savard J, Dervin GF, Beaule PE. Assessing functional recovery shortly after knee or hip arthroplasty: a comparison of the clinimetric properties of four tools. BMC Musculoskelet Disord. 2016;17: 478.
32. Hatfield GL, Hubley-Kozey CL, Astephen Wilson JL, Dunbar MJ. The effect of total knee arthroplasty on knee joint kinematics and kinetics during gait. J Arthroplasty. 2011;26: 309-18.
33. Turcot K, Aissaoui R, Boivin K, Pelletier M, Hagemeister N, de Guise JA. New accelerometric method to discriminate between asymptomatic subjects and patients with medial knee osteoarthritis during 3-d gait. IEEE Trans Biomed Eng. 2008;55: 1415-22.
34. Kaufman KR, Hughes C, Morrey BF, Morrey M, An KN. Gait characteristics of patients with knee osteoarthritis. J Biomech. 2001;34: 907-15.
35. Astephen Wilson JL, Dunbar MJ, Hubley-Kozey CL. Knee joint biomechanics and neuromuscular control during gait before and after total knee arthroplasty are sex-specific. J Arthroplasty. 2015;30: 118-25.
36. McClelland JA, Webster KE, Feller JA. Gait analysis of patients following total knee replacement: a systematic review. Knee. 2007;14: 253-63.
37. Liu T, Inoue Y, Shibata K. Development of a wearable sensor system for quantitative gait analysis. Measurement. 2009;42: 978-88.
38. Tao W, Liu T, Zheng R, Feng H. Gait analysis using wearable sensors. Sensors (Basel). 2012;12: 2255-83.
39. Shull PB, Jirattigalachote W, Hunt MA, Cutkosky MR, Delp SL. Quantified self and human movement: a review on the clinical impact of wearable sensing and feedback for gait analysis and intervention. Gait Posture. 2014;40: 11-9.
41. Bolink SA, Grimm B, Heyligers IC. Patient-reported outcome measures versus inertial performance-based outcome measures: A prospective study in patients undergoing primary total knee arthroplasty. Knee. 2015;22: 618-23.
42. Coulthard JT, Treen TT, Oates AR, Lanovaz JL. Evaluation of an inertial sensor system for analysis of timed-up-and-go under dual-task demands. Gait Posture. 2015;41: 882-7.
43. Zampieri C, Salarian A, Carlson-Kuhta P, Aminian K, Nutt JG, Horak FB. The instrumented timed up and go test: potential outcome measure for disease modifying therapies in Parkinson's disease. J Neurol Neurosurg Psychiatry. 2010;81: 171-6.
44. Cooper G, Sheret I, McMillan L, Siliverdis K, Sha N, Hodgins D, et al. Inertial sensor-based knee flexion/extension angle estimation. J Biomech. 2009;42: 2678-85.
45. Alonge F, Cucco E, D'Ippolito F, Pulizzotto A. The use of accelerometers and gyroscopes to estimate hip and knee angles on gait analysis. Sensors (Basel). 2014;14: 8430-46.
46. Liu K, Inoue Y, Shibata K. Physical sensor difference-based method and virtual sensor difference-based method for visual and quantitative estimation of lower limb 3D gait posture using accelerometers and magnetometers. Comput Methods Biomech Biomed Engin. 2012;15: 203-10.
Chapter 2
2
Repeatability of measuring knee flexion angles with
wearable inertial sensors
2.1
Introduction
Assessments of knee joint flexion and extension range of motion is commonly used by
surgeons to track patient function following knee arthroplasty.1 Patients that experience
post-arthroplasty improvements in knee biomechanics during gait typically report good
outcomes, while those who lack improvements do not.2 Clinicians often collect
rudimentary data using manual, hand-held goniometers, which are known to have poor
accuracy. In research settings, this type of kinematic information of knee joints can be
gathered through a variety of devices, including most commonly electro-goniometers and
3D motion capture cameras. However, these have multiple factors limiting their potential
application in clinics. Electro-goniometers are limited to two planes of motion, and the
physical strain gauge that measures angles requires specific placement and could
potentially interfere with incisions. 3D motion capture cameras are the gold standard for
motion capture, but this modality requires a stationary lab, complex interpretation,
substantial patient time commitment, and is very expensive.
Inertial measurement units (IMUs) have become increasingly popular as a method to
capture motion data.3 These sensors commonly measure acceleration, velocity, and
orientations in space and cost much less than a traditional 3D motion capture camera
system.4 IMUs can be used to calculate joint angles using the orientations in space collected
from two separate sensors.5 Aside from cost, the small physical nature and wireless
capability of IMUs means they can be attached unobtrusively to subjects as wearable
sensors and then be implemented during physical activities to evaluate joint characteristics
that are supplementary values of joint function.6, 7 These sensors also have great potential
for assessment outside of the lab environment by tracking functional tests or daily
activities. Wearable sensors can be easily applied to knee joint research to provide
important information regarding characteristic functionality of knee joint pathologies,6 and
As the use of IMUs for such assessments is increasing, clinicians and researchers must be
aware of their limitations with respect to accuracy and repeatability of their measurements.
The purpose of the present study was to determine the strengths, weaknesses, and areas for
improvement for a typical set of IMUs. The primary objective of this experiment was to
evaluate the measurement repeatability of IMU joint angles in comparison to an
electro-goniometer and a 3D motion capture camera setup using a repeatable robot controller and
an anthropomorphic leg phantom. The secondary objectives were to determine any effects
of joint speed and sensor positioning on the joint angles collected by these sensors. We
hypothesize that 1) the IMU’s will provide less bias than the electro-goniometer to the 3D
motion capture markers due to their lack of mechanical constraints, and 2) the IMUs will
have greater repeatability error than the electro-goniometer due to cumulative dual-sensor
error but will provide repeatability comparable to a manual goniometer.
2.2
Methods
2.2.1
Robot & Phantom Setup
A 6-degree-of-freedom robotic controller was used in this experiment to provide repeatable
motion paths to determine the bounds of repeatability of wearable sensors for future studies
with human subjects. This represents the best-case scenario, therefore if the accuracy limits
are not acceptable here, then such sensors would not be appropriate for clinical use where
accuracy is likely to be worse. The phantom itself provided anatomical references for
positioning of the modalities as well as simulated soft tissue that could introduce motion
artifacts that would be typical of a patient. In addition to being a repeatable platform for
evaluation, this experimental setup allowed for simulation of human motion that was
completely controlled. The anthropomorphic leg phantom (Sawbones Fully Encased Leg,
Pacific Research Laboratories, Vashon, WA) was affixed to the robot via a custom fixture
to anchor the upper segment of the leg to a stationary platform and to affix the lower
segment to the mobile end-effector of the robot arm. The end-effector of the robot arm was
programmed to move in an arc to revolve the lower segment of the leg phantom about the
2.2.2
Motion Capture Modalities
Three motion capture modalities were used in this experiment: 3D motion capture cameras,
an electro-goniometer, and two IMU setups. See Figure 3 for the setup of the motion
capture modalities described as follows. An 11-camera, 3D motion capture system (Motion
Analysis Corporation, Santa Rosa, CA) with four passive reflective markers was used as a
gold standard for non-invasive motion capture technology to compare the wearable sensors
against. The four reflective markers for the 3D motion capture cameras were affixed along
the lateral side of the leg phantom using double-sided tape, with two of the markers placed
on the upper segment of the leg and the other two on the lower segment. For each of the
four anatomic markers, 3D Cartesian coordinates were gathered at a sample rate of 60 Hz
over the duration of each test. These unprocessed data were then input into a custom
MATLAB script (MathWorks, Natick, MA). This script isolated and calculated the
flexion-extension angles between the upper leg segment and the lower leg segment for each sample
point throughout each test. This was achieved via the following steps: a 3D virtual line or
“vector” along the upper leg segment was created by subtracting proximal thigh marker
coordinates from the distal thigh marker coordinates, the lower leg segment vector was
created in the same manner with distal and proximal tibial marker coordinates, the dot
product of the upper and lower leg vectors was calculated, the cross product of the upper
and lower leg vectors was calculated and normalized, then the arctangent of the normalized
cross product and the dot product was taken to determine the angle of flexion of the leg.
A wireless electro-goniometer (Biometrics Ltd., Newport, UK) was also used as a
comparator for the proposed IMU systems. The electro-goniometer was attached laterally
on the leg phantom across the approximate center of motion of the knee joint using
double-sided tape and adjustable straps. Angular data were collected at 100 Hz and wirelessly
transmitted from the goniometric sensor to a computer with Biometrics DataLITE version
10.05 which processed the goniometric data automatically to produce flexion-extension
angles.
Lastly, IMUs (mbientlab, San Francisco, CA) were used to measure the angle between the
upper and lower segments of the leg phantom at a sample rate of approximately 25 Hz.
setup, the IMUs were positioned on the posterior side of the leg phantom with one on the
upper segment and one on the lower segment. This posterior placement was used to
approximate an anterior placement on a patient. A true anterior placement was not viable
on the leg phantom in this experiment due to the interaction of the custom fixture with the
anterior portion of the thigh, as can be seen in Figure 3. However, the posterior IMU
placement is an appropriate simulation for an anterior IMU placement since the IMUs
rotate about the same sensor axes for both anterior and posterior placements. For the second
IMU setup the IMUs were positioned on the lateral side of the leg phantom, with one IMU
on the upper segment and one on the lower segment again.
For both IMU setups, orientation data were transmitted via Bluetooth from each IMU to an
iPhone (Apple Inc., Cupertino, CA). A custom application calculated the angle between
the leg segments by determining the difference in sensor orientation of the upper with
respect to the lower IMUs. Orientation estimations were expressed in quaternions to
prevent Gimbal lock. This phenomenon occurs when one of three axes of rotation aligns
with another and causes a degree of freedom to be lost, which results in incorrect rotational
movements. Thus, quaternion representations are advantageous in the case of wearable
sensor technology. From the quaternion orientation estimations of the upper and lower
IMUs the custom software separated the flexion-extension component from the
internal-external rotation and varus-valgus components of the joint movement by breaking the
2.2.3
Experimental Procedure
All motion capture modalities gathered data concurrently while attached to the robotic leg
phantom during the following tests. Each test involved a ten-cycle run of the 120 degree
motion arc described above to assess repeatability of each modality within each test. The
motion pathway of the robot is depicted by the waveform graph in Figure 4 of a
representative test captured by the 3D motion capture camera markers. Figure 5 depicts
the series of events in the experiment, described as follows. To assess repeatability at
different speeds, the ten-cycle test was replicated for three increasing angular speeds of
approximately 15, 30, and 50 degrees per second, with the fastest speed being characteristic
of activities of daily living.9 After the initial three tests at different speeds, the
electro-goniometer and all four IMUs were removed from the leg phantom, the electro-electro-goniometer
was tared against a straight surface, and then both sensor modalities were re-positioned on
the leg phantom to assess placement repeatability and to simulate test-retest conditions
tests were repeated. Nine robot tests were completed in total, which comprised positioning
the sensors three times and three speed tests per position.
2.2.4
Data Processing
The main outputs for all three modalities were flexion angles over time. The initial
straight-leg position of the phantom was assigned a value of zero degrees of flexion, and therefore Figure 4: Motion pathway of the robotic leg phantom
during each individual test.
initial values were subtracted as offsets. From these flexion angles over time, the 10 peaks
and 9 troughs of the motion waveform were extracted for each test using a custom
MATLAB program. These peaks and troughs were then used to compare the tests for the
different modalities, positions, and speeds. To determine the effects of sensor type,
re-positioning, and changes in flexion speed, IBM SPSS Statistics 25 (IBM Corporation,
Armonk, NY) was used to conduct three-way ANOVA and Bonferroni’s post hoc
correction. Statistically significant differences between tests were determined as any
comparison with p≤0.05. GraphPad Prism 7.00 (GraphPad Software, La Jolla, CA) was
used to calculate means, standard deviations, and 95% confidence intervals to show the
repeatability of minimum and maximum angles reached during a singular test.
Repeatability was assessed using the standard deviation as described by Langlois et al. on
current ASTM and ISO recommendations.10 Bias and standard deviation of bias was also
calculated in GraphPad Prism using Bland-Altman’s methods.11
2.3
Results
Mean, standard deviation, and confidence intervals of maximum and minimum flexion are
presented in Table 1 and Table 2, respectively, for each 10-cycle test of every modality,
position, and speed. The overall average maximum flexion angles across all tests for the
3D camera markers, electro-goniometer, posterior IMUs, and lateral IMUs in respective
order were 119.4±0.3°, 112.4±0.5°, 116.2±2.4°, and 118.3±1.1°. The overall average
minimum flexion angles across all tests in the same order were 0.2±0.1°, -0.1±0.1°,
0.6±0.7°, and -0.3±2.7°. Average maximum and minimum flexion angles for every test and
modality are graphically presented in Figure 6.
Observation of the bias of the maximum flexion angles for the different sensor setups to
the 3D camera markers showed bias ± standard deviation (SD) of 7.0±0.6°, 3.2±2.6°, and
1.1±1.2° for the electro-goniometer, posterior IMUs, and lateral IMUs, respectively
(Figure 7). For comparisons of minimum flexion for the different wearable sensor setups
to the 3D camera markers, differences of less than 1° were observed for all sensor types
(Table 2). Sensor type, re-positioning, and speed changes – and the interactions between
type having a greater effect than re-positioning, and re-positioning having a greater effect
than speed.
Sensor re-positioning showed varied degrees of qualitative effects on maximum flexion
comparisons for the different modalities (Figure 6). Since the 3D camera markers were
not re-positioned between tests, they did not show any observable re-positional patterns.
Slight re-positioning patterns were observed for the electro-goniometer, with the greatest
difference in flexion angles being approximately 1°. The posterior and lateral IMUs had
less obvious re-positioning patterns. The greatest difference in maximum flexion angles
due to re-positioning was less than 5° for the posterior IMUs and approximately 3° for the
lateral IMUs. No obvious patterns were observed on the minimum flexion angles as an
effect of re-positioning for the 3D camera markers, electro-goniometer, posterior IMUs, or
lateral IMUs. The greatest differences in minimum flexion angles were approximately 0.3°,
0.3°, 1.8, and, and 1.7° for the 3D markers, electro-goniometer, posterior IMUs, and lateral
IMUs, respectively.
Qualitatively, joint flexion speed had varying effects on maximum flexion comparisons for
the different modalities (Figure 6). No obvious patterns with increasing speeds were
observed for the 3D camera markers and the electro-goniometer, and the greatest
differences in flexion angles were 0.6° and 0. 2°, respectively. The posterior IMUs showed
a visually obvious pattern of decreasing maximum flexion angles with increasing speeds.
The greatest change in maximum flexion angles was less than 3° for the posterior IMUs
and approximately 2° for the lateral IMUs. Effects of robot flexion speed showed no
visually obvious patterns with increasing speeds on minimum flexion angles, and the
greatest differences in minimum flexion angles due to speed were approximately 0.2°, 0.2°,
1°, and 1.5° for the 3D camera markers, electro-goniometer, posterior IMUs, and lateral
(A) (B)
(C) (D)
(E) (F)
(G) (H)
(A) (B)
(C) (D)
Table 1: Mean ± standard deviation (SD) and 95% confidence intervals (CI) of maximum flexion in degrees for each test and each modality.
Position 1 Position 2 Position 3
Slow Medium Fast Slow Medium Fast Slow Medium Fast
3D Camera Markers
Mean±SD 119.3±0.3 119.7±0.0 119.9±0.1 119.2±0.0 119.1±0.0 119.3±0.1 119.4±0.2 119.2±0.0 119.6±0.1 95% CI 119.1,
119.5 119.7, 119.7 119.9, 120.0 119.2, 119.2 119.0, 119.1 119.3, 119.4 119.3, 119.6 119.2, 119.3 119.6, 119.7 Electro-goniometer
Mean±SD 111.8±0.1 112.0±0.1 112.0±0.1 112.2±0.1 112.2±0.1 112.3±0.0 113.1±0.0 113.1±0.1 113.0±0.0 95% CI 111.8,
111.9 112.0, 112.1 112.0, 112.1 112.1, 112.3 112.2, 112.3 112.2, 112.3 113.1, 113.2 113.0, 113.1 113.0, 113.1 IMU (Posterior Position)
Mean±SD 115.9±0.2 114.0±0.2 113.0±0.3 120.6±0.3 118.4±0.1 118.2±0.3 116.4±0.3 115.2±0.2 114.2±0.2 95% CI 115.7,
116.1 113.8, 114.1 112.8, 113.2 120.4, 120.8 118.3, 118.5 117.9, 118.4 116.2, 116.7 115.0, 115.4 114.0, 114.3 IMU (Lateral Position)
Mean±SD 116.6±0.4 118.6±0.1 117.2±0.3 117.4±0.2 118.9±0.1 118.5±0.4 118.1±0.2 119.5±0.1 120.3±0.1 95% CI 116.3,
116.9 118.5, 118.7 117.0, 117.4 117.2, 117.5 118.8, 119.0 118.2, 118.7 117.9, 118.3 119.4, 119.5 120.2, 120.4
Table 2: Mean ± standard deviation (SD) and 95% confidence intervals (CI) of minimum flexion in degrees for each test and each modality.
Position 1 Position 2 Position 3
Slow Medium Fast Slow Medium Fast Slow Medium Fast
3D Camera Markers
Mean±SD 0.0±0.1 0.2±0.1 0.3±0.1 0.2±0.2 0.0±0.0 0.2±0.1 0.3±0.10 0.1±0.0 0.2±0.0 95% CI 0.0, 0.1 0.2, 0.3 0.2, 0.3 0.1, 0.4 0.0, 0.0 0.2, 0.2 0.2, 0.4 0.0, 0.1 0.2, 0.2 Electro-goniometer
Mean±SD -0.2±0.1 0.0±0.0 0.1±0.1 -0.2±0.1 -0.0±0.0 0.1±0.0 -0.1±0.2 -0.2±0.0 -0.2±0.0 95% CI -0.3, -0.2 0.0, 0.1 0.1, 0.1 -0.2, -0.1 -0.1, 0.0 0.0, 0.1 -0.2, 0.1 -0.3, -0.2 -0.2, -0.2 IMU (Posterior Position)
Mean±SD 0.8±0.4 0.8±0.1 -0.1±0.2 1.4±0.6 0.7±0.2 1.2±0.5 -0.4±0.6 0.7±0.1 0.5±0.2 95% CI 0.5, 1.1 0.7, 0.8 -0.3, 0.0 0.9, 1.8 0.5, 0.8 0.8, 1.6 -0.9, 0.0 0.7, 0.8 0.4, 0.7 IMU (Lateral Position)
Mean±SD -0.8±0.2 0.9±0.1 -0.4±0.2 -0.8±0.5 0.3±0.2 0.2±0.2 -1.5±0.0 -0.8±0.0 -0.1±0.1 95% CI -1.0, -0.6 0.8, 1.0 -0.6, -0.2 -1.1, -0.4 0.2, 0.5 0.0, 0.4 -1.5, -1.4 -0.8, -0.8 -0.2, -0.1
Table 3: F(dfeffect source, dferror) and p values for factors affecting maximum and minimum flexion of leg phantom.
Effect Source Maximum Flexion Minimum Flexion
Sensor Type F(3,27)= 25395.56 p<0.001 F(3,24)=130.86 p<0.001
Speed F(2,18)=20.03 p<0.001 F(2,16)=48.42 p<0.001
2.4
Discussion
Wearable sensors are becoming more prevalent and represent a potential straightforward
and low-cost tool for quantifying patient function before and after joint arthroplasty. Range
of motion in pre-operative knee arthroplasty patients has been shown to be of predictive of
post-operative range of motion and can be used as a tool to assess patient recovery.1 We
endeavoured to assess a representative IMU-type sensor and its ability to collect joint
flexion angles in comparison to an electro-goniometer and a 3D motion capture camera
system. This simple quantity was used in this study to assess the performance of an IMU
setup in the measurement of knee joint flexion angle. Specifically, we wanted to investigate
repeatability of knee joint flexion angles and the effects of speed and placement on the
IMUs using the same lab and operator.
Repeatability of each modality within each individual test was evaluated through
observation of the standard deviation and 95% confidence intervals of maximum and
minimum flexion values. For the maximum flexion values, all sensing modalities
demonstrated standard deviations of approximately ±0.4 degrees or less and confidence
interval widths of 0.6 degrees or less within each 10-cycle test, regardless of speed or
position. Similarly, the minimum flexion measured by the 3D camera markers,
electro-goniometer, posterior IMUs, and lateral IMUs deviated less than ±0.6 degrees and had
confidence interval widths of 0.9 degrees or less. These within-test standard deviations and
confidence intervals should provide acceptable precision in reporting knee joint angles
during short functional tests with knee replacement patients, considering that currently in
clinics flexion range of motion in pre-arthroplasty patients is measured using a manual
goniometer which has a standard error of measurement (SEM) of 4.1 degrees.1
Effects of different sensor types, position, and speed changes were evaluated to simulate
test and re-test conditions using the same lab and operator. All sources of change and
interactions between sources of change caused statistically significant effects to the
maximum and minimum flexion angles. The greatest source of difference by a large margin
was change to the sensor type, while the smallest effect was due to changes in speed. While
differences in sensor measurements of repeatable robotic joint flexion measurement may
not correspond to detectable differences for patient range of motion. The posterior IMU
setup demonstrated a difference in flexion of 4.7 degrees due to re-positioning, which is
slightly greater than the SEM for a manual goniometer in pre-operative knee patients.1 This
may result in a slightly greater minimal detectable change for knee patients if using a
posterior IMU placement. All changes due to speed were less than 3 degrees which is less
than the manual goniometer SEM.
In this experiment, the reliability of the electro-goniometer, posterior IMU setup, and
lateral IMU setup measurements were evaluated by comparison to the benchmark 3D
camera markers using Bland-Altman tests. Only maximum flexion values were evaluated
for this portion of the experiment, as joint angles were initialized to starting offset of each
test. The lateral IMU placement had the least bias of the maximum flexion angles in
comparison to the 3D marker angles. While the electro-goniometer was observed to have
the least standard deviation of bias from the 3D markers, its bias was by far the largest.
This may be due to a limitation of the electro-goniometer technology, as they are known
to have crosstalk errors that prevent the sensor from accurately measuring greater flexion
magnitude.12 These inherent crosstalk errors are unique to each individual sensor and can
range from 2-10 degrees at flexion amplitudes of 100 degrees.12 This is a major
disadvantage of this sensor type and provides further motivation for the use of IMUs which
are not limited to constrained placement and mechanical strain gauge sensing.
Two different IMU anatomical placements were considered in this experiment for future
patient use, the posterior and lateral IMU placements. The different setups activated
different planes of motion of the IMUs during flexion, and the goal of this portion of the
experiment aimed to asses any difference in performance. As mentioned earlier, the
posteriorly placed IMUs displayed patterns of decreasing flexion angles with increasing
flexion speed, though the error due to speed is less than the SEM of a manual goniometer.
The bias to the 3D markers of the maximum angles of the laterally placed IMUs was also
less than the posterior IMUs. However, the difference in bias may be attributed to the lateral
IMUs and the 3D markers both being aligned on the lateral side of the leg phantom. The
between these two placements could be attributed to differences in mechanisms used by
the IMUs to determine orientations in certain planes of the sensor’s motion.
The lateral and posterior positions of the IMUs in this experiment may be considered
analogous to medial and anterior placements, respectively, since flexion occurs about the
same respective axes of the IMUs. Medial sensor placements on patients would likely be
affected by the contralateral leg and would be undesirable for placement. An anterior IMU
setup could benefit from sensor placement along the tibia to reduce soft tissue movement
due to muscle bodies. This placement option was not tested in this experiment due to
constraints created by the fixture attaching the leg phantom to the robot base, though is
likely be a viable placement option. In a clinical setting, the posterior IMU setup would be
impractical to attach to a patient and measurements may also be affected by large muscle
bodies along the posterior chain. As well, the position of a posterior sensor setup may also
be interfered with if patients are able to flex their knee to the point of contact of the thigh
and calf. Either of these IMU setups can avoid any knee surgery incisions since the two
units are not connected to each other – an advantage over electro-goniometers, which are
connected.
Several limitations are apparent in this study, stemming from the robotically-controlled
phantom and modality positioning. A robotically-controlled anthropomorphic leg phantom
was used in the present study to provide a repeatable platform for assessment of our novel
IMU joint angle estimation system. A limitation of this method was the inability to provide
the kinematic nuances of realistic human motion. However, this experimental setup
provided an advantageous balance between a highly repeatable but unrealistic mechanical
jig study design and a less repeatable but realistic human subject study design. As well, the
3D markers were not re-positioned for the duration of the experiment to ensure differences
in flexion angles were not due to changes in position or settling of the leg phantom between
tests. This also provided a baseline for repeatability of the phantom motion for which to
compare the repeatability of the different sensors. However, this limited an opportunity to
show the error due to re-positioning of the 3D markers. The 3D markers were also only
placed laterally along the phantom leg, which limited posterior placement comparisons.
placement of the IMUs. However, the posterior positioning of the IMUs may be considered
analogous to an anterior placement, since flexion occurs about the same respective axes of
the IMUs.
In summary, the use of IMUs has increased in research as an inexpensive method of motion
capture. Due to the extra processing required and increase in areas for potential error to
calculate angles using these sensors, this application has not yet been fully taken advantage
of.5 While both posterior and lateral IMU setups demonstrated statistically significant
effects due to position and speed changes, both IMU setups assessed in this experiment
demonstrated repeatability in measurement of range of motion that is akin to manual
goniometer methods used clinically. The IMUs also provided less bias than the
electro-goniometer at greater flexion angles. Calculations of SEM and minimal detectable change
is required in future studies involving IMUs placed on actual patient knees. An anterior
IMU setup analogous to the posterior positions used in this experiment would be
advantageous in the clinic for ease of sensor alignment. Since both lateral and posterior
IMU setups provided clinically viable repeatability in this experiment, a lateral or anterior
IMU setup is recommended for use in dynamic range of motion measurement in future