Available online: https://edupediapublications.org/journals/index.php/IJR/ P a g e | 1506
Why do shoppers stop at Shoppers Stop?
Sharad Gupta
12*, Anuj Pal Kapoor
1, Harsh V Verma
3, Madhu Vij
31 Research Scholar, Faculty of Management Studies, University of Delhi, Delhi 110007
2 Associate Professor, Delhi School of Business, VIPS-TC, Delhi 110034
3 Professor, Faculty of Management Studies, University of Delhi, Delhi 110007
*Corresponding author’s emails: [email protected], [email protected];
Phone: +91 9910850111
Abstract
Retailing as an industry is expanding in India by
leaps every year creating new stores, novel store
formats and hundreds of jobs. Amid closing of many
stores of multi-brand retail chains, it is important to
understand shoppers’ behavior at the leading chain
Shoppers Stop. This study is undertaken primarily
with this objective. The study uses different
statistical techniques to segment different
consumers into three groups of students, career
beginners and working professionals. The article
examines these consumer segments critically for
their purchase patterns on different dimensions. It
also compares buying behaviors of consumers of
Shoppers Stop with those of competition. The study
provides a novel view of shopper behavior in terms
of her life stage in the context of retail sales.
Marketers will realize the effect of life stages on
consumer and will design product offerings
accordingly. Across all segments, shoppers
suggested having more variety at Shoppers Stop for
which new private label brands are required. The
study finds critical points of differentiation of
Shopper Stop and specific areas of improvements.
The article examines multiple marketing
implications of the study. Future studies can
validate this study with different composition of
sample size. Future research can also focus on
validating reasons for consumers’ shifting loyalty
from Shoppers Stop. Future research can compare
consumer behavior of online and offline
multi-product stores.
Keywords: Shoppers Stop, Consumer life stage,
Multi product retail
Introduction
The Indian retail industry has emerged as one of
the most dynamic and fast-paced industries due to
the entry of several new players. It accounts for
over 10 per cent of the country’s Gross Domestic
Product (GDP) and around 8 per cent of the
employment. India is the world’s fifth-largest
global destination in the retail space. India’s retail
market is expected to nearly double to US$ 1
trillion by 2020 from US$ 600 billion in 2015,
driven by income growth, urbanization and
attitudinal shifts. While the overall retail market is
expected to grow at 12 per cent per annum, modern
trade would expand twice as fast at 20 per cent per
annum and traditional trade at 10 per cent. The
overall growth will be driven by key demographic
Available online: https://edupediapublications.org/journals/index.php/IJR/ P a g e | 1507
organized retail in India as the level of interest
shown by major corporate sector has increased
manifold over the last few years. Large
conglomerates like the TATA's, ITC, the RPG
group, the Piramals and the Rahejas have invested
heavily into large format retail stores. Organised
retailing for some of these business groups is a
logical extension of their businesses. Also textile
and garments companies like Raymond, Madura
Garments and Arvind Denims have successfully
employed forward integration by opening up
exclusive outlets for their branded garments. The
shopping habits and preferences of consumers are
changing and more consumers, especially from the
metropolitan cities incline towards retail chains
which offer a vast assortment of merchandise
under one roof.
Marketplaces in urban demographic settings attract
a large number of buyers and sellers, which can be
termed as market thickness. The growth of market
share for specialised retailers and large
departmental stores depends on the size of the
consumer segment in a given urban population. A
great deal of research focuses on how consumers
shop, but the rationale behind their chosen
behaviors remains somewhat underserved. The total
concept and idea of shopping has undergone a vast
drawing change in terms of format and consumer
buying behavior, ushering in a revolution in
shopping in India. Modern retailing has entered into
India as is observed in the form of sprawling
shopping centers, multi-storied malls and the huge
complexes that offer shopping, entertainment and
food all under one roof. Given the complexity of
modern retail stores, shoppers must be selective in
processing information. They usually have a limited
amount of time available, and must decide which
departments to visit, categories to shop, and specific
brands and items to examine based on their
shopping plans and level of engagement with the
merchandise (among other factors). For marketers to
be successful in this environment, they need to
understand how shoppers allocate their attention
across the available products and displays in the
store, and identify the factors that drive shopper
engagement and interest. This new focus on
measuring shopper behavior has fueled several
recent research trends.
Extant literature shows that retailing can take many
forms, both store and non-store forms. Most
retailing is conducted in stores such as Multi chain
retails, department stores and in some traditional
open markets. Whatever the form, the consumer is
called upon to make a choice. Thus, consumer
decision making involves not only the choice of
product and brand but also the choice of retail outlet
(Jobber, 2009). The evolving nature of retailing and
its various forms; and the consequent
competitiveness in the sector has frequently held the
interest of scholars. Thus, Kaufman and
Lane(1996); Frasquet, Gil and Molle (2001) and
Parikh (2006) observe that today’s global retail
environment is rapidly changing more than ever
before as it is typified by growing competition from
both domestic and foreign companies, a rise in
mergers and acquisitions, and more classy and
demanding consumers who have great expectations
related to their consumption experiences. Changes
in consumers' natural and social environments; and
Available online: https://edupediapublications.org/journals/index.php/IJR/ P a g e | 1508 shopping behavior. These lifestyle changes largely
determine what consumers buy, when they buy and
how and where they buy (Arnould, Price & Zinkhan
2002; North & Kotze 2004; Schiffman & Kanuk
2004).
Multi product retail chains have become almost like
a norm of today’s shopping. Consumers consider
these retail chains for buying variety of product
categories like apparels, home décor products,
handbags, cosmetics, jewelry, shoes, and many
other accessories. There are different Indian players
like Shoppers Stop, Lifestyle, Westside, and
Pantaloons operating in this channel. With the entry
of foreign players like Zara and H&M, this
distribution channel is getting good attention from
the Indian metro consumer. Organized retail sector
is growing rapidly and consumers are shifting to
shopping in organized retail stores. Shopping habits
of Indian consumers are changing due to their
growing disposable income, relative increase in the
younger population, and the change in attitudes
towards shopping. There are unlimited prospects in
the Indian economy for high growth in the
organized retail sector. The Indian organized retail
industry has the competence to grow with the rising
affluence of the Indian middle class due to their
growing disposable income (CII- AT Kearney,
2006). The last decade saw a great boom in the
organized retail industry in India which is attributed
to the changing demographics, international brands
foraying in India, infrastructure developments,
credit availability, usage of latest technology and a
world class shopping experience (Choudhary and
Tripathi, 2012).
Outline of the article
The next section of article reviews the extant
literature on retail shopping behaviour followed by
the research gaps identified for the current study.
The research methodology used is detailed
thereafter. The data analysis using factor analysis,
cluster analysis, discriminant analysis and cross
tabulation is done, which is followed by the
discussion of the data analysis results. After the
discussion, the conclusion and implications are
recorded. The final section includes limitations of
the current study and several avenues of future
research.
Review of Literature
Studies concerning retail patronage and store choice
have followed many directions. Retail shopping
behaviour is predicted by means of objective
variables like distance (location), traffic patterns and
store size (Leszczyc, Sinha & Timmermans, 2000;
Achen, 2005; Biba, Rosiers, Theriault, &
Villeneuve, 2006). A second line of research
employs consumer variables to predict store
patronage. Sirgy, Grewal, & Mangleburg, (2000), in
their study model relationships among store
environment (including store atmospherics), store
patron image, shoppers’ concept,
self-congruity, functional congruity, and retail
patronage. While Koo (2003) examines inter-
relationships among store image, store satisfaction
and store loyalty. In their study, Poovalingam and
Docrat (2011) confirms the significance of the
various situational influences, namely, the physical
surroundings, the social surroundings, time, task
Available online: https://edupediapublications.org/journals/index.php/IJR/ P a g e | 1509 choice of shopping centres. Also, store attributes or
store image which are fundamentally the marketing
mix of the retailer (Morschett, Swoboda & Foscht,
2005; Ghosh 1990) have been presented as store
choice criteria (Mittal & Mittal, 2008). Though store
choice and patronage have been widely studied
across the world, Mittal and Mittal (2008) posit that
most of these studies have been in the developed
retail markets of the west. Unfortunately, studies in
the retail sectors of the under-developed countries
have been scarce.
Loyalty can be examined from the relationship
between consumer’s attitude toward a product,
brand, service, Multi chain retail or store, seller and
the consumer’s patronage behaviour (Dick and
Basu, 1994). Loyalty means the stability of
repurchase of a certain brand, and to become a
patron of a certain retailer or service supplier (Jones
and Reynolds, 2006). Store loyalty is summarized as
the dependence which is developed by the consumer
upon a store that merchandises many brands. This
attitude includes the place in which shopping is
done rather than brands or product loyalty. Such a
case occurs due to differences that the distribution
phase provides rather than the product features.
Thus, such a difference can be means of the service,
price, or the closeness to the consumer (Salis, 2004).
Several studies have been done to determine the
factors that influence store loyalty. Some of these
studies examined factors affecting patronage
attitudes (Arnold et al, 1996; Duman & Yagci,
2006). There are also studies on the factors that
impact store loyalty (Sivadas & Baker-Prewitt,
2000; Oderken-Schroder et al., 2001; Huddleston et
al., 2004; Merrilees et al., 2007). In some studies,
the relationship between store image and loyalty
was examined (Akdogun et al. 2005; Atakan &
Burnaz, 2007). Also some studies examined the
relationship between store image and store choice
and loyalty (Gilmore et al., 2001; Koo, 2003; Thang
& Tan, 2003).
Research suggests that quality, price, availability of
new products and product value are the product
attributes that influence consumer attitude (Miranda,
Konya & Havrila, 2005). Similarly, in another
study, Yilmaz et al., (2007) found that for
consumers, the location of the shopping mall,
product, price and quality, physical appearance,
attitude of store staff were important factors shaping
consumer outlet selection preferences. Yalcin
(2005) posit that such demographic factors as age,
occupation and number of children affect Multi
chain retail loyalty. In their own study, Akinci et al.
(2007) found that the most important factors that
affect multi product retail patronage are pricing,
quality and waiting time at the cashier. Again, Polat
and Kulter (2007) found that the factors which
determine consumers’ market and Multi chain retail
choices include product diversity, product quality,
inner atmosphere and appearance, quick shopping
facility, attitude and interest of staff, and prices of
goods. In another study by Duman and Yagci
(2006), it was discovered that consumers’ patronage
intentions are affected by value perception, product
quality perception, service quality perception,
discount perception and comparable price
perception. Yeniceri and Erten (2008) investigated
the impact of trust and commitment on store loyalty.
The quality of retailer service is generally assessed
Available online: https://edupediapublications.org/journals/index.php/IJR/ P a g e | 1510 their attentiveness, kindness, politeness, staff level
of experience, safe shopping environment etc
(Cronin et al., 2000). In addition to the foregoing,
special discounts and promotion were found to
increase consumers’ interest toward the Multi chain
retail (Grewal et al., 1998a). These discounts and
promotions are considered as a financial sacrifice by
the business which attracts consumers. This
perception has been determined to affect patronage
behaviour. It was seen that consumers who think
that they have profit due to discounts promotions
displayed more loyalty to the store (Grace &
O’Cass, 2005). Another factor that affects
consumers’ preferences is the quality of the
products offered by the retailer. While evaluating
the quality of the products that they purchase,
consumers use some cues. In another instance,
perception of value and satisfaction were found to
affect consumers’ attitude and store loyalty and
intention to purchase (Grace & O’Cass, 2005).
The present study aims to understand the purchase
behavior of consumers shopping at Shoppers Stop.
It also identifies the factors which influence the
purchase behavior of consumers in terms of
products, service, store layout and other cues.
Research Gap and Research Problem
Shopping orientation intends to capture the
shoppers' motivations, their desired shopping
experiences, and the goals they seek when they
shop. Previous research also found that shopping
orientation influences consumer behaviors in terms
of different preferences for information sources,
store choices, and store attributes (Gutman and
Mills, 1982; Lumpkin, 1985; Shim and Kotsiopulos,
1993). Consumer today has immense choice to buy
her choice of merchandize across different stores.
Multi-brand retail store format is one of very
successful store formats in the retail sector.
Shopping orientation would be very useful to
understand ever-changing demands and
demographic information of multi-channel shoppers
due to social, economic, and cultural changes in the
modern society. The existing Indian players have
widened their operations to smaller cities with the
burgeoning Indian middle class that is demanding
latest products in these cities. Understanding
behavior of consumers in a multi-product retail
chain becomes very interesting especially in the
presence of online channels and new entrants in the
sector. While the largest company in this sector
Lifestyle International is expanding, the poster boy
of Indian multi-brand retail format, Shoppers Stop is
closing many of its stores (Jacob & Malviya, 2012;
Tyagi, 2017). Amid news of posting losses in recent
quarters and shifting focus to online presence by
Shoppers Stop (ET-Bureau, 2016; ET-Bureau, 2017;
PTI 2017; Srinivasan, 2017), it becomes all the
more important to understand the behavior of
shoppers at Shoppers Stop so that it can rebound in
this rapidly changing industry sector.
Objectives of the study
In this research, we analyzed the buying behavior of
consumers of the leading multi-product retail chain
Shoppers Stop. We also analyzed factors that
distinguish whether the consumer will prefer
Shoppers Stop over other multi-product retail
chains. The objectives of this study are to:
Available online: https://edupediapublications.org/journals/index.php/IJR/ P a g e | 1511 to understand consumer behavior
2. Analyze differences in consumers at Shoppers
Stop and competition
This study will help in analyzing buying behavior of
different consumer segments of Shoppers Stop and
in comparing consumer profile of Shoppers stop and
its competition. It will also help in finding key
points of differentiation and areas of improvements
for Shoppers Stop in terms of managerial
implications of this research.
Research methodology
We conducted a survey on the buying behavior of
the consumers of multi-product retail stores. The
target audience included shoppers from Delhi.
Questionnaire included three sections with first
section focusing on demographic variables, second
section focusing on how consumers behave, and last
section focusing on which in-store factors influence
buying behavior of consumers. We explored
opinions, of consumers of Shoppers Stop and
competition, about different products, their
preferences, and their suggestions to retail store for
improving their satisfaction. Following information
captures their buying behavior at a multi-brand
retail store like Shoppers Stop –
1. Attractors in product categories- apparels,
accessories, shoes & bags, cosmetics, jewelry,
and others.
2. Attractors in buying occasions- festivals, and
gifting.
3. Influencers in their buying decision-
advertisements, price, quality, store promotion,
family, friends, brands, past experience and
others.
4. Shopping companions - friends or different
family members or they go alone.
5. Ranking of six important store attributes -
exchange and return policy, staff behavior,
billing facility, parking facility, location of
store, and store layout.
The options for above close-ended questions were
found important in a preliminary qualitative study
involving focus group discussions and face to face
interviews with such consumers. Primary data was
collected through an online survey conducted in the
Delhi. The questionnaire was sent to 150
respondents, out of which we received 120
responses (Response Rate: 80%). Out of the 120
responses, 29 responses were not complete resulting
in 91 valid and complete responses.
Data Examination
Respondents included 51% females and 85%
consumers of Shoppers Stop. 70% of Shoppers Stop
visitors (and 65% of non-visitors) were from 18-25
years age group. This was followed by 19% of
visitors (and 14% of non-visitors) in 25-35 years
age group. This data was further analyzed using
relevant bivariate and multivariate analysis
techniques in MS excel 2010 and SPSS 20.
Techniques used were factor analysis, cluster
analysis, discriminant analysis and cross tabulation.
Data analysis
Factor analysis was used to find factors that
influence and attract shoppers at multi-brand retail
stores. Cluster analysis was done to find different
segments of consumers based on the importance that
Available online: https://edupediapublications.org/journals/index.php/IJR/ P a g e | 1512 retail store. Discriminant analysis was also done to
find relation between different consumer groups and
the factors responsible for influencing and attracting
shoppers. Cross tabulation was used for two
purposes. Firstly, to find how visitors of Shoppers
Stop differ from non-visitors. Secondly, to find out
relative differences among different consumer
groups on different dimensions of analysis.
Factor Analysis
Exploratory Factor analysis is done to reduce the
number of variables that influence and attract
different shoppers. For this, all 17 variables related
to influencers and attractors (captured through
points 1, 2, and 3 listed in section on Research
methodology) are first tested for reliability before
doing factor analysis.
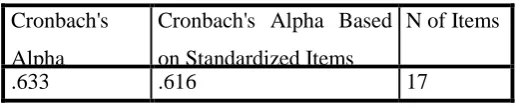
Reliability Analysis: The present study uses cronbach’s alpha to measure the internal
consistency reliability. The reliability of the scale is found to be acceptable with cronbach’s alpha > 0.6 (Malhotra & Dash, 2016, p 291) as shown in
Table I.
Table I: Scale Reliability
Cronbach's
Alpha
Cronbach's Alpha Based
on Standardized Items
N of Items
.633 .616 17
This scale is then subjected to Principal Component
Analysis with varimax rotation with kaiser
normalization (PCA) in SPSS 20. It was analyzed
for appropriateness of factor analysis using
Bartlett’s Test of Sphericity and
Kaiser-Meyer-Olkin (KMO) measure of sampling adequacy. The
null hypothesis that the population correlation
matrix is an identity matrix, is rejected by Bartlett’s
Test of Sphericity. The approximate Chi-square
statistic is 226.342 with 136 degrees of freedom,
which is significant at 0.05 level. The value of
KMO statistic (0.572) is also large (> 0.5). Thus
factor analysis is an appropriate analysis technique
here (Malhotra & Dash, 2016). PCA is used to find
out components or factors (referred to collectively
as “factors” hereafter in this paper) that account for
large amounts of overall variance.
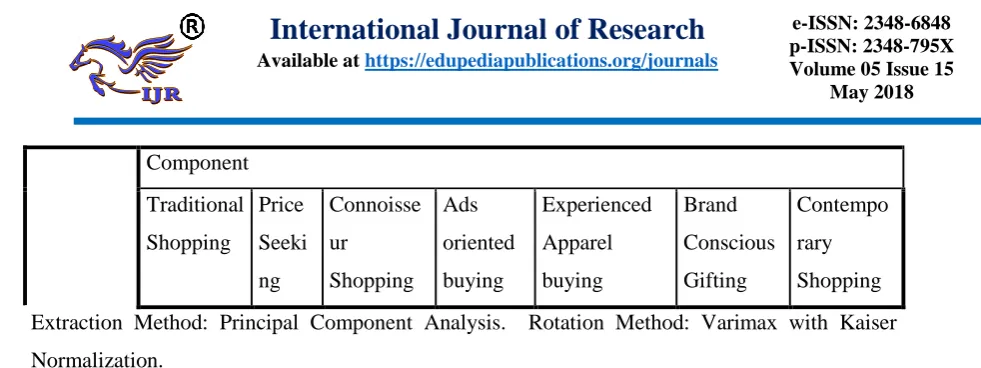
Table II: Factor Analysis - Rotated component matrixa
Component
Traditional
Shopping
Price
Seeki
ng
Connoisse
ur
Shopping Ads
oriented
buying
Experienced
Apparel
buying
Brand
Conscious
Gifting
Contempo
rary
Available online: https://edupediapublications.org/journals/index.php/IJR/ P a g e | 1513 Component
Traditional
Shopping
Price
Seeki
ng
Connoisse
ur
Shopping Ads
oriented
buying
Experienced
Apparel
buying
Brand
Conscious
Gifting
Contempo
rary
Shopping
ShoeBag_
Att Excellent
Acces_Att Excellent
Fam_influ
enced Good
Fest_Att Good Fair
Cosme_At
t Fair
Price_infl
uenced
Excell
ent
StoreProm
_influence
d
Excell
ent
Others_At
t Excellent
Jewel_Att Good
Qual_influ
enced Fair Fair
Other_Infl
uenced V. Good
Ads_influ
enced V. Good
Appar_Att Excellent
PastEx_inf
luenced Good
Gift_Att Excellent
Brand_infl
uenced Fair
Friend_inf
Available online: https://edupediapublications.org/journals/index.php/IJR/ P a g e | 1514 Component
Traditional
Shopping
Price
Seeki
ng
Connoisse
ur
Shopping Ads
oriented
buying
Experienced
Apparel
buying
Brand
Conscious
Gifting
Contempo
rary
Shopping
Extraction Method: Principal Component Analysis. Rotation Method: Varimax with Kaiser
Normalization.
a. Rotation converged in 34 iterations.
Total variance explained by the factor solution is
64.14%, which is more than 50%. Communality is
sum of squared component loadings and represents
amount of variance accounted by all components in
that variable (Gorsuch, 1983). It is also suggested
(Streiner, 1994) that solution should explain at least
half of each variable’s variance, so the communality
for each variable should be 0.5 or higher. It is
suggested (Floyd & Widaman, 1995) that in case
variable communalities are low, variables with
relatively weak factor loadings on all factors can be
eliminated to improve the overall factor solution.
Communality of variable PastExperience_influencer
was slightly less at 0.484 but it was retained in the
scale. The component solution so obtained was
rotated using varimax rotation method and the
rotated component matrix was obtained.
Determination of factors is done by utilizing
procedures (Bryant & Yarnold, 1995) (Brown,
2009) of percent of cumulative variance (Total
variance explained > 50%), Kaiser’s Stopping Rule
(Eigen value > = 1), Scree Test (Factors shown
above the Scree), and number of non-trivial factors
(factors with high loadings from over one variable).
All these methods yielded a seven factor solution.
For analyzing number of non-trivial factors, factor
loading of variables can be categorized as excellent,
very good, good, fair, & poor if factor loadings are
more than 0.71, 0.63, 0.55, 0.45, & 0.32
respectively (Comrey & Lee, 1992). Ignoring poor
loadings, the factor solution can be represented as
shown in Table II for mentioned components. The
factors are named as per variables that they
represent.
The seven factors identified along with their items
are listed in Table III.
Table III: Factor Descriptions
Traditional Shopping
Buy Shoes, Bags, Accessories, Cosmetics and
Fragrances; Influenced by Family; Buy more during
festivals
Price Seeking Influenced by Price and Store Promotions
Available online: https://edupediapublications.org/journals/index.php/IJR/ P a g e | 1515 products; Influenced by Quality
Ads oriented buying
Influenced by Ads and other reasons; Buy more during
festivals
Experienced Apparel buying Buy Apparels; Influenced by past experience
Brand Conscious Gifting Buy for gifting; Influenced by Brands
Contemporary Shopping Attracted to Quality; Influenced by friends
Cluster Analysis
The cluster analysis is done to segment consumers
in different groups where consumers in each group
are similar to each other but are different to
consumers of other groups (Hair, Black, Babin &
Anderson, 2017). The original data was rank data
with reducing ranks from one to six for these six
attributes. Therefore, the data for cluster analysis
was reverse coded so that higher values represent
higher importance given by consumers. In this
study, consumers are grouped based on importance
that they attach to different attributes of a multi
brand retail store. For this, the data is subjected to
hierarchical clustering as well as non-hierarchical
clustering. In the hierarchical clustering, the squared
Euclidean distance is used to measure the similarity.
Agglomerative clustering with Ward’s linkage
method is used. The number of clusters is
determined as three using the difference between
successive coefficients in the agglomeration
schedule (Nargundkar, 2015).
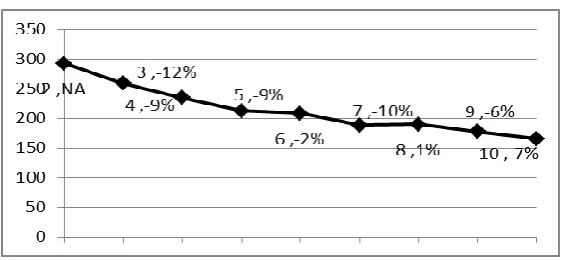
Figure 1: Elbow method for determining clusters
Using elbow method in k-means non-hierarchical
clustering using, the number of appropriate clusters
is revalidated as three (Christopher, Prabhakar &
Hinrich, 2009). In elbow method, the sum of
squared distance of all members from their
respective cluster centroids is plotted for each k i.e.
number of clusters and the elbow in the graph
determines the appropriate number of clusters. The
graph in figure 1 clearly validates that the
appropriate number of clusters is three in this case.
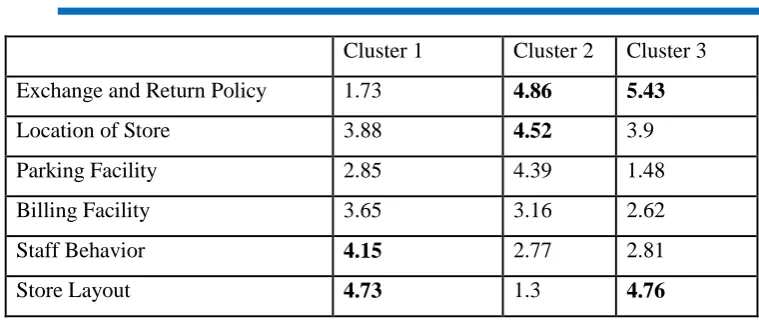
Available online: https://edupediapublications.org/journals/index.php/IJR/ P a g e | 1516 Cluster 1 Cluster 2 Cluster 3
Exchange and Return Policy 1.73 4.86 5.43
Location of Store 3.88 4.52 3.9
Parking Facility 2.85 4.39 1.48
Billing Facility 3.65 3.16 2.62
Staff Behavior 4.15 2.77 2.81
Store Layout 4.73 1.3 4.76
Using elbow method in k-means non-hierarchical
clustering using, the number of appropriate clusters
is revalidated as three (Christopher, Prabhakar &
Hinrich, 2009). In elbow method, the sum of
squared distance of all members from their
respective cluster centroids is plotted for each k i.e.
number of clusters and the elbow in the graph
determines the appropriate number of clusters. The
graph in figure 1 clearly validates that the
appropriate number of clusters is three in this case.
Table IV shows final cluster centers for the cluster
analysis. The minimum and maximum score for
each attribute are 1 and 6 respectively. Top two
important attributes (marked bold in Table IV) for
each cluster are included in
Table V along with their nomenclature based on
demographic characteristics of the predominant
consumers present.
Table V: Cluster wise top two important store attributes
Cluster Description Most important attribute Second most important attribute
Cluster 1-
Career beginners Store Layout Staff Behavior
Cluster 2-
Working
professionals
Exchange and Return
Policy Location of Store
Cluster 3-
Students
Exchange and Return
Available online: https://edupediapublications.org/journals/index.php/IJR/ P a g e | 1517
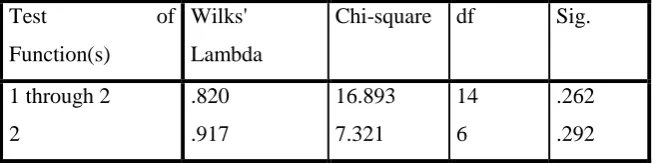
Discriminant Analysis
Discriminant analysis is done to understand relation
of different consumer groups with the factors
responsible for influencing and attracting
consumers. As shown in
Table VI, the Wilks’ Lambda comes out to be
non-significant indicating that the discriminant function
does not discriminate significantly (Malhotra &
Dash, 2014). This means that we cannot proceed
further with discriminant analysis for this data set.
This in turn means that the factors responsible for
influencing and attracting different consumer groups
do not discriminate among different consumer
groups.
Table VI: Canonical Discriminant Function - Wilks' Lambda
Test of
Function(s)
Wilks'
Lambda
Chi-square df Sig.
1 through 2 .820 16.893 14 .262
2 .917 7.321 6 .292
Cross Tabulation
The cross tabulation is done for understanding
differences between consumers on two dimensions.
First dimension is whether consumers shop at
Shoppers Stop or not. The second is their grouping
as per the cluster analysis. For cross tabulation in
both categories, the comparison is done with the
sample average unless otherwise mentioned. The
comparison is done by examining column
percentages and chi-square tests of significance,
wherever necessary. The interpretation of cross
tabulation is included in the next section.
Top of mind awareness
Brand Recall for different brands was done as part
of this research by asking consumers directly. This
helps in understanding top of mind awareness in
different product categories sold at multi-brand
retail stores. Following are top two brands that
consumers recalled in different categories –
Apparels: Levis and Biba
Shoes: Nike and Adidas
Handbags: Tommy Hilfiger and Baggit
Cosmetics: Lakme and MAC
Fragrances: Calvin Klein and Burberry
Almost all of above brands are international brands
except Biba, which is a home grown brand.
Findings and Discussion
In this section, first the interpretation of analysis of
whole data is presented followed by the
interpretation of differences between shoppers and
non-shoppers of Shoppers Stop. This is followed by
interpretation of differences among different
consumer groups as done using cluster analysis and
cross tabulation.
Seven factors were found to be important for the
whole data. These were Traditional Shopping, Price
Seeking, Connoisseur Shopping, Ads oriented
buying, Experienced Apparel buying, Brand
Conscious Gifting, and Contemporary Shopping.
Available online: https://edupediapublications.org/journals/index.php/IJR/ P a g e | 1518 significantly between three consumer groups on the
basis of these seven factors. Therefore, these factors
although important for overall group could not be
used to find differences among these consumer
segments.
In general, results show that family members
accompany about 50% of visitors and also influence
50% shoppers in final decision making. Friends are
next most significant sets of people (with 2 out of 5
visitors) accompanying shoppers in the store and
influencing them in decision making (2 out of 5
shoppers). Thus, those accompanying shoppers have
greater influence on their decision making.
Irrespective of the age, females spent a considerable
amount of time shopping as compared to the male
counter parts. These attributes were identified as
important for respondents while shopping at a retail
store - Variety (60%), Quality (47%), Consumer
Satisfaction (45%), and Offers & Promotions
(43%). Shopper's Stop has variety of products for a
particular brand but does not have all major brands
under its Umbrella. Brands like Zara, Jack and
Jones, AND etc. have their standalone shops which
is the reason why most of the respondents had
mentioned Variety as one of the lacking attributes
for Shopper's Stop. The data shows that ads seldom
influence these buyers but all are influenced by
in-store promotions greatly.
Results show that a consumer mostly visits multi
product retail chains for apparels and accessories.
The consumer visits Shoppers Stop due to three
important factors - quality, in-store promotions and
brand name. Consumer still prefers to buy in a
physical store over online stores. Consumer
purchase behavior changes positively with price of
the product and availability of products. Consumer
purchase behavior changes negatively due to poor
quality of products.
Comparing shoppers of Shoppers Stop and
Competition
There is hardly any difference between shoppers of
Shoppers Stop and those of competition in terms of
age group (Sig. of chi sq. = 0.094), occupation (Sig.
of chi sq. = 0.910) and gender (Sig. of chi sq. =
0.592). There are no differences between two
groups in terms of buying for festivals (Sig. of chi
sq. = 0.285) or gifting (Sig. of chi sq. = 0.180). Both
groups are similar in buying apparels (Sig. of chi sq.
= 0.534), cosmetics (Sig. of chi sq. = 0.557), shoes
and handbags (Sig. of chi sq. = 0.583). Both groups
do not differ in terms of being influenced by
advertisements (Sig. of chi sq. = 0.297), price (Sig.
of chi sq. = 0.189), product quality (Sig. of chi sq. =
0.123), in-store promotions (Sig. of chi sq. = 0.260),
past experiences (Sig. of chi sq. = 0.326).
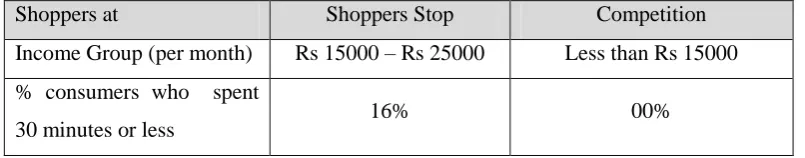
Table VII: Differences in shoppers of Shoppers Stop and Competition
Shoppers at Shoppers Stop Competition
Income Group (per month) Rs 15000 – Rs 25000 Less than Rs 15000
% consumers who spent
Available online: https://edupediapublications.org/journals/index.php/IJR/ P a g e | 1519
Shoppers at Shoppers Stop Competition
% consumers who spent Rs
1000 – Rs 3000 38% 50%
% consumers who spent Rs
3000 – Rs 5000 34% 22%
Mostly go with Friends Family
% who shop alone (Sig. of
chi sq. = 0.028) 25% 00%
% who get influenced by
brands (Sig. of chi sq. =
0.011)
51% 14%
% who buy accessories
(Sig. of chi sq. = 0.031) 44% 14%
% who buy jewelry (Sig. of
chi sq. = 0.044) 08% 29%
Both groups differ on several other aspects
including income level and other buying preferences
like money spent per visit and time spent per visit.
Shoppers Stop has more representation from income
group of Rs 15000-25000 whereas competition has
more representation from income group of less than
Rs 15000. In terms of percentage of shoppers who
spend more than 30 minutes per visit, 84% shoppers
of Shoppers Stop compare fairly ok with 100%
shoppers of competition. Shoppers Stop has less
consumers at 38% who spent between Rs 1000 – Rs
3000 compared with 50% of competition whereas
Shoppers Stop has more consumers at 34% who
spent between Rs 3000 – Rs 5000 compared with
22% of competition. Thus, even though % of
consumers who spend between broad range of Rs
1000 – Rs 5000 are almost same at Shoppers Stop
and competition, more consumers spend money in
higher category (Rs 3000-Rs 5000) at Shoppers
Stop than those at competition.
Most shoppers of Shoppers Stop prefer to go with
friends whereas more non-shoppers prefer to go
with family. Accordingly, more shoppers get
influenced by friends whereas more non-shoppers
get more influenced by family. Shoppers of
Shoppers Stop get influenced by brands whereas
non-shoppers do not get influenced by brands.
About half of shoppers of Shoppers Stop buy
accessories whereas very few non-shoppers buy
accessories. In comparison to non-shoppers, very
few shoppers of Shoppers Stop buy jewelry. Table
VII shows all these differences between shoppers of
Shoppers Stop and Competition.
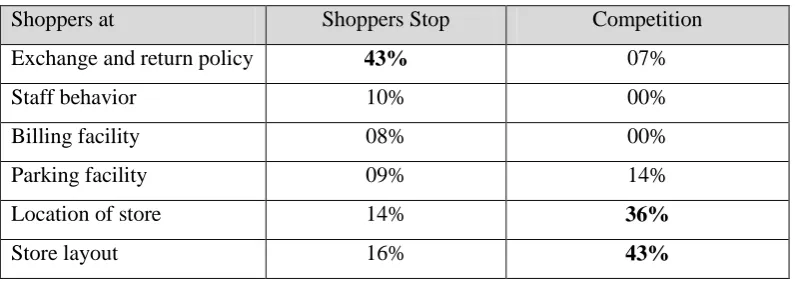
In terms of features of a multi-brand retail store,
different attributes received highest importance by
Available online: https://edupediapublications.org/journals/index.php/IJR/ P a g e | 1520 competition. Compared with competition’s
consumers, Shoppers Stop consumers rated
Exchange and return policy, Staff behavior and
Billing facility are more important. Conversely,
competition’s consumers rated store layout and
location of store as more important. There was not
much difference in their rating of parking facility.
Table VIII: Importance of store attributes for shopppers of Shoppers Stop and Competition
Shoppers at Shoppers Stop Competition
Exchange and return policy 43% 07%
Staff behavior 10% 00%
Billing facility 08% 00%
Parking facility 09% 14%
Location of store 14% 36%
Store layout 16% 43%
Consumer Profile
Profile of Shoppers Stop consumer- On the basis
of above, we can describe a shopper at Shoppers
Stop in income group of Rs 15000 – Rs 25000 per
month, spending mostly over 30 minutes at
Shoppers Stop. This shopper shops mostly with
friends (and sometimes alone) at Shoppers Stop to
buy goods worth Rs 1000 – Rs 5000 per visit. This
person gets influenced by brands and favors buying
accessories over buying jewelry. Most of these
shoppers to go to Shoppers stop due to its exchange
and return policy and some due to store layout and
location of store.
Profile of Competition consumer- Similarly, we
can describe a shopper at competition in income
group of less than Rs 15000 per month, spending
always over 30 minutes. This shopper shops with
family and buys goods mostly worth Rs 1000 – Rs
3000 per visit. This person is not influenced by
brands and favors buying jewelry over buying
accessories. Most of these shoppers go to
competition primarily due to store layout, and
location of store.
Segmenting consumers based on cluster analysis
Compared with the sample average, more
consumers in cluster 1 and 3 are women and more
in cluster 2 are men. Occupation wise, cluster 1
represents the sample characteristics whereas cluster
2 has more salaried and business people. compared
with the sample average. In terms of monthly
income, cluster 1 has more shoppers from income
groups of Rs 15,000-25,000 & Rs 25,000-50,000
whereas cluster 2 has more shoppers from income
groups of Rs 50,000-75,000, Rs 75,000-100,000 and
above Rs 100,000. Cluster 3 has most people in the
income group of less than Rs 15,000. Cluster 1 and
2 do not differ much in terms of age groups but the
cluster 3 has more consumers in age group of 18-25
Available online: https://edupediapublications.org/journals/index.php/IJR/ P a g e | 1521 indicate the professional life stage of predominant
consumer group. On the basis of professional life
stage of predominant consumer group, these clusters
are named as Career beginners (Cluster 1), Working
professionals (Cluster 2) and Students (Cluster 3).
Remaining interpretation uses these terms for these
three consumer segments.
More students (cluster 3) shop at their multi-brand
retail store either “once in 3 months” or “less than
once in 3 months”. The career beginners (cluster 1)
shop mostly once in 3 months whereas working
professionals (cluster 2) shop mostly either “once in a week” or “once in a month”. More students and
career beginners spend between Rs 1000-3000 per
visit whereas more working professionals spend
between Rs 3000-5000 per visit. Similarly, more
students and career beginners spend between 30
minutes to 1 hour in a buying visit whereas more
working professionals spend between 1 hour and 3
hours per visit.
Shopping companion & companion influence –
As shown in Figure 2, only 10% students go alone
whereas for career beginners and working
professionals, this is 23% and 25% respectively.
Most students go with their friends whereas only
half of working professionals go with friends.
Conversely, more working professionals go with
family as compared to students. Accordingly, more
students get influenced by friends and more working
professionals get influenced by family. This is
expected as students get less time once they move to
professional life and try to shop more with family
than with friends gradually.
Figure 2: Shopping companion & companion
influence
Influencers of buying decisions- As life stage
progresses from students to working professionals,
the influences of price, quality, past experiences,
and other factors first reduce and then increase. The
influence of brand follows opposite pattern. This is
explained as due to shifting priorities in these life
stages. Career beginners have to put extra efforts in
Available online: https://edupediapublications.org/journals/index.php/IJR/ P a g e | 1522 rely more on strong brands rather than assess
products on price, quality and past experiences. As
shown in Figure 3, the influences of ads and in-store
promotions also follow opposite patterns. The
influence of ads increases from student life stage to
working professionals life stage whereas influence
of in-store promotions reduces due to more maturity
and deliberate thinking of working professionals as
compared to students.
Figure 3: Influencers of buying decisions
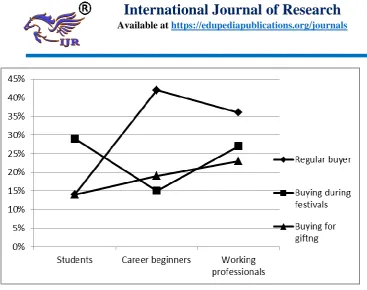
Buying occasions – The graph in Figure 4 shows
different buying occasions when these three
consumer groups shop in a multi-brand retail store
like Shoppers Stop. As a student begins career, his
regular buying at multi-brand retail store increases
due to sudden increase in disposable income and
then reduces with increase in familial and social
responsibilities. Due to same reasons, the buying
during festivals first reduces on entering the
professional life but later increases with more
mature life stage when focus shifts to greater
responsibilities.
Available online: https://edupediapublications.org/journals/index.php/IJR/ P a g e | 1523
Merchandise bought – As shown in Figure 5, the
purchase of apparels, shoes and handbags increase
at multi-brand retail stores as one becomes a
matured working professional whereas use of
accessories and jewellery reduces in the working
professional life stage. As one enters the career, one
starts to buy more cosmetics, fragrances, home
décor and other products from multi-brand retail
stores but consumers reduce buying these at a
multi-brand retail store as they establish themselves in
their professions.
Available online: https://edupediapublications.org/journals/index.php/IJR/ P a g e | 1524
Consumer suggestions -Top two suggestions that
consumers gave to improve experience at Shoppers’
Stop were-
1. Adding more variety: This is the suggestion
given by over 40% of each consumer
segment.
2. Giving better offers and discounts: This is
the second highest suggestion given by
student segment (21%) and working
professionals (14%).
3. Better layout: This is the second highest
suggestion by career beginners segment
(10%).
Implications for Marketing Managers
This research highlights different factors that
influence consumers of multi-product retail stores.
The research also categorizes consumers into three
prominent groups based on their life stage as
students, career beginners and working
professionals. Understanding retail consumers based
on their life stage has several important implications
for the marketers. These primarily relate to changes
in store design, preferred store attributes and types
of products required for succeeding in multi-product
retail. Marketers need to design specific attributes of
their stores for catering to specific consumer
segments.
As shown in
Table V, the exchange and return policy is the most
important store attribute for students and working
professionals. As shown in Figure 3, influence of
quality and price on students and working
professionals is higher than that on career beginners
therefore exchange and return policy emerged as the
most important store attribute for these two
consumer segments. Working professionals consider
location of the store as second most important
attribute, may be in terms of how close the store is
to their home to office route in order to save time
and energy.
Store layout is a very important attribute for
students and career beginners, especially for career
beginners. Career beginners who just start their
profession focus more on their new career, have
paucity of time, and thus consider store layout as
very important attribute followed by behavior of the
staff at the multi-brand retail store. This segment of
consumer may be adjusting to their new life stage in
terms of new job and increased responsibility.
Therefore, the implication for marketers is to create
such store layout so that these consumer segments
can purchase their preferred products easily and
comfortably. Shopper's Stop is a prominent
multi-brand retail chain, which is favored by consumers in
different age groups throughout their life stages.
This may not be generalized for all stores but may
be improved by conducting appropriate
market-basket analyses for different stores.
The brand recall across categories included all multi
national brands except one local brand Biba. This
may imply that consumers get attracted to a
multi-brand retail store due to foreign multi-brands. In absence
of actual sales data, we may not conclusively say if
foreign brands have higher sales. But it seems that
home grown brands also have some scope in such
Available online: https://edupediapublications.org/journals/index.php/IJR/ P a g e | 1525 to add more variety despite so many international
brands already present at Shoppers Stop. One
method for this can be to build private label brands
that career beginner segment can easily relate to if
brand is developed properly. These career beginner
consumers consider brand strength for their
purchases and do not give high importance to price
and quality. Private labels can also appeal to
working professionals who devote large amount to
time to purchase high value items and prefer to buy
during festivals. Therefore, Shoppers Stop can build
more private labels in its range of offerings.
Recently, this was realized at the company level
also and the Shoppers Stop plans to build more
private labels (Srinivasan, 2017). This research
gives support to this strategy. This study also helps
in finding important points of differentiation for
Shoppers Stop in this fast changing industry. It also
outlines certain key areas of improvement for the
company.
Key points of differentiation of Shoppers Stop
The study helps us in categorizing points of differentiation (POD) for Shoppers Stop as follows-
Points of differentiation
(POD)
Effect of
POD Possible Reasons of the effect
Time spent by consumers
by some consumers is less
than 30 minutes
Positive
This may be either due to clarity in consumers’
mind about their purchase or due to ease of
consumer decision making at Shoppers Stop or
due to both.
Equal proportion of
consumers spending Rs
3000 – 5000 and Rs 1000 –
3000 per visit compared to
competition
Positive
This may be due to ease of decision-making. On
combining this with segment analysis, it becomes
clear that higher spending is mainly by working
professionals.
25% consumers go alone Positive
When shoppers go alone, they are already clear
about their choices and may take less time in
decision making thereby reducing load on store
personnel attention.
25% consumers go alone Negative
When shoppers go alone and are already clear
about their choices, it may become difficult to
influence them in store to buy more expensive or
profitable products. Further research is required to
conclude if this is positive or negative for the
Available online: https://edupediapublications.org/journals/index.php/IJR/ P a g e | 1526 Points of differentiation
(POD)
Effect of
POD Possible Reasons of the effect
51% consumers get
influenced by brands Positive
When shoppers are clear about their brand choice,
they take less time in making choice and this
results in more consumers actually buying from
the store.
51% consumers get
influenced by brands Negative
When shoppers are clear about their brand choice,
it becomes difficult to influence them in store
towards more expensive or profitable brands.
Further research is required to conclude if this is
positive or negative for the Shoppers Stop.
44% buy accessories Positive Shoppers Stop can promote their range of clothing accessories to attract more consumers.
8% buy jewelry Negative
Either consumers do not come to buy jewelry or
they do not find good jewelry at Shoppers Stop.
This also requires further investigation.
Exchange and return policy Positive
This is the highest rated attribute of Shoppers
Stop consumers. This may be used in their
promotions.
Location of store and Store
layout Positive
If Shoppers Stop promotes these two attributes,
competition shoppers may also try Shoppers Stop
as these are highly important for them.
Key areas of improvements for Shoppers Stop
Location of store and Store layout: These two
attributes are rated important by all shoppers (Table
VIII) but for shoppers of competition, these are
highest rated attributes. If Shoppers Stop promotes
these two attributes, competition shoppers may also
try Shoppers Stop and may become loyal due to
their exchange and return policy.
Targeting working professionals: Working
professionals spend time between one and three
hours per visit and spend in higher category of Rs
3000- Rs 5000 per visit as compared to students and
career beginners who spend less than one hour and
spend between Rs 1000- Rs 3000. Shoppers Stop
can try to attract more working professionals
highlighting excellent exchange and return policy
and location of store.
Adding more variety and improving store layout:
Available online: https://edupediapublications.org/journals/index.php/IJR/ P a g e | 1527 Stop for improvement is to add more variety. This is
followed by having better offers and discounts, and
improving store layout. Adding variety in this fast
changing industry may be a challenging task
especially because the store needs to be highly
certain that the added variety does not reduce
inventory turnover. In this industry, it is difficult to
satisfy the consumer by creating novel offers and
discounts but the company must always try to be
better than competition. The suggestion for
improving store layout is significant especially if we
note that for shoppers at competition, store layout is
the most important attribute. It may imply that those
consumers who are dissatisfied from Shoppers Stop
may switch over to competition. In absence of
conclusive data, we may not be certain about it. This
issue also needs future investigation.
Overall, results have important implications for
marketers especially in metro cities, to design their
stores and product offerings as per life stage of
consumers. The study provides important insights
about the consumer preferences towards multi-brand
retail stores especially Shopper's Stop. Shopper's
Stop need to focus on bringing more variety in their
apparels section by adding a few more famous
brands like Jack and Jones, AND, and Zara, if
possible. Banerjee & Saha (2012) also corroborate
that apparel section in particular has great
opportunity of growth in Indian organized retail
industry. Shoppers Stop has been able to sustain its
business due to their Omni-channel presence and
variety in products but there is more room for
improvement in this aspect as per the study.
Conclusion
The study provides a life stage view of consumer
purchasing behavior at a prominent multi-brand
retail chain in India. It showcases that a consumer’s
purchasing behavior and preferences of buying at a
multi-brand retail store change as per her life stage.
In student life, a consumer has ample time to shop
with friends and evaluate a product’s quality, price
and past buying experience but has limited money
to spend on expensive merchandise. The consumer
goes to such stores mostly during festivals and gets
highly influenced by in-store promotions. When the
consumer enter profession, she is faced with paucity
of time and becomes a more regular shopper at
multi-brand retail stores as she can get multiple
brands under one roof and therefore relies on a
brand’s strength for validation of her purchase decision rather than evaluating product’s quality and
price. The effect of in-store promotions reduces as
consumer gives more weightage to brand now. As
the consumer becomes more mature and established
in her profession handling more responsibilities, she
again tries to evaluate quality and price and relies
less on brand strength. The consumer again comes
more during festivals but increases purchases for
gifting purposes. This view of consumer life stage
gives another tool to marketers to redesign their
offerings for different segments of consumers.
Limitations and future scope of research
The prominent limitation of this study is sample
size. Even though these are similar to those of other
published studies, a larger sample would improve
the analysis. Therefore, future studies can undertake
Available online: https://edupediapublications.org/journals/index.php/IJR/ P a g e | 1528 method chosen in this study was convenience
sampling and thus the sample may not be
representative of the population. Future studies can
chose probability sampling methods to ensure the
population representation. In terms of geographic
location, the present study focuses on consumers
based in Delhi. Therefore, future research can widen
the scope to include consumers from other cities as
well. The same will enable to compare the consumer
behaviour based on geographic location. On similar
lines, future studies can be conducted on consumers
of several multi-brand retail chains and compare
factors which influence the purchase decision across
different such chains. The same comparison can be
extended in future to be across different locations.
Future studies can focus on comparing consumer
behavior and shopping experience of multi-product
retail chain with online multi-product store.
Future research is required to understand why 25%
consumers shop alone at Shoppers Stop. This would
help in improving advertising and in-store
promotion by the store. Similarly, over half of
consumers get influenced by brands so future
research can investigate how to utilize this for
increasing the per visit spending of the consumer.
Similarly, another issue that needs investigation is
buying of jewelry by very few consumers at
Shoppers Stop as compared to those at competition.
Another important issue that warrants further
research is if Shoppers Stop consumers have
switched to competition for better store layout as
this is an important area of improvement conveyed
by consumers and is coincidentally the most
important attribute of consumers of competition.
Validation of the current research findings with
other cultures is also worthy of future study. The
moderating impacts of different products or service
categories, as well as the impact of new channels of
internet access (such as smart phones), are avenues
that merit attention as well. Nowadays, consumers
buy from multi-brand retail chains through offline
as well as online channels. Current research did not
include the online shopping experience of
consumers of multi-brand retail chains like
Shoppers Stop. Future studies can be conducted to
understand online behavior of these shoppers and to
identify the factors which changes as one moves
from a physical to a digital store. Future studies may
also evaluate and compare offline and online
purchase behavior of consumers and their
satisfaction with these modes of interactions. Future
studies should consider other types of retail formats
such as malls, departmental store and superstores
and compare the results for improving business
performance.
Acknowledgements
We profusely thank the participants, reviewers and
the session chair at the International Conference in
2017 Annual conference of Emerging Markets
Conference Board organized by and held at IIM
Lucknow, Noida campus during 5-7 Jan, 2017 for
giving their valuable feedback that enriched the
initial draft. We acknowledge the valuable support
of our several scholar colleagues of Ph.D. batch
Available online: https://edupediapublications.org/journals/index.php/IJR/ P a g e | 1529
References
[1]. Arnould, E., Price, L. & Zinkhan, G. (2002). Consumers. Boston: McGraw-Hill.
[2]. Aghekyan-Simonian, M., Forsythe, S., Suk Kown, W., Chattaraman, V., 2012. The role of product brand image and online store image on perceived risks and online purchase intentions for apparel, Journal of Retailing and Consumer
Services, 9, 325–331.
[3]. Balabanis, G. and Reynolds, N. (2001) “Consumer attitudes towards multi-channel retailers' web sites: the role of involvement, brand attitude, internet knowledge and visit duration”, Journal of
Business, 18, 105–131.
[4]. Brown, J. D. (2009, May). Questions and answers about language testing statistics: Choosing the Right Number of Components or Factors in PCA
and EFA. Shiken: JALT. Testing & Evaluation SIG
Newsletter, 13 (2), 19-23.
[5]. Bryant, F. B., & Yarnold, P. R. (1995).
Principal-components analysis and confirmatory factor analysis. In L. G. Grimm & P. R. Yarnold
(Eds.), Reading and understanding multivariate
statistics. Washington, DC: American Psychological
Association.
[6]. Burnes, B. and Towers, N. (2015) “Consumers, Clothing Retailers and Production Planning and Control in Smart City”, Production
Planning and Control, 27 (6), 490-499.
[7]. Choudhary H., Tripathi G. (2012), An Analysis of Inventory Turnover and its Impact on Financial Performance in Indian Organized Retail Industry. Journal of Services Research, 12 (1), 43-64.
[8]. Christopher D. M., Prabhakar R. & Hinrich S. (2009) Introduction to Information Retrieval, Cambridge University Press. Online edition. p365-368. Retrieved Apr 21, 2017 from https://nlp.stanford.edu/IR-book/pdf/16flat.pdf. [9]. CII- AT Kearney (2006), Retailing in India:
Getting organized to drive growth Retrieved
September 15, 2016 from A T Kearney https://www.atkearney.com/consumer-products-
retail/ideas-insights/featured-article/- /asset_publisher/KQNW4F0xInID/content/retail-in-india-getting-organized-to-drive-growth/10192. [10]. Comrey, A. L., & Lee, H. B. (1992). A first course in factor analysis (2nd ed.). Hillsdale, NJ: Lawrence Erlbaum Associates.
[11]. Court, D., Elzinga, D., Mulder, S. and
Vetvik, O. (2009). The consumer decision journey.
McKinsey Quarterly. 3,96-107.
[12]. Dennis, C., Marsland, D., Cockett, W.A., 2001. The mystery of consumer behaviour: market segmentation and shoppers’ choices of shopping centres, International Journal of New Product
Development and Innovation Management, 3 (3),
221–237.
[13]. Doherty, N. and Ellis-Chadwick, F. (2010) “Internet retailing: the past, the present and the future”, International Journal of Retail &
Distribution Management, 38 (11/12), 943-965.
[14]. Dunne, D., Narasimhan, C., 1999. The new appeal of private labels. Harvard Business Review, 77, 41–52.
[15]. ET-Bureau. (2016, November 03). Shoppers
Stop sees 11% decline in Q2 . The Economic Times.
Retrieved from
http://economictimes.indiatimes.com/markets/stocks
/earnings/shoppers-stop-sees-11-decline-in-q2/articleshow/55229280.cms
[16]. ET-Bureau. (2017, January 31). Shoppers
Stop posts 15.3% drop in Q3 net profit at Rs 19
crore . The Economic Times. Retrieved from
http://economictimes.indiatimes.com/markets/stocks /earnings/shoppers-stop-posts-15-3-drop-in-q3-net-profit-at-rs-19-crore/articleshow/56896111.cms
[17]. Floyd, F. J., & Widaman, K. F. (1995).
Factor analysis in the development and refinement
of clinical assessment instruments. Psychological
assessment, 7(3), 286.
[18]. Frasquet, M., Gil, I. & Molle Â, A. (2001). Shopping-centre selection modeling: a segmentation approach. The International Review of Retail,
Distribution and Consumer Research, 11(1) 23-38.
[19]. Gorsuch, R. L. (1983). Factor analysis (2nd ed.). Hillsdale, NJ: Lawrence Erlbaum Associates. [20]. Grace, D., O’Cass, A., 2002. Brand associations: looking through the eye of the beholder. Qualitative Market Research: An
International Journal, 5, 96–111.
[21]. Grace, D., O’Cass, A., 2005. Service branding: consumer verdicts on service brands.
Journal of Retailing and Consumer Services, 12,
125–139.
[22]. Gutman, H. and Mills, M.K. (1982), Fashion life style, self-concept, shopping orientation and store patronage: an integrative analysis, Journal of Retailing, 58 (2), 63-86.
[23]. Hair, J. F., Black, W. C., Babin, B. J., &
Anderson, R. E. (2017). Multivariate data
analysis (7th ed), Noida, India: Pearson.