THE NANOSTRUCTURED SILICON FROM RICE HUSKS FOR HIGH PERFORMANCE Li-ION BATTERY ANODES: SYNTHESIS, CHARACTERIZATION AND
ELECTROCHEMICAL PROPERTIES
SIGEI KIPKIRUI ENOCK, B.Ed (Sci) REG. NO: I56/22808/2012
A Thesis Submitted in Partial Fulfillment of the Requirements for the Award of the Degree of Master of Science (Chemistry) in the School of Pure and Applied Sciences of Kenyatta
University
DECLARATION
This thesis is my original work and has not been presented for a degree in any other University or for any other award.
Sigei Kipkirui Enock Reg. No: I56/22808/2012
Signature:……….. Date……….
We confirm that the work reported in this thesis was carried out by the candidate under our supervision.
Dr. Eric Masika
Chemistry Department Kenyatta University
Signature: ………...Date: ………...
Dr. Dickson M. Andala
Department of Physical Sciences Multimedia University of Kenya
DEDICATION
ACKNOWLEDGEMENTS
I recognize and appreciate the collective and individual hard work of my supervisors, Dr. Dickson M. Andala and Dr. Eric Masika in providing thorough academic guidance and support to this work. I am exceedingly thankful to Dr. Andala for his kind, consistent and constant educative guidance throughout my research and also grateful for the support he provided in the shipment of some chemicals and reagents from Durban, South Africa and air lifting of samples for further analysis in Binghamton University, NY, USA. I will also not forget Dr. Masika for his great input in enlightening me on correct and acceptable mode and format of thesis-writing as stipulated by the Kenyatta University as well as scrutinizing each and every piece in this work and giving appropriate directions as much as was necessary.
I sincerely want to thank Dr Fredrick Omenya, Binghamton University, NY, USA for assisting in carrying out electrochemical tests on the fabricated battery anodes. Many thanks to the officer in charge of Materials Testing and Research Division, State Department of Infrastructure, Ministry of Transport and Infrastructure, Republic of Kenya, for allowing me to carry out part of my study at their central laboratories. I‟m also grateful to Kenyatta University Chemistry Department staff and laboratory technicians for their support during my research. Many regards to Mr. Oloo Christianos of Fine Arts for assisting me in the initial incineration of rice husks. My fellow colleague in the research field, Mr. John Hena who contributed a lot in sharing resources and research materials, I thank him very much. I wish to express my heartfelt gratitude to my dad Simion K Malel for his visionary guidance, advice and financial support to this study.
TABLE OF CONTENTS
DECLARATION ... ii
DEDICATION ... iii
ACKNOWLEDGEMENT ... iv
TABLE OF CONTENTS ... v
LIST OF ABBREVIATIONS AND ACRONYMS ... viii
LIST OF TABLES ... ix
LIST OF FIGURES ... x
ABSTRACT ... xii
CHAPTER ONE ... 1
INTRODUCTION ... 1
1.1 Background Information ... 1
1.2 Problem Statement and Justification ... 3
1.3 Hypotheses of the Study ... 5
1.4 Objectives ... 5
1.4.1 General Objective ... 5
1.4.2 Specific Objectives ... 5
1.5 Significance and Anticipated Output ... 6
1.6 Scope and Limitations of the Study ... 6
CHAPTER TWO ... 7
LITERATURE REVIEW ... 7
2.1 Lithium Ion Battery Technology ... 7
2.2 Silicon as a Li-ion Battery Anode ... 15
2.3 Nanostructured Silicon as a Li-ion Battery Anode ... 18
2.4 Sources of Silicon Nanoparticles ... 19
2.5 Rice Husks as a Source of Amorphous Silica ... 20
2.6 Synthesis of Silicon Nanoparticles ... 22
2.7 Characterization of Silica and Silicon Nanoparticles ... 22
2.7.1 Fourier Transform Infrared (FTIR) Spectroscopy. ... 23
2.7.2 Energy Dispersive X-ray Fluorescence (EDX) ... 24
2.7.4 Particle Size Analysis ... 31
2.7.5 Electron Microscopy (EM) ... 32
2.7.5.1 Introduction to Electron Microscopy ... 32
2.7.5.2 The basic Principles of SEM ... 33
CHAPTER THREE ... 38
MATERIALS AND METHODS ... 38
3.1 Research Design ... 38
3.2 Sampling Procedure and Pretreatment ... 38
3.3 Chemicals and Reagents ... 39
3.4 Cleaning of Apparatus ... 39
3.5 Extraction of Silica ... 40
3.6 Synthesis of Silicon nanoparticles ... 41
3.7 Electrode and Cell Fabrication... 42
3.8 Physical and Chemical Measurements... 44
3.8.1 Fourier Transform Infrared (FTIR) Spectroscopy. ... 44
3.8.2 Energy Dispersive X-ray (EDX) Spectrometry. ... 44
3.8.3 X-Ray Diffraction (XRD) Analysis. ... 44
3.8.4 Scanning Electron Microscopy (SEM) Analysis ... 45
3.9 Electrochemical Measurements ... 46
3.9.1 Cyclic Voltammetry ... 46
3.9.2 Charge/Discharge Cycling Test ... 46
CHAPTER FOUR ... 47
RESULTS AND DISCUSSION ... 48
4.1 Extraction of Silica. ... 48
4.2 Effect of Incineration Temperature on the Percentage Purity of silica Obtained. ... 51
4.3 Physical and Chemical Measurements of the Extracted Silica ... 52
4.3.1 Elemental Analysis ... 52
4.3.2 FTIR Spectrophotometry ... 53
4.3.3 Structural Form Determination of the Extracted Silica. ... 55
4.3.4 Surface Morphology of the Extracted Silica. ... 57
4.5 Characterization of Silicon Nanoparticles (SiNPs) obtained Rice Husks ... 64
4.5.1 Elemental Analysis by Energy-Dispersive X-ray (EDX) spectroscopy ... 64
4.5.2 XRD Analysis ... 66
4.5.3 SEM Analysis ... 69
4.6 Electrochemical Performance and Cyclic Voltammetry Measurements ... 71
4.6.1 Cyclic Voltammetry Test ... 71
4.6.2 Galvanostatic Charge and Discharge Cycling Tests ... 73
CHAPTER FIVE ... 75
CONCLUSIONS AND RECOMMENDATIONS ... 75
5.1 Conclusions ... 75
5.2 Recommendations ... 76
REFERENCES ... 78
APPENDICES ... 85
APPENDIX I: FTIR SPECTRA ... 85
Appendix IA: FTIR Spectrum of Raw Rice Husks Ash Prepared at 600 °C ... 85
Appendix IB: FTIR Spectrum of Pre-treated Rice Husks Ash Prepared at 600 °C ... 85
Appendix IC: FTIR Spectrum of Pre-treated Rice Husks Ash Prepared at 700 °C ... 86
Appendix ID: FTIR Spectrum of Pre-treated Rice Husks Ash Prepared at 800 °C ... 86
Appendix IE: FTIR Spectrum of Pre-treated Rice Husks Ash Prepared at 900 °C ... 87
Appendix IF: FTIR Spectrum of Pre-treated Rice Husks Ash Prepared at 1000 °C ... 87
APPENDIX II: E.D.X SPECTROMETER ... 88
APPENDIX III: FOURIER TRANSFORM INFRARED SPECTROPHOTOMETER ... 89
APPENDIX IV: X-RAY DIFFRACTOMETER ... 90
APPENDIX V: SCANNING ELECTRON MICROSCOPE ... 91
APPENDIX VI: MODIFIED CLOSED REACTOR. ... 91
APPENDIX VII: NEWARE MULTI-CHANNEL BATTERY TESTER. ... 92
LIST OF ABBREVIATIONS AND ACRONYMS
b.d Below detection limit
BSE Backscattered electrons
CE Coulombic Efficiency
CRH Carbonised rice husks
CV Cyclic Voltammetry
DTGS Deuterated triglycine sulfate detector
EC Ethylene Carbonate
EDX Energy-dispersive x-ray fluorescence FTIR Fourier transform infrared spectroscopy ICDD International Center for Diffraction Data
ICL Irreversible Capacity Loss
IE Impacted Electrons
JCPDS Joint Committee on Powder Diffraction Standards LIB Lithium ion battery technology
LRHA Leached rice husk ash
MRR Magnesiothermic Reduction Reaction
NMP N-Methyl-2-Pyrrolidinone
PTRH Pre-treated rice husks PTRHA Pre-treated rice husks ash
PVDF Polyvinylidene Fluoride
RH Rice husks
RRH Raw rice husks
RRHA Raw rice husks ash
SE Secondary Electrons
SEI Solid Electrolyte Interface
SEM Scanning Electron Microscope
SiNPs Silicon nanoparticles
VC Vinylene Carbonate
WDX Wavelength-dispersive spectrometers
WDXRF Wavelength dispersive X- Ray Fluorescence
WRHA White rice husks ash
XRD X-Ray Diffraction
LIST OF TABLES
Table 2.1: Comparison of Various Anode Materials ... 15 Table 3.1: Descriptions of the Chemicals and Reagents Used. ... 39 Table 4.1: Amount of Ash obtained from Rice Husks Incinerated at 600 oC for 5 hours. ... 48 Table 4.2: Elemental analysis of RRHA, PTRHA and LRHA samples by
Energy-Dispersive X-ray (EDX) spectroscopy. ... 49 Table 4.3: Elemental analysis by Energy-Dispersive X-ray (EDX) spectroscopy of PTRHA
samples incinerated at varying temperatures for 5 hours... 53 Table 4.4: Chemical composition analysis of the synthesized Silicon nanoparticles by
LIST OF FIGURES
Figure 2.1: Rechargeable Li-metal battery; the image of the dendrite growth at the Li
surface ... 8
Figure 2.2: Rechargeable battery technologies as a function of volumetric and specific energy densities ... 9
Figure 2.3: Schematic diagram of a conventional Li-ion battery showing the anode, cathode, and electrolyte ... 11
Figure 2.4: Lithium ion capacity and electrochemical reduction potentials with respect to lithium metal for conventional anode (red axis) and cathode materials (blue axis) ... 12
Figure 2.5: Schematic diagram illustrating the mechanism of operation for a lithium ion battery ... 13
Figure 2.6: Si electrode failure mechanisms: (a) Material pulverization. (b) Morphology and volume change of the entire Si electrode. (c) Continuous SEI growth ... 17
Figure 2.7: Optical micrograph of a cracked thin silicon film after lithiation and delithiation ... 18
Figure 2.8: A schematic diagram showing the basic components of an FTIR spectrometer ... 24
Figure 2.9: Possible electron transitions generating X-rays ... 26
Figure 2.10: Schematic diagram of basic principle of XRD ... 28
Figure 2.11: Bragg‟s representation of the diffraction condition as the reflection of X-rays by lattice planes ... 29
Figure 2.12: Schematic diagram of a Scanning electron microscope ... 34
Figure 2.13: Interaction of electrons with an atom ... 35
Figure 2.14: Interaction of electrons with specimen/matter ... 37
Figure 3.1: Schematic diagram for the synthesis of Silicon nanoparticles. ... 42
Figure 3.2: Schematic diagram for the fabrication of electrodes. ... 43
Figure 4.1: Rice Husks (a); Pre-treated Rice Husks Ash (b); Leached Rice Husks Ash (c). ... 50
Figure 4.2: Carbonised Rice Husks (a); Completely Incinerated Rice Husks (b). ... 51
Figure 4.3: FTIR Spectrum of nano-silica Prepared at 1000 °C. ... 54
Figure 4.4: XRD diffractogram of silica prepared at 600 °C. ... 56
Figure 4.6: SEM microstructure images of pre-treated rice husks ash (PTRHA)
samples prepared at: (a) 600 °C, (b) 800 °C and (c) 1000 °C. ... 58
Figure 4.7: SEM micrograhs of Silica prepared at 600 °C: (a) Raw Rice Husks Ash (RRHA), (b) Pre-treated Rice Husks Ash (PTRHA) and (c) Leached Rice Husks Ash (LRHA). ... 60
Figure 4.8: SEM micrographs of LRHA samples under different magnifications: (a) 9.16 kX, (b) 35.40 kX, (c) 61.10 kX, (d) 131.89 kX. ... 62
Figure 4.9: (a) Silica/NaCl Mixture (1:10 % wt), (b) Magnesium powder, (c) Silica/NaCl/Mg Mixture (1:10:1 % wt). ... 63
Figure 4.10: (a) Si/MgO mixture; (b) Synthesized Silicon nanoparticles. ... 64
Figure 4.11: EDX spectrum of the synthesized Silicon nanoparticles. ... 66
Figure 4.12: XRD diffractogram of the synthesized Silicon nanoparticles. ... 67
Figure 4.13: Standard XRD spectra of Si (JCPDS No. 27-1402), with the major lattice orientations denoted ... 68
Figure 4.14: XRD pattern of Si nanopowder (ICDD File: 271402) ... 68
Figure 4.15: SEM micrographs of the synthesized Silicon nanoparticles under different magnifications: (a) 17.47 kX, (b) 50.73 kX, (c) 48.91 kX. ... 70
Figure 4.16: Cyclic voltammogram of Li-ion battery anode using nano-Si recovered from RHs cycled from 2.00 V to 0.01 V versus Li/Li+ at a scan rate of 0.5 mV s-1. ... 72
ABSTRACT
CHAPTER ONE INTRODUCTION 1.1 Background Information
Rechargeable lithium ion batteries are critical to today‟s information-rich and mobile society (Teki et al., 2009). Currently they are one of the most popular types of battery used in portable electronic devices because of their flexible design and high energy density (Bruce et al., 2008). Despite their increasing use at the present time, there is great continued commercial interest in developing new and improved electrode materials for use in lithium ion batteries that would dramatically lead to higher energy capacity and longer cycle life (Teki et al., 2009).
The existing methods of producing SiNPs are complex, energy-intensive and costly. (Chen et al., 2010). These methods include vapor-phase reaction, sol-gel and thermal decomposition technique (Liu et al., 2013). However, their high cost of preparation has generally limited their wide application (Chen et al., 2010; Liu et al., 2013). Thus, alternative methods of fabrication are needed to produce cheap Si nanoparticles.
Many agricultural products and by-products such as palm oil, sugarcane bagasse, rice husk ash, wheat straw ash or wheat husks ash are considered potential raw materials for preparing high-value products (Shaikh and Shaikh, 2013). In most plant species and in particular those belonging to the Gramineae family, aqueous silicic acid, Si(OH)4, is transported along the transpiration stream in the plant, where polymerization usually occurs as a result of the increased concentration of silicic acid due to transpiration (Chen et al., 2010). At the end of polymerization, silicon is thus deposited in cells and intercellular spaces also known as phytoliths (Chen et al., 2010). The phytoliths can thus be used as a cheap silica resource to prepare silicon nanoparticles (Chen et al., 2010).
2013). When rice husks are incinerated, they generates rice husks ash of between 17 % to 20 % of which about 87 % to 93 % is silica together with other metallic oxide impurities depending on the source of the rice husks (Ugheoke and Mamat, 2012). In this study, amorphous silica extracted from the rice husks by controlled combustion and acid treatment was subjected to heat scavenger assisted magnesiothermic reduction to synthesize silicon nanoparticles, unlike the metallurgical-grade silicon which is made up of micron-sized crystal particles because of the melting of silicon during the carbothermic reduction process involving high temperatures (over 2000 oC) which is way above 1410 oC, the melting point of silicon. The synthesized silicon nanoparticles played a big role in enhancing the performance of lithium-ion batteries.
1.2 Problem Statement and Justification
The inevitable depletion of non-renewable sources of energy such as fossil fuels and the accompanying environmental issues, such as carbon (iv) oxide emissions which is a green house gas, has lead to greater focus on alternative environmentally green energy resources. These include solar energy, hydroelectric power and wind energy; however, most of them are basically periodic or intermittent. Electrochemical energy storage devices, such as batteries, are essential to solve this problem, since they can efficiently store electrical energy in chemicals and release it on demand.
and improved electrode materials capable of delivering higher energy density is thus of significant interest.
Silicon is one of the most promising materials for high performance lithium-ion battery anodes because it has the highest known theoretical specific charge capacity of 4200 mAh g-1 and also is the second most abundant element on earth (Teki et al., 2009). Silicon anodes however have limited applications because of the large volume changes associated with the lithium insertion and extraction which causes cracking and pulverization of the anode (Teki et al., 2009). This leads to a gradual loss of electrical contact and eventual fading of capacity (Teki et al., 2009).
However, the application of silicon as an anode material in commercially available lithium-ion batteries has been limited by mechanical degradation and capacity decay that have typically prevented good cycling performance resulting in electrode failure (Wang and Kumta, 2010), (Wu and Cui, 2012) and (McDowell et al., 2013). Recent studies have shown that the reduction of the size of silicon to nanoscale in at least one dimension results in effective accommodation of the strain and can even prevent fracture of the electrode (Liu et al., 2013).
are organic material and hydrated silicon, has the benefit of producing economically valuable, high grade and widely applicable SiNPs in addition to reducing disposal and pollution problems.
1.3 Hypotheses of the Study
i. There is no significant difference in structure and morphology between silicon nanoparticles derived from rice husks and commercially available metallurgical-grade silicon.
ii. There is no significant difference in the specific charge capacity of nanostructured silicon anodes derived from rice husks and commercially available graphite anodes.
1.4 Objectives
1.4.1 General Objective
To synthesize and characterize silicon nanoparticles from rice husks in terms of morphology, physical and electrochemical properties to determine its suitability for high performance Li-ion battery anodes.
1.4.2 Specific Objectives
i. To synthesize silicon nanoparticles from rice husks by combustion, heat scavenger assisted magnesiothermic reduction and acid leaching.
ii. To determine the morphology, elemental purity and structure of silicon nanoparticles derived from rice husks using SEM, EDX, FTIR and XRD.
1.5 Significance and Anticipated Output
The study is geared towards providing documented information on the amounts of elemental silicon in rice husks available in Mwea region, Kenya and its suitability for high performance lithium-ion battery anodes. The findings from the study will also be a contribution to the efforts of large scale exploitation of valuable, low cost and functional silicon nanoparticles derived from agricultural byproducts through simple and energy efficient methods. The results of this work are also useful for scientists pursuing new synthetic routes for obtaining valuable and widely applicable silicon nanoparticles. This study is also pivotal in reducing disposal and pollution problems caused by continued accumulation of rice husks.
1.6 Scope and Limitations of the Study
CHAPTER TWO LITERATURE REVIEW 2.1 Lithium Ion Battery Technology
Lithium ion batteries are attractive energy storage devices with high gravimetric and volumetric capacity and the capability to deliver high rates of power (Szczech and Jin, 2011). Rechargeable lithium ion batteries have revolutionized portable electronic devices (Chan et al., 2008). They have become the dominant power source for mobile phones, laptops and digital cameras because of their superior energy density ( i.e the capability to store 2-3 times the energy per unit weight and volume compared with conventional rechargeable batteries) (Bruce et al., 2008). They are the technology of choice for future hybrid electric vehicles, which are essential to the reduction of carbon (iv) oxide emissions arising from transportation (Bruce et al., 2008).
Figure 2.1: Rechargeable Li-metal battery; the image of the dendrite growth at the Li surface (Tarascon and Armand, 2001).
In the early 1990‟s, carbonaceous material was discovered as a highly reversible and low voltage lithium-ion intercalation and deintercalation anode, as it possesses unique properties (Chen, 2013). Combining safety features of these carbon anode and the high voltage LiCoO2 cathode, the first lithium ion battery (C/LiCoO2 cell) was commercialized in 1991, and currently dominates the market for portable electronic devices ( Teki et al., 2009; Chen, 2013). Lithium ion batteries technology has a higher energy density than most other types of rechargeable battery technologies because lithium is one of the most electropositive elements (-3.04 V versus standard hydrogen electrode) as well as the lightest electrochemically active metal (Teki et al., 2009). Thus for their weight or size they can store more energy than other rechargeable battery technologies (Teki et al., 2009).
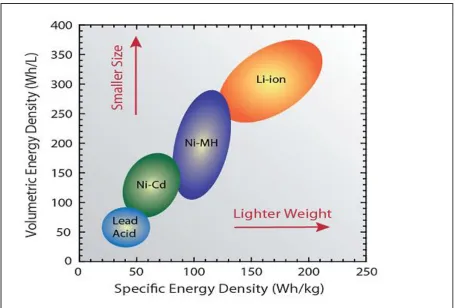
rechargeable battery technologies, lithium-ion has a lower self-discharge rate (Teki et al., 2009). The comparison of the rechargeable battery technologies commercially available as a function of volumetric and specific energy densities is presented in figure 2.2; the arrows shown indicate the direction of development to reduce battery size and weight (Landi et al., 2009).
Figure 2.2: Rechargeable battery technologies as a function of volumetric and specific energy densities (Landi et al., 2009).
that conducts the lithium ions (Szczech and Jin, 2011). Based on energy density considerations, lithium metal is one of the best anode material, because of its high inherent specific capacity (3860 mAh g-1) (Szczech and Jin, 2011). However, present commercial challenges relates to its reactivity with the electrolyte (Landi et al., 2009), as well as the electroplating of dendritic lithium during charging (Figure 2.1), which can result in short circuit, posing serious safety concerns for lithium metal anodes (Szczech and Jin, 2011). Commercially, the most popular material for use in fabricating the anode is graphite or carbon (Teki et al., 2009).
The cathode mainly falls into three categories namely, layered oxides such as LiCoO2, transition metal phosphates such as LiFePO4, or spinels such as LiMn2O4 (Teki et al., 2009). The electrolytes in lithium ion battery systems consists of lithium-salt, such as LiPF6, LiBF4, or LiClO4, in an organic solvent such as alkene carbonates or mixtures of carbonates, amides, or imides (Teki et al., 2009). Besides the lithium salts, the electrolyte additives to the lithium ion batteries, such as vinylene carbonate (VC), 1,3-propane sultone (1,3-PS) and fluoroethylene carbonate (FEC) are usually used to improve the high temperature performance of lithium-ion batteries by forming stable and effective solid-electrolyte interface (SEI) film on the graphitic anode because these additives are generally more easily reduced than the electrolyte (Han et al., 2012). Among the above mentioned additives, vinylene carbonate (VC) can form a stable SEI on the graphite negative electrode and also improve the cycle performance of batteries (Han et al., 2012).
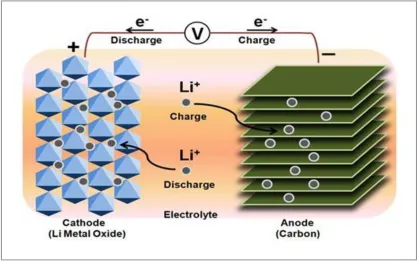
life and safety of a lithium-ion battery (Teki et al., 2009). Both the anode and cathode are generally materials into which the ionized lithium-ions can be inserted and extracted (Teki et al., 2009), because they are layered materials with interstitial spaces that are receptive to lithium-ion intercalation (Landi et al., 2009). The nature of the Li ion insertion and extraction do vary from electrochemical intercalation in the case of layered oxides and graphite which results in changes in the crystallographic and electronic structure to that of alloy formation in the case of silicon and tin (Teki et al., 2009).
Figure 2.3: Schematic diagram of a conventional Li-ion battery showing the anode, cathode, and electrolyte (Teki et al., 2009).
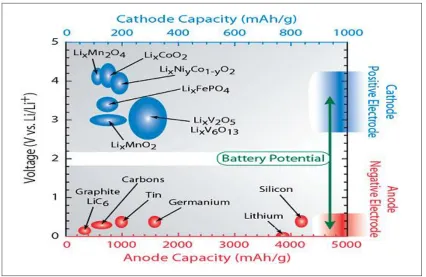
electrode (Teki et al., 2009). The relatively low capacity of the electrodes (370 mAh/g for graphitic carbon and 140-170 mAh/g for lithium metal oxide or phosphate) generally limits the total specific energy charge that can be delivered by the cell (Wu and Cui, 2012). Thus, the existing lithium ion battery technology (LIB) is currently reaching its limit in terms of energy density (per volume) and specific energy (per weight) (Wu and Cui, 2012).
Figure 2.4: Lithium ion capacity and electrochemical reduction potentials with respect to lithium metal for conventional anode (red axis) and cathode materials (blue axis) (Landi et al., 2009).
al., 2008). The active material is able to store the lithium ion because of the simultaneous electron transport by the current collector to reduce the lithium ion at the active material „„host‟‟ site (Landi et al., 2009).
The intercalation process is assisted by a necessary solid-electrolyte-interface (SEI) that usually forms on the surface of each electrode and which serves a critical role, namely to passivate the electrode surface from further solvent reduction and also act as a selective layer to allow only lithium ions to diffuse (Landi et al., 2009). The lithium ions are usually present in the electrolyte comprising a lithium salt, most often LiPF6, solvated by a mixed solution of alkyl carbonates, such as ethylene carbonate (EC) and dimethyl carbonate (DMC) (Landi et al., 2009). The choice of electrolyte solvent used is critical to the formation of a stable SEI due to decomposition of both salt and solvent species leading to layered components like LiF and LiCO3 (Landi et al., 2009).
The schematic diagram (Figure 2.5) illustrates the mechanism of operation for a lithium ion battery, showing the movement of lithium-ions between electrodes (solid lines) and the electron transport through the complete electrical circuit (dashed lines) during charging (blue) and discharging (red) states (Landi et al., 2009). In commercial Li-ion batteries, where the positive electrode materials are metal oxides or phosphates (such as LiCoO2 , LiMnO2 , or LiFePO4 ) and the negative electrode is graphite, both the positive and negative electrode materials react with Li via an intercalation mechanism (McDowell et al., 2013).
Intercalation mechanism involves Li ions or atoms residing in interstitial sites within the host lattice and thus the insertion and extraction of Li results in small strains and minimal irreversible structural changes in the host material(McDowell et al., 2013). The intercalation mechanism can result in good capacity retention over many cycles, but the specific charge capacity of these materials is relatively low due to the limited number of intercalation sites for Li ions within the host lattice (McDowell et al., 2013).
In terms of theoretical specific charge capacity, the Li-Si alloy phase can attain 4200 mAh g−1 while graphite exhibits only 372 mAh g –1 (Table 2.1) (McDowell et al., 2013). The theoretical specific capacities for other alloying anodes such as Sn Ge and, are also very high (994 mAh g −1 and 1623 mAh g −1, respectively) (McDowell et al., 2013). Since the theoretical capacity of graphite (372 mAhg-1) is low compared to other possible anode materials, such as the lithium alloys of silicon or tin, limiting the power density (Szczech and Jin, 2011). Development of high capacity anodes capable of sustaining high power rates is therefore necessary (Szczech and Jin, 2011). Among the many candidates of alloying anode materials, Si is considered one of the most promising because of its exceptionally high theoretical specific charge capacity, its abundance in the earth's crust and the benefits of a well-developed industrial infrastructure for manufacturing (McDowell et al., 2013).
Table 2.1: Comparison of Various Anode Materials (all the capacity numbers are based on materials in the delithiated state except lithium metal) (Wu and Cui, 2012).
Materials Li C Li4Ti5O12 Si Sn Sb Al Mg
Density (g/cm3) 0.53 2.25 3.5 2.3 7.3 6.7 2.7 1.3
Lithiated phase Li LiC6 Li7Ti5O12 Li4.4Si Li4.4Sn Li3Sb LiAl Li3Mg Theoretical specific
capacity (mAh/g)
3862 372 175 4200 994 660 993 3350
Volume change (%) 100 12 1 420 260 200 96 100
Potential versus Li (V) 0 0.05 1.6 0.4 0.6 0.9 0.3 0.1
2.2 Silicon as a Li-ion Battery Anode
various other oxide and nitride materials (Teki et al., 2009; Park et al., 2009). Moreover silicon has a low discharge potential (~ 370 mV vs. Li/Li+), thus making it suitable for use in high-power applications when paired with commercially available cathode materials such as LiCoO2 or LiMn2O4 (Teki et al., 2009). It is also non-toxic and thus considerable attention has been given to the use of silicon as a lithium ion battery anode material ( Teki et al., 2009; Szczech and Jin, 2011).
During the reaction of silicon with lithium, silicon is known to incorporate 4.4 lithium atoms per every silicon atom (Table 2.1) (Park et al., 2009), thus creating an alloy with high electrochemical capacity (Szczech and Jin, 2011). The lithiation process in silicon anodes results in the formation of Li12Si7, Li14Si6, Li13Si4, and Li22Si5 alloys (Kasavajjula et al., 2007). The alloy phase in the Li-Si system containing maximum lithium is Li22Si5 (Wang and Kumta, 2010). Just like graphite, the discharge curve of silicon also displays a long plateau over much of its discharge, thus delivering a stable voltage during cycling (Szczech and Jin, 2011). Moreover silicon does not suffer from solvent co-intercalation, this presents an additional advantage over graphite (Szczech and Jin, 2011).
reactions with the organic electrolyte that are aggravated by the huge volume changes (McDowell et al., 2013).
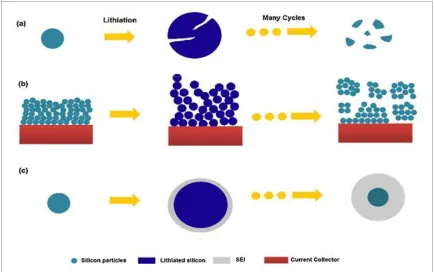
One mechanism through which mechanical fracture is thought to cause rapid capacity decay is through electrical isolation of fragments of the fractured active material (Figure 2.6 and Figure 2.7) thus, the commercial application of silicon as an anode material in the common lithium-ion batteries has been limited by mechanical degradation and capacity decay that have typically prevented good cycling performance resulting in electrode failure (Wang and Kumta, 2010; Wu and Cui, 2012; McDowell et al., 2013).
Figure 2.7: Optical micrograph of a cracked thin silicon film after lithiation and delithiation (Szczech and Jin, 2011).
Preventing mechanical degradation and reducing significantly the side reactions in silicon anodes during electrochemical lithium insertion and extraction is thus, critical in an effort towards utilizing their high specific charge capacity for high energy density and longer lasting Li-ion batteries (McDowell et al., 2013). This challenge can potentially be overcome by using silicon nanostructures that can impart facile strain relaxation thus preventing electrode pulverization, maintain essential electrical contact and have more benefits of short lithium diffusion distances and increased mass transport (Szczech and Jin, 2011). Silicon nanostructures are also advantageous for a number of reasons, which include their ability to accommodate lithiation-induced strain without fracturing on top of having a good cycle rate ability (McDowell et al., 2013).
2.3 Nanostructured Silicon as a Li-ion Battery Anode
to the nanoscale or through the introduction of other functional nanomaterials (Landi et al., 2009). It has been shown previously that reducing a material‟s particle size to nanoscale dimensions (less than 100 nm) can change the crystal structure and may even modify the mechanism of volumetric expansion during lithium insertion (Landi et al., 2009). This is because nanoscale dimensions allows quick stress relaxation, thus making the nanoparticles more resistant to fracture than the bulk crystals (Szczech and Jin, 2011).
Nanostructured materials can play a big role in enhancing the performance of lithium-ion batteries, because in nanoscale dimensions the distances over which lithium ions diffuse is dramatically reduced, hence, such nanostructured materials can quickly absorb and store large number of Li-ions without causing any degradation in the electrode (Guo et al., 2008). The nanoparticles also possess large surface areas, short distance of diffusion and fast rates of diffusion along their many grain boundaries (Guo et al., 2008). The enhanced capacities, high cycle rate performance and capacity retention capabilities of many common lithium storage systems have been found to benefit from nanoscale effects (Guo et al., 2008).
2.4 Sources of Silicon Nanoparticles
(Liu et al., 2013). The particle size are big because of the melting of silicon during the carbothermic reduction process involving high temperatures (Liu et al., 2013). Unlike the metallurgical-grade silicon, economically viable and high grade nano-sized silicon can be obtained from rice husks (D. Singh et al., 2008).
Amorphous silica can be obtained from rice husks by simply burning the husks under appropriate conditions (D. Singh et al., 2008). Wheat, which also belongs to the Gramineae family (Chen et al., 2010), is abundantly available, renewable and currently used in some limited applications (Zhang et al., 2012). It is only second to rice husks in the amount of silica it contains (Chen et al., 2010). In their ashes the silica content is over 90 % by mass with minor amounts of metallic impurities, making it one of the most economical source of nano-sized silica (Chen et al., 2010). The silica extracted from rice husks or wheat can be subjected to heat scavenger assisted magnesiothermic reduction to synthesize silicon nanoparticles (Liu et al., 2013).
2.5 Rice Husks as a Source of Amorphous Silica
high percentage of silica content found intermingling with plant fibers is quite rare in nature (Ugheoke and Mamat, 2012).
The percentage purity and colour of the ash obtained is influenced by the amount of the various metallic ions and unburned carbon respectively (Ghosh and Bhattacherjee, 2013). Controlled incineration of rice husks after removal of these metallic ions can yield white silica of high purity (Ghosh and Bhattacherjee, 2013). To obtain high purity silica from rice husks three main pre-treatment methods have generally been employed, these are; acid leaching, basic pre-pre-treatment and microbiological pre-treatment usually in combination with some acids (Ugheoke and Mamat, 2012). Before other value adding processes such as incineration begin different kinds of acids, both mineral and organic, have been reported to be used to pre-treat rice husks (Ugheoke and Mamat, 2012). However, HCl has proved to be the most efficient in the removal of metallic impurities from the rice husks and thus is by far the most widely used (Ugheoke and Mamat, 2012).
amorphous silica while crystallinity begins to set in when the temperature of incineration increases beyond 700 oC (Ugheoke and Mamat, 2012).
2.6 Synthesis of Silicon Nanoparticles
Silicon nanoparticles can be obtained directly by magnesiothermic reduction of silica, however, the massive heat released from such exothermic reaction can collapse the architectures of the silica precursors and agglomerate as-synthesized silicon nano-domains into large crystals (Luo et al., 2013). The nanoporous domains of silica can thus be preserved during the magnesiothermic reduction reaction (MRR) with the assistance of a low cost heat scavenger (NaCl) (Luo et al., 2013). The heat released in this exothermic reaction is scavenged by the fusion of NaCl and thus, effectively preventing the structure collapse and aggregation of the silicon domains (Luo et al., 2013).
2.7 Characterization of Silica and Silicon Nanoparticles
2.7.1 Fourier Transform Infrared (FTIR) Spectroscopy.
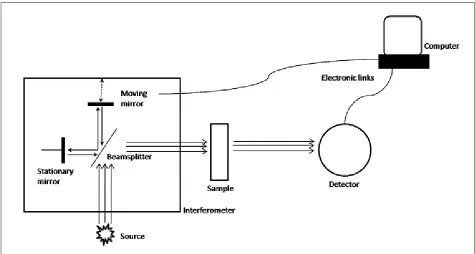
Fourier transform infrared (FTIR) spectroscopy is a physico-chemical method of analysis which is based on the measurement of vibrations of a molecule excited by IR radiation at a specific wavelength range (Davis and Mauer, 2010). Figure 2.8 presents a general schematic diagram of an FTIR spectrometer. The IR source emits radiation that is passed through an interferometer, usually a Michelson interferometer with a beam splitter (a semi-reflecting film usually made of KBr), a fixed mirror, and a moving mirror (Davis and Mauer, 2010). The interferometer uses interference patterns to make accurate measurements of the wavelength of light (Davis and Mauer, 2010). When IR radiation is passed through a sample, some radiation is absorbed and the rest is transmitted to the detector (Davis and Mauer, 2010).
Figure 2.8: A schematic diagram showing the basic components of an FTIR spectrometer (Davis and Mauer, 2010).
The infrared (IR) region (10 cm-1 - 14000 cm-1) of the electromagnetic spectrum is divided into three regions: the near-, mid-, and far-IR (Davis and Mauer, 2010). The Mid-infrared region (400 cm-1 - 4000 cm-1) is the most commonly used region for analysis since all molecules possess characteristic absorbance frequencies and primary molecular vibrations in this range (Davis and Mauer, 2010). Mid-infrared spectroscopy methods are based on studying the interaction of IR radiation with samples (Davis and Mauer, 2010). As infrared radiation is passed through a sample, specific wavelengths are absorbed causing chemical bonds in the material to undergo vibrations such as bending, stretching and contracting (Davis and Mauer, 2010).
2.7.2 Energy Dispersive X-ray Fluorescence (EDX)
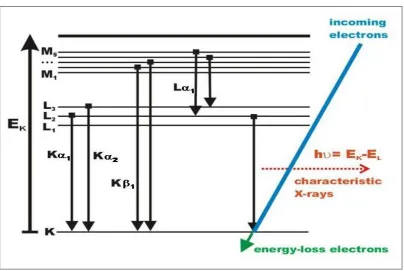
material (Wollman et al., 1997; Chen et al., 2008). It is widely used for environmental, industrial, pharmaceutical, forensic and scientific research applications to determine the presence or absence and in some cases measure the concentration of elemental constituents or contaminants (Chen et al., 2008). The fluorescing atoms can be excited by energetic electrons, ions, or photons (Chen et al., 2008).
Figure 2.9: Possible electron transitions generating X-rays (Krumeick, 2011).
The fluorescent X-rays are in general measured by two types of detection systems: energy dispersive detection (EDXRF) and wavelength dispersive detection (WDXRF) (Chen et al., 2008). Thus, two types of X-ray spectrometers are currently used for X-ray microanalysis, wavelength-dispersive (WD) and energy-dispersive (ED) spectrometers (Wollman et al., 1997). In EDXRF systems, the emitted X-rays are detected by their energies, whereas in wavelength-dispersive X-ray fluorescence (WDXRF) systems, the physical equivalent to energy, the wavelength of the characteristic photon is measured (Wobrauschek et al., 2006). This statement can be explained by the simple relation expressed in equation 2.1;
WDXRF utilizes the properties of single crystals to diffract X-rays of a specific wavelength under a specific angle (Bragg‟s law) and the intensity of the diffracted radiation is counted by a simple radiation counter e.g. Geiger–Muller counter (Wobrauschek et al., 2006). As characteristic radiation for one element has a fixed well-defined value of λ only at specific angles, a high intensity of the refracted radiation is measured (Wobrauschek et al., 2006). So using a goniometer with the Bragg crystal as the dispersive element in its center and a detector at the circumference, a continuous rotation will result in intensive peaks whenever the condition of Bragg‟s law (Equation 2.5) is fulfilled (Wobrauschek et al., 2006). By continuous rotation of the detector from 0° to 180° angle 2θ, while the crystal is in position θ, collects the photons reflected (Wobrauschek et al., 2006). This sequential measurement leads to a spectrum „„intensity versus wavelength‟‟ allowing determination of elements and concentration in the sample because the intensity is proportional to the concentration of the respective element (Wobrauschek et al., 2006).
2.7.3 X-Ray Diffraction (XRD) Spectrometry
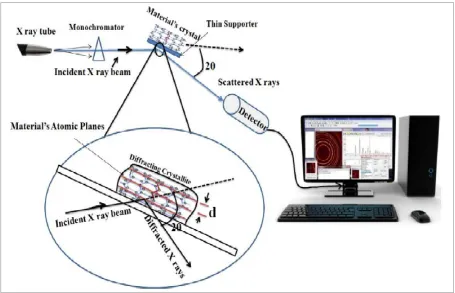
X-ray Diffraction (XRD) is one of the primary techniques used by solid state chemists and mineralogists to examine the physico-chemical make-up of unknown materials (Theivasanthi and Alagar, 2010). In XRD, a monochromatic X-ray beam is focused on sample material to resolve structural information in the crystal lattice (Rasel Das et al., 2014). When X-ray falls over a crystal sample, it diffracts in a pattern characteristic to its structure (Chauhan and Chauhan, 2014). Usually, the materials are composed of repeating uniform atomic planes which make up their crystal (Rasel Das et al., 2014).
Figure 2.10: Schematic diagram of basic principle of XRD (Rasel Das et al., 2014).
within the tube gives electrons which hit a Cr, Fe, Co, Cu, Mo or Ag anode from which X-ray beams are generated (Rasel Das et al., 2014). Filtering polychromatic X-rays through a monochromator produces monochromatic radiation which hits onto the material atomic planes, separating the diffracted, transmitted and absorbed rays (Rasel Das et al., 2014). The produced X-rays are then collimated and directed onto a powder sample having diameter <10 μm (Rasel Das et al., 2014). Interactions between the incident X-ray beam and the sample produce intense reflected X-rays by constructive interference when conditions satisfy Bragg‟s Law (Equation 2.5) (Chauhan and Chauhan, 2014).
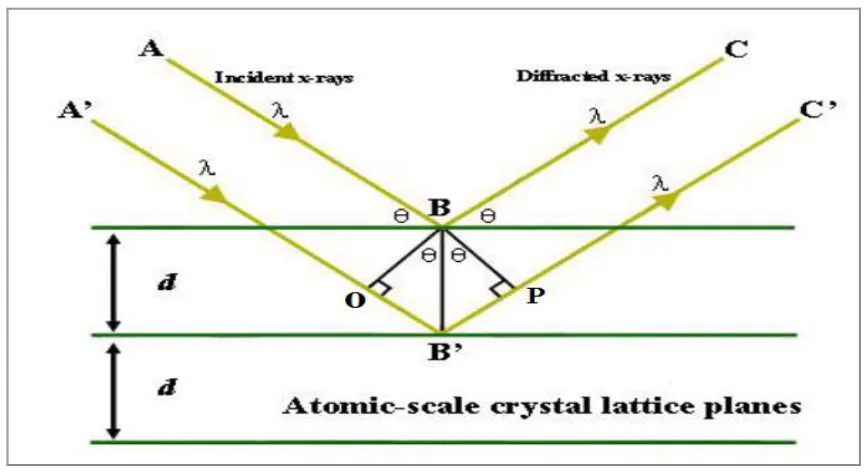
Figure 2.11: Bragg‟s representation of the diffraction condition as the reflection of X-rays by lattice planes (Khondker and Lakhani, 2015).
while A‟ continues to the next plane and is scattered by the atom B‟ (Khondker and Lakhani, 2015). If the two beams are to resume travelling in phase and parallel as C and C‟, the second beam must travel the extra distance marked on either side of B‟ by the right angle to point B‟ (let us call these points O and P), both while incident and after being scattered (Khondker and Lakhani, 2015).
If the phases of the two beams are to remain the same upon exit, then this extra distance must be an integral multiple (n) of wavelength (λ) (Khondker and Lakhani, 2015).
Therefore; n λ = OB‟ + PB‟ (2.2)
To find OB‟ and PB‟, we can apply basic trigonometry (Khondker and Lakhani, 2015). Noting that “d” is the hypotenuse of the right triangles BOB‟ and BPB‟, we can say that;
OB‟ = d sin θ (2.3)
Since OB‟ = PB‟, we can therefore state;
n λ = 2 OB‟ (2.4)
Substituting equation (2.3) into equation (2.4) yields Bragg‟s law (Equation 2.5), (Khondker and Lakhani, 2015).
n λ = 2d sin θ (2.5)
Where n is an integer defining order of diffracted beam, λ represents wavelength of the incident X-ray beam, d marks the distance between near atomic planes or d-spacing and θ represents the angle of the incident X-ray (Rasel Das et al., 2014).
may be easily calculated from observed diffraction angles, provided the wavelength is known, using the Bragg equation (Lavina et al., 2014). Changeover of diffracted patterns into d-spacings allows recognition of the unknown sample (Rasel Das et al., 2014).
Materials are typically identified by comparing the diffracted pattern beams with many reference patterns stored in the Joint Committee on Powder Diffraction Standards (JCPDS) library (Rasel Das et al., 2014). The most commonly used database for identification of crystal structures is the Joint Committee on Powder Diffraction Standards–International Center for Diffraction Data (JCPDS-ICDD) system (Rao and Biswas, 2009).
Inspection of Bragg‟s law (Equation 2.5) reveals that each unique d-spacing will diffract different wavelengths at their own unique diffraction angles (Jenkins, 2006). Thus, if a pattern were measured using an X-ray beam containing two wavelengths, the observed pattern would, in fact, be two patterns (one for each wavelength) superimposed on one another, and clearly will be more difficult to interpret than a diffractogram from a single wavelength (Jenkins, 2006). Thus, the basic purpose of the monochromatization of the X-ray radiation is to obtain an experimental pattern from a single, unique wavelength (Jenkins, 2006).
2.7.4 Particle Size Analysis
structures) (Dorofeev et al., 2012). Scherrer‟s equation was developed in 1918, to calculate the nano crystallite size by XRD radiation of wavelength λ (nm) from measuring full width at half maximum of peaks (β) in radians located at any 2θ in the pattern (Monshi et al., 2012).
From Scherrer‟s equation (2.6); the average crystallite size, D, is expressed as:
(2.6)
Where β is the peak width of the diffraction peak profile at half maximum height resulting from small crystallite size in radians, λ is the X-ray wavelength in nanometer (nm) and K is a constant related to crystallite shape, can be 0.62 - 2.08 and is usually taken as about 0.89 or 0.94 for Full Width Half Maximum (FWHM) of spherical crystals with cubic unit cells (Monshi et al., 2012; Yuvakkumar et al., 2012). The value of β in 2θ axis of diffraction profile must be in radians (Monshi et al., 2012). The θ can be in degrees or radians (Monshi et al., 2012).
2.7.5 Electron Microscopy (EM)
2.7.5.1 Introduction to Electron Microscopy
much greater detail than in those examined by light microscope (LM) which uses visible light as a source of illumination and optical (glass) lenses to magnify specimens in the range of approximately 10 to 1,000 times their original size, makes electron microscopes extremely valuable tools for the ultra-structural examination of any kind of object, but in particular for specimens of very small size (Stadtländer, 2007). At present, scanning electron microscopy is heavily used in the pursuit of better understanding of nanomaterials, because of the recent significant improvements in SEM for imaging, diffraction and analysis of elements in terms of spatial resolution and sensitivities (Suga et al., 2014).
2.7.5.2 The basic Principles of SEM
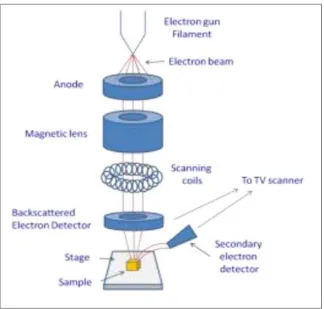
The scanning electron microscope (SEM) uses electrons to form an image. A beam of electrons is produced in an electron gun at the top of the microscope and follows a vertical path through the column of the microscope, making its way through electromagnetic lenses which focus and direct the beam down towards the sample. The beam then passes through pairs of scanning coils or pairs of deflector plates in the electron column typically, which deflect the beam in the x and y planes so that it scans over a rectangular area of the sample surface (Figure 2.12).
electrons, with energies of a few tens of electron-volts (eV), high-energy electrons backscattered from the primary beam and characteristic X-rays (Bogner et al., 2007).
Figure 2.12: Schematic diagram of a Scanning electron microscope (Cortadellas et al., 2012)
depends on the atomic number (linear for a small Z), the image obtained by using the BSE signal offers information mainly about the composition of the sample, but it can also offer information about its topography (Dinescu et al., 2013).
Figure 2.13: Interaction of electrons with an atom (Krumeick, 2011).
were generated at a small depth near the surface may escape into vacuum (Dinescu et al., 2013). That is why the image obtained by using the SE signal offers information about the structure (topography) of the surface of the sample (Dinescu et al., 2013). It should be noted that inelastically scattered electrons lead to a variety of processes like heating, radiation and electron emission (Krumeick, 2011).
Figure 2.14: Interaction of electrons with specimen/matter; induced radiation and emission (Kaech, 2013).
CHAPTER THREE MATERIALS AND METHODS 3.1 Research Design
Experimental research design was used in this study. From three rice mills in Mwea region, Kirinyaga County, Kenya, rice husks samples were purposely obtained. Laboratory procedures were followed for the extraction of silica by combustion and acid leaching. To synthesize SiNPs heat scavenger assisted magnesiothermic reduction of the silica obtained was carried out in a modified closed reactor. The synthesized SiNPs were then used to fabricate high performance Li-ion battery anodes. The extracted silica, synthesized SiNPs and the fabricated Li-Li-ion battery anodes were characterized in terms of morphology, physical and electrochemical properties by SEM, EDX, FTIR, XRD and a Biologic VMP3 multichannel Potentiostat to determine its suitability for high performance Li-ion battery anodes.
3.2 Sampling Procedure and Pretreatment
metallic ions present. The pre-treated rice husks samples were collected by filtration, washed with distilled water before being oven dried at 110 °C for 24 hours. These samples were then designated as pre-treated rice husks (PTRH).
3.3 Chemicals and Reagents
The description of the chemicals and reagents used in this study is presented in table 3.1.
Table 3.1: Descriptions of the Chemicals and Reagents Used.
Name Company Grade Concentration or Assay
Aluminium foil Aldrich Not provided Not provided
Carbon black Signa-Aldrich High purity 99.95%
Copper foil Aldrich Not provided Not provided
Ethylene Carbonate (EC) Aldrich Not provided 98%
Hydrochloric acid Loba Chemie High purity 36.5-38.0%
Lithium Cobalt Oxide (LiCoO2), Aldrich Not provided 99.8% Lithium hexafluorophosphate (LiPF6) Aldrich Not provided 99.99%
Magnesium powder Loba Chemie Not provided 99.0%
N-Methyl-2-Pyrrolidinone (NMP), Sigma-Aldrich Reagent plus 99%
Polypropylene (separator) Sigma-Aldrich Not provided Not provided Polyvinylidene Fluoride (PVDF) Aldrich Not provided Not provided
Sodium chloride Sigma-Aldrich ACS reagent 99.0%
Vinylene Carbonate (VC) Aldrich Not provided 97%
3.4 Cleaning of Apparatus
3.5 Extraction of Silica
To investigate the effect of acid pre-treatment on the silica content of rice husks ash obtained, 100.0 g samples of RRH were incinerated in a programmable muffle furnace to obtain raw rice husks ash (RRHA). The sample was incinerated with a ramp rate of 10 °Cper minute and held at 600 °C for 5 hours, left overnight to cool in the furnace and then weighed using an analytical balance (model: Shimadzu ATX224), stored in a polythene bag and designated as raw rice husks ash (RRHA). At the same time a 100.0 g sample of pre-treated rice husks (PTRH) was also incinerated in the programmable muffle furnace to obtain pre-treated rice husks ash (PTRHA). The sample was incinerated with a ramp rate of 10 °Cper minute and held at a temperature of 600 °C and for 5 hours, left overnight to cool in the furnace and then weighed using an analytical balance (model: Shimadzu ATX224), stored in a polythene bags and designated as pre-treated rice husks ash (PTRHA).
To further investigate the effect of thermal treatment on the silica content of pre-treated rice husks, samples of pre-treated rice husks were incinerated in a programmable muffle furnace to obtain pre-treated rice husks ash (PTRHA) samples. The samples was incinerated with a ramp rate of 10 °Cper minute and held at varying temperatures of 600 °C, 700 °C, 800 °C, 900 and 1000 °C and for 5 hours, left overnight to cool in the furnace and weighed using an analytical balance (model: Shimadzu ATX224), stored in polythene bags and designated as pre-treated rice husks ash (PTRHA) samples.
3.6 Synthesis of Silicon nanoparticles
Silicon nanoparticles were prepared via a modified magnesiothermic reduction reaction (Luo et al., (2013). 9.0 g of the extracted silica sample was dispersed into an aqueous solution of sodium chloride under stirring at room temperature (Silica/NaCl: 1/10 % weight). The resultant mixture was heated to 60 oC under vigorous stirring and then oven dried at 150 oC to evaporate water. The silica/NaCl powder mixture (27.5 g) and 2.5 g of Mg powder were ground in a crucible and the resultant mixture Silica/NaCl/Mg (1/10/1 % weight/weight) transferred into a stainless steel modified closed reactor (appendix vi). The Silica/NaCl/Mg mixture in the modified closed reactor was incinerated in a programmable muffle furnace with a ramp rate of 10 oC per minute for 1 hour and the temperature finally held at 650 oC for 2 hours and left overnight in the furnace to cool.
silicon nanoparticles residue obtained was washed with ethanol and oven-dried at a temperature of 60 oC for 12 hours overnight. The silicon nanoparticles obtained were weighed using an analytical balance (model: Shimadzu ATX224) after cooling to room temperature, stored in a polythene bag and designated as silicon nanoparticles (SiNPs) ready for use.
Key: RT - Room temperature, hrs - Hours Figure 3.1: Schematic diagram for the synthesis of Silicon nanoparticles.
3.7 Electrode and Cell Fabrication
electrode, Lithium Cobalt Oxide (LiCoO2) foil as a counter electrode and polypropylene soaked in an electrolyte as a separator. The electrolyte was 1.0 M Lithium hexafluorophosphate (LiPF6) in 1: 1 wt/wt Ethylene Carbonate. In order to improve cycling stability 1 % volume of vinylene carbonate was added to the Lithium hexafluorophosphate electrolyte. Cyclic voltammetry and electrochemical impedance spectroscopy measurements were done on a VMP2 Biologic multichannel potentiostat.
3.8 Physical and Chemical Measurements
3.8.1 Fourier Transform Infrared (FTIR) Spectroscopy.
The major functional groups present in the extracted silica were identified by FTIR. The potassium bromide pressed disc technique was used to prepare samples for FTIR analysis. The most convenient method to prepare samples for FTIR spectroscopic analysis was to mix the sample with potassium bromide (KBr) and place the KBr/sample mixture into a dye under pressure to form a pellet (Djomgoue and Njopwouo, 2013). Approximately 1.2 mg of the extracted silica was mixed with 100.0 mg of KBr ground, pressed and dried. The pellets formed for this experiment were prepared using a screw press. The FTIR spectra were recorded in the range 400 cm-1 to 4000 cm-1, using a Shimadzu Fourier Transform Infrared Spectrophotometer (FTIR-8400s Model) and the results presented in figure 4.3 and appendix i.
3.8.2 Energy Dispersive X-ray (EDX) Spectrometry.
EDX spectroscopy was used to determine the elemental composition of the extracted silica and the synthesized SiNPs. The samples were filled onto empty sample cups holders and placed in the appropriate slot in the Energy-dispersive X-ray (EDX) Spectrometer (Shimadzu 800HS Model) (appendix ii). Each sample was analyzed in triplicates and the results expressed as oxides presented in table 4.2, 4.3 and 4.4.
3.8.3 X-Ray Diffraction (XRD) Analysis.
samples from the labeled sample bottle were then placed to fill an empty steel sample holder where any excess powder from the sample holder edges was removed and the sample carefully placed in the appropriate XRD slot. X-ray diffraction (XRD) patterns of the samples were obtained using a philips X‟Pert (40 kV, 30 mA) X-ray diffractometer (Philips, Amsterdam, The Netherlands) (appendix iv). Scans were taken with 2θ degree and a counting time of 1.00 s using a Cu-kα radiation source (λ=1.542 Å ) and a nickel filter. The diffraction angle was scanned from 10˚ to 60˚ 2θ with a step size of 0.003. Each sample was analyzed in triplicates and the results obtained presented in figure 4.4, 4.5 and 4.12.
3.8.4 Scanning Electron Microscopy (SEM) Analysis
3.9 Electrochemical Measurements
To test the electrochemical properties, 10 coin-type cells were assembled in an argon-filled glove box. The cells were assembled by sandwiching separators (polypropylene) with the SiNPs electrodes (working electrodes) and lithium Cobalt oxide (LiCoO2) (counter electrode). The electrochemical testing of the fabricated electrode was conducted primarily by galvanostatic measurements using VMP3 Multichannel Potentiostat (Biologic) whereas cyclic voltammetry measurements was done using a multi-channel battery tester (appendix vii, Neware multi-channel battery tester, China) in the potential range of 0.01 - 2.00 V at a scan rate of 0.5 mV s-1.
3.9.1 Cyclic Voltammetry
Cyclic voltammograms of the fabricated nanostructured silicon anodes were recorded on a Biologic VMP3 electrochemistry workstation (appendix viii). Cyclic voltammetry can give important information about the nature of the electrochemical alloying reactions that occur in the electrode. The voltage cutoffs were 0.01V and 2.00 V versus Li/Li+. At certain voltages, peaks would be observed in the current response which could be attributed to specific electrochemical reactions that generate this current response. Thus, by studying the CV plot it was possible to identify the materials which alloys with lithium since different materials alloy with lithium at different electrochemical potentials. Cyclic voltammogram of the synthesized Li-ion battery anode cycled from 2.00 V to 0.01 V versus Li/Li+ at a scan rate of 0.5 mV s-1 is presented in figure 4.16.
3.9.2 Charge/Discharge Cycling Test
CHAPTER FOUR RESULTS AND DISCUSSION 4.1 Extraction of Silica.
Incineration of raw rice husks (RRH) and acid pre-treated rice husks (PTRH) samples at 600 oC for 5 hours produced 24.20 % and 24.19 % of raw rice husks ash (RRHA) and pretreated rice husks ash (PTRHA) respectively (Table 4.1).
Table 4.1: Amount of Ash obtained from Rice Husks Incinerated at 600 oC for 5 hours. Rice Husks Ash Ash content (% wt )
RRHA 24.20
PTRHA 24.19
Key: RRHA - Raw Rice Husks Ash; PTRHA - Pretreated Rice Husks Ash.
Table 4.2: Elemental analysis of RRHA, PTRHA and LRHA samples by Energy-Dispersive X-ray (EDX) spectroscopy.
Component (oxides) RRHA (% wt) PTRHA (% wt) LRHA (% wt)
SiO2 95.962 (±0.454) 98.520 (±0.457) 99.046 (±0.451)
K2O 1.231 (±0.014) b.d b.d
Na2O b.d b.d b.d
MgO b.d b.d b.d
Fe2O3 0.187 (±0.004) 0.142 (±0.004) 0.113 (±0.003)
MnO 0.297 (±0.005) b.d b.d
CaO 1.359 (±0.012) 0.217 (±0.006) 0.222 (±0.017)
Al2O3 b.d b.d b.d
ZnO 0.013 (±0.001) b.d b.d
SO3 0.943 (±0.031) 1.120 (±0.032) 0.619 (±0.028)
Rb2O 0.008 (±0.000) b.d b.d
Co2O3 b.d b.d b.d
Sc2O3 b.d b.d b.d
Cr2O3 b.d b.d b.d
Key: b.d-Below Detection Limit, RRHA-Raw Rice Husks Ash, PTRHA-Pre-Treated Rice Husks Ash, LRHA-Leached Rice Husks Ash, % wt-Percentage Weight.
pre-treated rice husks ash respectively, to obtain highly pure silica. The decreased amount of impurities mainly results from the chemical reaction between acid and metals, where the reacted metals are leached from the acidic solution during the subsequent water washing and filtration (Liou and Wu, 2010; Rafiee et al., 2012).
The colour of PTRHA and LRHA was white (Figure 4.1: (b) and (c)). This is specifically because in processes where there has been significant leaching of the alkali metal oxides, especially the oxide of potassium, the brightness and whiteness of silica obtained increases (Ugheoke and Mamat, 2012). The alkali oxides promotes the surface melting of silica, thus entrapping carbon within the silica (Ugheoke and Mamat, 2012). The more this residual carbon is entrapped, the darker the color of the silica obtained (Ugheoke and Mamat, 2012).
4.2 Effect of Incineration Temperature on the Percentage Purity of silica Obtained.
The effect of incineration temperature on the quality of rice husks ash obtained was investigated by incinerating pre-treated rice husks (PTRH) samples at temperatures of 500 °C, 600 °C, 700 °C, 800 °C, 900 °C and 1000 °C for 5 hours. The colour of pre-treated rice husks ash (PTRHA) obtained at incineration temperature of 500 °C was grey, whereas that obtained at an incineration temperature of between 600 °C to 1000 °C was white (Figure 4.2). This findings is consistent with the observation noted by Ghosh and Bhattacherjee (2013); who reported that amorphous white silica (low-carbon) ash is obtained at incineration temperatures of above 500°C. Gu et al., (2013) also reported that the temperature of incineration is the most important determinant of the whiteness and silica content of the silica obtained.
4.3 Physical and Chemical Measurements of the Extracted Silica 4.3.1 Elemental Analysis
Table 4.3: Elemental analysis by Energy-Dispersive X-ray (EDX) spectroscopy of PTRHA samples incinerated at varying temperatures for 5 hours.
Component (oxides) PTRHA-600 °C (%wt) PTRHA-700 °C (%wt) PTRHA-800 °C (%wt) PTRHA-900 °C (%wt) PTRHA-1000 °C (% wt)
SiO2 98.520 (±0.457) 98.644 (±0.441) 98.795 (±0.440) 98.563 (±0.301) 98.570 (±0.446)
K2O b.d 0.089 (±0.089) b.d 0.127 (±0.007) b.d
Na2O b.d b.d b.d b.d b.d
MgO b.d b.d b.d b.d b.d
Fe2O3 0.142 (±0.142) b.d 0.202 (±0.004) b.d 0.123 (±0.004)
MnO b.d b.d b.d b.d b.d
CaO 0.217 (±0.006) 0.295 (±0.006) 0.258 (±0.017) 0.545 (±0.008) 0.209 (±0.006)
Al2O3 b.d b.d b.d b.d b.d
ZnO b.d b.d b.d b.d b.d
SO3 1.120 (±0.032) 0.971 (±0.030) 0.746 (±0.028) 0.766 (±0.018) 1.098 (±0.033)
Rb2O b.d b.d b.d b.d b.d
Co2O3 b.d b.d b.d b.d b.d
Sc2O3 b.d b.d b.d b.d b.d
Key: b.d-Below Detection Limit, PTRHA-Pre-treated Rice Husks Ash, %wt-Percentage Weight.
4.3.2 FTIR Spectrophotometry
Figure 4.3: FTIR Spectrum of nano-silica Prepared at 1000 °C.
incineration at 600 °C, 700 °C, 800 °C and 900 °C (Appendix I); showed no noticeable changes in the position of the main peaks (470.6 cm-1, 802.3 cm-1 and 1101.3 cm-1) from this of rice husks ash obtained by incineration at 1000 °C.
4.3.3 Structural Form Determination of the Extracted Silica.
Figure 4.4: XRD diffractogram of silica prepared at 600 °C.
4.3.4 Surface Morphology of the Extracted Silica.
Scanning Electron Microscopy (SEM) was used to investigate the morphology of the silica extracted. The SEM micrographs (Figure 4.6) show microstructure images of rice husks ash obtained at temperatures of between 600 °C to 1000 °C for 5 hours under varying magnification (56.28 kX to 75.55 kX). From the SEM micrograph of silica obtained at 600 °C and 800 °C (Figure 4.6: (a) and (b)), the silica obtained has spherical nanoparticles agglomerating into homogeneous porous structure. The presence of the nano-sized spherical particles leads to a highly porous structure due to aggregation of the particles (Hariharan and Sivakumar, (2013).
To investigate the effect of different pretreatments of rice husks on the morphology of silica obtained, the morphological features of silica samples obtained from rice husks subjected to water washing (RRH) and acid pretreatment (PTRH), (Figure 4.7 (a) and (b) respectively), and incinerated at 600 °C for 5 hours, was studied. From the SEM microstructure image of PTRHA samples (Figure 4.7 (b)), the silica obtained has spherical nanoparticles agglomerating into homogeneous porous structure while in that of RRHA samples (Figure 4.7 (a)), majority of the particles have merged resulting in an almost smooth surface. This is mainly because of the effects of the metallic impurities present in the husks. The metallic impurities have a substantial effect on the quality of silica derived from rice husks, with potassium mainly causing surface melting, accelerating the crystallization of amorphous silica and resulting in carbon fixation in rice husks (RHA) (Rafiee et al., 2012).
4.4 Synthesis of Silicon Nanoparticles (SiNPs)
In an effort to transfer the original porous structure exhibited by the rice husks originated silica to the synthesized silicon nanoparticles, heat scavenger assisted magnesiothermic reduction of silica (Figure 4.9) was carried out at a temperature of 650 °C for 5 hours in a modified closed reactor (Appendix vi).
Figure 4.9: (a) Silica/NaCl Mixture (1:10 % wt), (b) Magnesium powder, (c) Silica/NaCl/Mg Mixture (1:10:1 % wt).
In this heat scavenger assisted magnesiothermic reduction process, silicon nanoparticles (Figure 4.10: (b)), were obtained through the reaction represented by equation (4.1):
Mg (g) + SiO2 (s) 2MgO(s) + Si(s) (4.1)
by acid leaching, silicon nanoparticles (Figure 4.10: (b)) were obtained. The yield of the synthesized SiNPs was 2.370 g.
Figure 4.10: (a) Si/MgO mixture; (b) Synthesized Silicon nanoparticles.
4.5 Characterization of Silicon Nanoparticles (SiNPs) obtained Rice Husks
The chemical composition, structure and morphology of the synthesized SiNPs were determined using various analytical tools. The chemical composition was analysed by Energy-Dispersive X-ray (EDX) spectroscopy. Scanning Electron Microscopy (SEM) was used to determine the morphology whereas the crystal structure was probed using X-ray diffraction (XRD).
4.5.1 Elemental Analysis by Energy-Dispersive X-ray (EDX) spectroscopy