CLINICAL ANDDIAGNOSTICLABORATORYIMMUNOLOGY, Nov. 1996, p. 654–662 Vol. 3, No. 6 1071-412X/96/$04.0010
Copyrightq1996, American Society for Microbiology
Comparative Study of Neutrophil Activation by
Chemiluminescence and Flow Cytometry
MICHAEL M. LIEBERMAN,* DORIS M. SACHANANDANI,
ANDCAROLYN A. PINNEY
Department of Clinical Investigation, Fitzsimons Army Medical Center, Aurora, Colorado 80045-5001
Received 1 April 1996/Returned for modification 14 May 1996/Accepted 28 June 1996
Neutrophil activation by phorbol 12-myristate 13-acetate (PMA) and zymosan was assessed by luminol-dependent chemiluminescence (CL) in a novel microtiter plate format and by flow cytometry (FC) based on the oxidation of dihydrorhodamine 123. The results of this comparison demonstrated striking differences in kinetic parameters between these two techniques for neutrophil activation by PMA and zymosan. PMA activation, as determined by FC, was found to be an all-or-none phenomenon in that below a critical concentration of PMA, few cells were positive. Above this concentration, almost all cells were positive; however, the fluorescence intensity of positive cells increased with an increasing PMA concentration until a plateau (maximal) level was reached. In contrast, increasing zymosan concentrations resulted in proportionate increases in the percentage of positive cells until close to 100% of cells were positive. However, the fluorescence intensity of positive cells remained about the same. CL activity increased proportionately with either PMA or zymosan concentration until a maximal level was achieved. The concentration of PMA required for half-maximal activity was about 10-fold higher for FC than for CL, whereas the analogous concentration of zymosan was about 30-fold higher for CL than for FC. In addition, opsonization had only a small negative effect on the ability of zymosan to activate neutrophils, as determined by FC, whereas it had a very large enhancing effect when determined by CL. The differences in kinetic parameters of activation suggest differential sensitivity to particulate (zymosan) versus soluble (PMA) stimulants for FC and CL.
Chemiluminescence (CL) is a natural product of metabolic oxygenation activity and thus can be used to monitor the acti-vation of neutrophils (2, 4–6). The light emission is due to the generation of photons from the relaxation of electronically excited substrate molecules after oxidation by reactive oxygen species (ROS), i.e., superoxide anion, hydrogen peroxide, hy-droxyl radical, and singlet molecular oxygen (2, 16). These ROS are generated upon activation of the NADPH oxidase complex associated with the membranes of polymorphonuclear and mononuclear phagocytes (9, 16). A wide variety of stimuli, including both soluble molecules and particles (15, 16), can activate NADPH oxidase, although by different mechanisms (see Discussion below). The sensitivity of native CL can be great-ly enhanced by use of the chemiluminogenic probe luminol (5-amino-2,3-dihydro-1,4-phthalazinedione), because luminol di-oxygenation results in a much higher quantum yield of photons (the number of photons produced per oxygenation event) than does oxygenation of native substrates (1, 2, 4). The neutrophil oxidative burst has been related to bactericidal activity (8, 19, 20), although a good correlation between luminol-dependent CL and intracellular killing of bacteria appears to require or-ganism-specific antiserum (20). Indeed, CL has been used to determine the humoral requirements for opsonophagocytosis of microorganisms (17) and to quantify the opsonic capacity of microbe-specific antiserum (3, 14).
Recently, flow cytometric (FC) techniques have been devel-oped to evaluate neutrophil function, particularly in regard to the diagnosis of chronic granulomatous disease (7, 10–13). These methods involve the uptake of dyes by neutrophils fol-lowed by activation. Upon activation, nonfluorescent dyes are
oxidized to fluorescent compounds by the H2O2generated by
activated NADPH oxidase. O’Gorman and Corrochano (18) reported a rapid, whole-blood assay based on the intracellular oxidation of the nonfluorescent compound dihydrorhodamine 123 (DHR 123) to its fluorescent derivative, rhodamine 123, in activated neutrophils. This assay is particularly well suited for use in a clinical FC laboratory.
Here a comparative study of CL and FC methods for the evaluation of neutrophil activation is reported. The CL assay employs a novel microtiter plate format which is considerably more convenient than previous methodologies for rapidly as-saying multiple samples.
MATERIALS AND METHODS
Chemicals.Luminol, phorbol 12-myristate 13-acetate (PMA), zymosan A, and dimethyl sulfoxide were obtained from Sigma Chemical Co., St. Louis, Mo. DHR 123 was obtained from Molecular Probes, Inc., Eugene, Oreg. Stock solutions of luminol (5 mM), PMA (1 mg/ml), and DHR 123 (5 mg/ml) were prepared in dimethyl sulfoxide and stored at220 or2708C (DHR 123) with protection from light. Zymosan was suspended at a concentration of 50 mg/ml in phosphate-buffered saline (PBS), boiled for 30 min with periodic mixing, centrifuged, washed three times in PBS, and resuspended in PBS at 50 mg/ml. Aliquots were stored at2708C. For opsonization, boiled zymosan was diluted 1:10 in normal serum and incubated for 30 min at 378C. Then the material was centrifuged, washed in PBS, and resuspended at the original concentration in PBS.
Neutrophils.For CL assays, neutrophils were prepared from heparinized whole-blood samples by ammonium chloride lysis. One volume of blood was added to 15 volumes of lysis solution (0.15 M NH4Cl, 10 mM KHCO3, 0.1 mM EDTA, pH 7.3), mixed, and incubated at room temperature for 10 min. The lysed blood was centrifuged (2003gfor 10 min), and the pelleted cells were washed twice in PBS and resuspended in Veronal buffer (5 mM diethylbarbi-tal, 145 mM NaCl, 0.5 mM MgCl2, 0.15 mM CaCl2, 0.1% bovine serum albu-min [BSA], 0.1% glucose, pH 7.2) at a concentration of 2.53105neutrophils per ml.
CL assay.The CL assay was performed in a microtiter plate format with a Packard TopCount microplate scintillation and luminescence counter (Packard Instrument Co., Meriden, Conn.). Prior to the assay, the instrument was nor-malized and programmed in the single-photon-counting mode, and the particular wells on the plate to be used were defined in the program. Working solutions of
* Corresponding author. Present address: 1052 Ala Nanu #304, Honolulu, HI 96818. Phone: (808) 833-9472.
654
on August 17, 2020 by guest
http://cvi.asm.org/
luminol (10mg/ml) and PMA (20mg/ml or lower, depending on the experiment) were prepared by dilution of stock solutions in Veronal buffer. The stock sus-pension of zymosan was also diluted in Veronal buffer as appropriate to the experiment. One hundred microliters of cell suspension (containing 2.53104 neutrophils), 10ml of 10mM luminol (final concentration, 0.5 mM), various volumes of PMA or zymosan, and Veronal buffer to yield a final volume of 200 ml were added to wells of a 96-well black microtiter plate (Packard Liteplate-96). The PMA or zymosan was added last. The plate was sealed with an adhesive cover strip (Packard Topseal A), wiped with a damp Kimwipe (to remove static charges), and placed in the TopCount, and the run was initiated. The instrument was programmed with a 5-min counting delay (dark adaptation), a 1-min count per well, and 10 counting cycles. The instrument was controlled at room tem-perature, and the plate was not shaken during the run except for automatic movement of the plate between counting cycles.
FC.The method described by O’Gorman and Corrochano (18) was employed with only slight modifications, the use of the Coulter Immuno-lyse system (Coulter Corp., Hialeah, Fla.) and a wash solution containing 0.1% BSA instead of fetal bovine serum. Working solutions of DHR 123 (100mg/ml) and PMA (various concentrations) and working suspensions of zymosan (various concen-trations) were prepared by dilution in PBS from the appropriate stocks. FC was performed with an Epics Profile I flow cytometer (Coulter Corp.). The granu-locyte population was gated by light scatter (forward angle versus orthogonal), and fluorescent events in the “green” channel (normally used for the detection of fluorescein isothiocyanate fluorescence) were collected in single-parameter histograms on a logarithmic scale. Positive regions were set on the basis of the observed fluorescence from unstimulated cells (with DHR 123) as the negative region.
Study subjects.Healthy human subjects were recruited from among laboratory personnel. Aliquots of heparinized blood were taken from the same tube for both CL and FC, and both assays were performed at the same time (within 8 h of when the blood was drawn).
RESULTS
Neutrophil activation by PMA as determined by CL.Figure 1 depicts the kinetics of CL activity in a typical experiment with various concentrations of PMA. Peak activity increased (while
time to achieve peak activity decreased) with an increasing PMA concentration until a plateau in this peak activity was reached. There was no detectable activity in the absence of either PMA, luminol, or neutrophils.
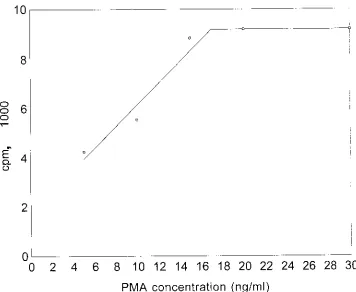
The maximum CL activity achieved as a function of PMA concentration is plotted in Fig. 2. The concentration of PMA yielding half-maximal CL activity can be readily interpolated from this curve. The range of these values for a group of healthy individuals is given in Table 1.
PMA activation of neutrophils as determined by FC.The results of DHR 123 FC of PMA-activated neutrophils are shown in Fig. 3. There were very few positive cells until a critical concentration of PMA was used; above this concentra-tion, almost all cells became positive. In this experiment (Fig. 3), this value fell between 20 and 50 ng/ml, at which concen-trations 18 and 83% of cells were positive, respectively. How-ever, the mean channel of fluorescence intensity increased with increasing PMA concentrations (beyond this critical value) until a plateau level was reached. This relationship is demon-strated in Fig. 4, from which the concentration of PMA yield-ing the half-maximal mean channel can be obtained (Table 1).
Neutrophil activation by zymosan as determined by CL.
Analogous experiments were conducted with zymosan, either opsonized or unopsonized. The results of a representative ex-periment are shown in Fig. 5 and indicate that the CL response observed also increased with an increasing zymosan concen-tration as it did with PMA, although the peak activities achieved were considerably lower, especially for unopsonized zymosan (Fig. 5A). The time required to reach maximal activ-ity is much shorter with opsonized zymosan than with
unopso-FIG. 1. CL response of neutrophils as determined in the TopCount microplate scintillation system. The assay was performed as described in Materials and Methods. The counts per minute were plotted as a function of time. Neutrophils were stimulated with PMA at 30 (h), 20 (1), 15 (p), 10 (■), and 5 (3) ng/ml in the presence of luminol.}, unstimulated neutrophils with luminol present (also representative of PMA-stimulated neutrophils in the absence of luminol, as well as PMA and luminol in the absence of neutrophils).
VOL. 3, 1996 CL AND FC FOR CELL ACTIVATION 655
on August 17, 2020 by guest
http://cvi.asm.org/
nized zymosan. Plotting the peak activities obtained versus zymosan concentration (Fig. 6) also yielded half-maximal stim-ulant concentrations (Table 1). These values were considerably lower for opsonized zymosan than for unopsonized zymosan (Table 1).
Zymosan activation of neutrophils as determined by FC.
The results of FC determination of zymosan activation of neu-trophils are presented in Fig. 7. The percentage of positive cells increased with increasing zymosan concentrations, but the mean channel of positive cells did not increase significant-ly. The relationship of positive cells to zymosan concentra-tion (opsonized or unopsonized) is described in Fig. 8, from which the zymosan concentration yielding 50% positive cells can be obtained (Table 1). As can be seen in Fig. 8, only a
small difference between opsonized and unopsonized zymosan was evident, with opsonized zymosan being slightly less effec-tive.
DISCUSSION
The experiments described above demonstrate that both CL and FC can be used to evaluate neutrophil function. These methods have certain advantages and disadvantages with re-spect to each other. FC can interrogate individual cells for activation properties, or specific subpopulations of cells among a mixture of cell types can be gated for analysis. However, CL can measure only total cell populations. CL has been used successfully to study aspects of immunity to microorganisms other than neutrophil function, such as the determination of the humoral requirements for opsonophagocytosis of bacteria (17) and the quantification of the opsonic capacity of microbe-specific antiserum (3, 14), whereas no such demonstration has yet been reported for FC. The microplate scintillation method described here allows CL assays to be performed conveniently and rapidly.
Interestingly, our data show that PMA-stimulated neutro-phil activation as determined by FC appears to be an all-or-none phenomonen (Fig. 3), while zymosan-stimulated neutro-phil activation is not (Fig. 7). This point was not previously apparent for this method (18) but would appear to be logical given that the particulate nature of zymosan would necessitate physical contact with the neutrophil for cell activation. On the other hand, PMA in solution would be uniformly available to all cells at any given time. However, only after a critical con-centration was reached would the cell become activated. Bass et al. (7) reported a graded rather than all-or-none response to
FIG. 2. CL response of neutrophils plotted as a function of PMA concentration. The maximal CL response was about 9,200 cpm. The concentration of PMA yielding the half-maximal response (4,600 cpm) was about 6.5 ng/ml.
TABLE 1. Kinetic parameters of PMA activation and zymosan activation of neutrophils as determined by CL and FC
Method of analysis
Activation bya :
PMA
Zymosan
Unopsonized Opsonized
CL 13b(2–30) 570 (180–1,250) 94c(16–200)
FC 112 (50–220) 16 (8–32) 29d(24–38)
aData are mean concentrations of PMA (in nanograms per milliliter) or
zymosan (in micrograms per milliliter) yielding the half-maximal CL or FC response (50% positive cells for FC with zymosan).n510 unless otherwise indicated. The ranges of values are given in parentheses.
bn59 because one outlier value (400 ng/ml) was not included in the
calcu-lation of the mean. cn54. dn53.
656 LIEBERMAN ET AL. CLIN. DIAGN. LAB. IMMUNOL.
on August 17, 2020 by guest
http://cvi.asm.org/
FIG. 3. FC of PMA-activated neutrophils. (A) 10 ng/ml; (B) 20 ng/ml; (C) 50 ng/ml; (D) 100 ng/ml; (E) 200 ng/ml; (F) 500 ng/ml.
FIG. 4. Fluorescence intensity mean channel of PMA-activated neutrophils plotted as a function of PMA concentration. The concentration of PMA yielding the half-maximal mean channel (in positive cells) was about 135 ng/ml in this case.
VOL. 3, 1996 CL AND FC FOR CELL ACTIVATION 657
on August 17, 2020 by guest
http://cvi.asm.org/
FIG. 5. CL response of neutrophils stimulated with zymosan at 4 (h), 2 (1), and 1 (p) mg/ml. (A) Unopsonized zymosan; (B) opsonized zymosan.
658 LIEBERMAN ET AL. CLIN. DIAGN. LAB. IMMUNOL.
on August 17, 2020 by guest
http://cvi.asm.org/
PMA stimulation of neutrophils by an FC assay based on the oxidation of dichlorofluorescin diacetate to a fluorescent de-rivative dichlorofluorescein (DCF). This interpretation of the results was made because they observed a gradual increase in
the concentration of DCF per activated neutrophil with in-creasing PMA concentrations. However, only a single popula-tion of cells was observed to respond and the number of cells in the population did not appear to change with increasing
FIG. 6. CL response of neutrophils plotted as a function of zymosan concentration. The maximal CL response was about 3,200 cpm for unopsonized zymosan (A) and 8,800 cpm for opsonized zymosan (B). The concentration of zymosan yielding the half-maximal response was about 1 mg/ml for unopsonized zymosan and 60mg/ml for opsonized zymosan in this experiment.
VOL. 3, 1996 CL AND FC FOR CELL ACTIVATION 659
on August 17, 2020 by guest
http://cvi.asm.org/
PMA concentrations. Thus, if the concentration of DCF per cell is considered analogous to the mean channel fluorescence (fluorescence intensity) in the DHR 123 assay used here, then the results described above are consistent with those of Bass et al. (7) in that the number of positive cells did not change gradually but precipitously at a particular PMA concentration. Once the threshold concentration of PMA was achieved, there was no further increase in the number of responding cells; rather, the level of response for each cell was elevated.
Curiously, the concentration of PMA yielding the half-max-imal response was almost 10-fold lower for CL than for FC while the concentration of (unopsonized) zymosan yielding the half-maximal response was about 30- to 40-fold higher for CL than for FC (Table 1). This inverted relationship may suggest that the mechanisms involved in the intracellular oxidation of DHR 123 and luminol-dependent CL are differentially sensi-tive to activation via particulate (membrane-contact-depen-dent) stimulants compared with soluble stimulants which di-rectly activate intracellular oxidative mechanisms. This might be related to our finding that zymosan activation of neutrophils as determined by FC was insensitive to opsonization (Fig. 8), whereas activation as determined by CL was acutely sensitive to opsonization (Fig. 5). Zymosan, whether opsonized or not, stimulates neutrophils via their surface complement receptor 3 (CR3) (15, 16); however, the ligand for CR3 is different in these two cases. For opsonized zymosan, the primary ligand is inactivated complement component 3b, whereas for unopso-nized zymosan, the ligand for CR3 appears to be a glucan polysaccharide moiety on the surface of the zymosan particle (16). One possible explanation for the observations regarding
the apparent differential sensitivities described above involves the interaction of the NADPH oxidase system and arachidonic acid metabolism. It has been reported (9, 16) that arachidonic acid oxidative metabolism via cyclooxygenase and/or lipoxy-genase is required for the production of CL and that the activation of NADPH oxidase is necessary but not sufficient for this reaction (16). Thus, one may postulate that neutrophil stimulation by PMA, which binds directly to (intracellular) protein kinase C (15), results in more efficient activation of arachidonic acid metabolism than does stimulation by zymo-san, thereby yielding greater CL production. Opsonization of zymosan would increase the number of ligands for CR3, i.e., zymosan-bound inactivated complement component 3b in ad-dition to glucan moieties. Hence, stimulation by opsonized zymosan might also yield an upregulation of arachidonic acid oxidation, again resulting in greater CL activity compared with stimulation by unopsonized zymosan. In contrast, if oxidation of DHR 123 is largely dependent only on the
myeloperoxidase-H2O2-halide system (2, 16), then activation of NADPH oxidase
alone could result in the observed FC activity. In this case, there would be no increased oxidation of DHR 123 because of enhanced activation of arachidonic acid metabolism by PMA stimulation compared with zymosan stimulation or by opso-nized-zymosan stimulation relative to unopsoopso-nized-zymosan stimulation. This may explain the apparent differential sensi-tivities to PMA and zymosan for neutrophil activation as de-termined by CL and FC, as well as the difference in the effect of opsonization of zymosan on neutrophil activation observed by these two methods.
An additional explanation may be that stimulation of
neu-FIG. 7. FC of zymosan-activated neutrophils. (A) Unstimulated (DHR present); (B through F) stimulated with 4, 8, 20, 40, and 80mg/ml, respectively. Data for unopsonized zymosan are shown, but the results for opsonized zymosan were very similar (see Fig. 8).
660 LIEBERMAN ET AL. CLIN. DIAGN. LAB. IMMUNOL.
on August 17, 2020 by guest
http://cvi.asm.org/
trophils by different means results in the generation of different concentrations or mixtures of ROS. For example, activation of neutrophils by PMA may yield higher concentrations of super-oxide anion than does activation by zymosan. If luminol oxi-dation by superoxide is more effective than oxioxi-dation by other ROS, then stimulation by PMA should be expected to yield higher CL activity than does stimulation by zymosan. However, if PMA stimulation and zymosan stimulation generate about
the same levels of H2O2(or PMA stimulation yields less H2O2
than does zymosan stimulation) and this ROS is the primary oxidant for DHR 123, then the apparent differential sensitivi-ties observed might also be expected. One may also postulate that binding of the two different ligands for CR3 generates different signals so that NADPH oxidase activated by inacti-vated complement component 3b results in higher concentra-tions of superoxide than does NADPH oxidase activated by glucan binding. This would again result in increased CL, as measured by luminol oxidation. However, if the signals gener-ated upon binding of CR3 by either of its ligands yield the same levels of hydrogen peroxide, then no difference in the activation of neutrophils as determined by FC would be evi-dent if DHR 123 oxidation was primarily depenevi-dent on this oxidant.
It would be of interest to compare activation of polymor-phonuclear leukocytes by CL and FC using live bacteria to determine which method correlates better with the bactericidal activity of neutrophils. Neutrophil activation by live bacteria can be easily demonstrated by CL (data not shown). This comparison might be useful in evaluating FC and CL for clin-ical testing purposes.
REFERENCES
1.Allen, R. C.1977. Evaluation of serum opsonic capacity by quantitating the initial chemiluminescent response from phagocytizing polymorphonuclear
leukocytes. Infect. Immun.15:828–833.
2.Allen, R. C.1982. Biochemiexcitation: chemiluminescence and the study of biological oxygenation reactions, p. 309–344.InW. Adam and G. Cilento (ed.), Chemical and biological generation of excited states. Academic Press, Inc., New York.
3.Allen, R. C., and M. M. Lieberman.1984. Kinetic analysis of microbe-specific opsonification based on stimulated polymorphonuclear leukocyte oxygen-ation activity. Infect. Immun.45:475–482.
4.Allen, R. C., and L. D. Loose.1976. Phagocytic activation of a luminol-dependent chemiluminescence in rabbit alveolar and peritoneal macro-phages. Biochem. Biophys. Res. Commun.69:245–252.
5.Allen, R. C., M. E. Mead, and J. L. Kelly.1985. Phagocyte oxygenation activity measured by chemiluminescence and chemiluminescence probing, p. 343–351.InR. A. Greenwald (ed.), CRC handbook of methods for oxygen radical research. CRC Press, Boca Raton, Fla.
6.Allen, R. C., R. L. Stjernholm, and R. H. Steele.1972. Evidence for the generation of (an) electronic excitation state(s) in human polymorphonu-clear leukocytes and its participation in bactericidal activity. Biochem. Bio-phys. Res. Commun.47:679–684.
7.Bass, D. A., P. Wallace, L. R. Dechatelet, P. Szejda, M. C. Seeds, and M. Thomas.1983. Flow cytometric studies of oxidative product formation by neutrophils: a grade response to membrane stimulation. J. Immunol.130:
1910–1917.
8.Brar, D. W., E. C. Borden, and R. A. Proctor.1993. Recombinant interferon-gamma preserves human granulocyte bactericidal and chemiluminescent ac-tivities. J. Infect. Dis.168:128–134.
9.Cheung, K., A. C. Archibald, and M. F. Robinson.1983. The origin of chemiluminescence produced by neutrophils stimulated by opsonized zymo-san. J. Immunol.130:2324–2329.
10. Emmendorffer, A., M. Hecht, M. L. Lohmann-Matthes, and J. Roesler.1990. A fast and easy method to determine the production of reactive oxygen intermediates by human and murine phagocytes using dihydrorhodamine 123. J. Immunol. Methods131:269–275.
11. Emmendorffer, A., M. Nakamura, G. Rothe, K. Spiekermann, M. L. Loh-mann-Matthes, and J. Roesler.1994. Evaluation of flow cytometric methods for the diagnosis of chronic granulomatous disease variants under routine laboratory conditions. Cytometry18:147–155.
12. Epling, C. L., D. P. Stites, T. M. Mchugh, H. O. Chong, L. L. Blackwood, and D. W. Wara.1992. Neutrophil function screening in patients with chronic granulomatous disease by a flow cytometric method. Cytometry13:615–620. 13. Himmelfarb, J., R. M. Hakin, D. G. Holbrook, D. A. Leeber, and K. A. Ault.
FIG. 8. Percent DHR-positive cells in zymosan-activated neutrophils plotted as a function of zymosan concentration. The concentrations of zymosan yielding 50% positive cells were 19 (unopsonized) and 24 (opsonized)mg/ml in this experiment.
VOL. 3, 1996 CL AND FC FOR CELL ACTIVATION 661
on August 17, 2020 by guest
http://cvi.asm.org/
1992. Detection of granulocyte reactive oxygen species formation in whole blood using flow cytometry. Cytometry13:83–89.
14. Lieberman, M. M., and R. C. Allen.1986. Opsonic activity of antisera to ribosomal vaccine fractions with live and formalinized Pseudomonas aerugi-nosa. Can. J. Microbiol.32:531–533.
15. Lindena, J., and H. Burkhardt.1990. Chemiluminescence properties of human, canine, and rat polymorphonuclear cells. J. Biolumin. Chemilumin.
5:165–170.
16. Lindena, J., H. Burkhardt, and A. Dwenger.1987. Mechanisms of non-opsonized zymosan-induced and luminol-enhanced chemiluminescence in whole blood and isolated phagocytes. J. Clin. Chem. Clin. Biochem.25:765– 778.
17. Madonna, G. S., and R. C. Allen.1981.Shigella sonneiphase I and phase II:
susceptibility to direct serum lysis and opsonic requirements necessary for stimulation of leukocyte redox metabolism and killing. Infect. Immun.32:
153–159.
18. O’Gorman, M. R. G., and V. Corrochano.1995. Rapid whole-blood flow cytometry assay for diagnosis of chronic granulomatous disease. Clin. Diagn. Lab. Immunol.2:227–232.
19. Quie, P. G., and J. Heron.1992. Neutrophil assessment: bactericidal assay and chemiluminescence, p. 419–420.InN. R. Rose, E. C. de Macario, J. L. Fahey, H. Friedman, and G. M. Penn (ed.), Manual of clinical laboratory immunology, 4th ed. American Society for Microbiology, Washington, D.C. 20. Welch, W. D.1980. Correlation between measurements of the luminol-dependent chemiluminescence response and bacterial susceptibility to phagocytosis. Infect. Immun.30:370–374.
662 LIEBERMAN ET AL. CLIN. DIAGN. LAB. IMMUNOL.