Western University Western University
Scholarship@Western
Scholarship@Western
Electronic Thesis and Dissertation Repository
4-23-2019 10:00 AM
Towards on-line plan adaptation of unified intensity-modulated
Towards on-line plan adaptation of unified intensity-modulated
arc therapy using a fast-direct aperture optimization algorithm
arc therapy using a fast-direct aperture optimization algorithm
Michael MacFarlane
The University of Western Ontario Supervisor
Chen, Jeff Z.
The University of Western Ontario Joint Supervisor Battista, Jerry J.
The University of Western Ontario
Graduate Program in Medical Biophysics
A thesis submitted in partial fulfillment of the requirements for the degree in Doctor of Philosophy
© Michael MacFarlane 2019
Follow this and additional works at: https://ir.lib.uwo.ca/etd
Part of the Medical Biophysics Commons
Recommended Citation Recommended Citation
MacFarlane, Michael, "Towards on-line plan adaptation of unified intensity-modulated arc therapy using a fast-direct aperture optimization algorithm" (2019). Electronic Thesis and Dissertation Repository. 6142.
https://ir.lib.uwo.ca/etd/6142
This Dissertation/Thesis is brought to you for free and open access by Scholarship@Western. It has been accepted for inclusion in Electronic Thesis and Dissertation Repository by an authorized administrator of
ii
Abstract
External beam radiotherapy (EBRT) plays a vital role in the treatment of cancer, with
close to half of all cancer patients receiving EBRT at some point over their course of
treatment. Although EBRT is a well-established form of treatment, there are a number of
ways in which EBRT could still be improved in terms of quality and efficiency for
treatment planning and radiation dose delivery. This thesis reports a series of
improvements made to EBRT.
First, we developed and evaluated a new treatment planning technique called unified
intensity-modulated arc therapy (UIMAT) which combines the optimization and delivery
of rotational volumetric modulated arc therapy (VMAT) and fixed-gantry
intensity-modulated radiation therapy (IMRT). When retrospectively compared to clinical
treatment plans using VMAT or IMRT alone, UIMAT plans reduced the dose to nearby
critical structures by as much as 23% without compromising tumour volume coverage.
The UIMAT plans were also more efficient to deliver. The reduction in normal tissue
dose could help lower the probability of treatment-related toxicities, or alternatively
could be used to improve tumour control probability, via dose escalation, while
maintaining current dose limits for organs at risk.
Second, we developed a new fast inverse direct aperture optimization (FIDAO) algorithm
for IMRT, VMAT, and UIMAT treatment planning. FIDAO introduces modifications to
the direct aperture optimization (DAO) process that help improve its computational
efficiency. As demonstrated in several test cases, these modifications do not significantly
impact the plan quality but reduced the DAO time by as much as 200-fold. If
implemented with graphical processing units (GPUs), this project may allow for
applications such as on-line treatment adaptation.
Third, we investigated a method of acquiring tissue density information from cone-beam
computed tomography (CBCT) datasets for on-line dose calculations, plan assessment,
iii
patient-specific scattering conditions, demonstrated high dosimetric accuracy, and can be
easily automated for on-line plan assessment.
Collectively, these three projects will help reduce the normal tissue doses from EBRT,
improve the planning and delivery efficiency, and pave the way for application like
on-line plan assessment and adaptive radiotherapy in response to anatomical changes.
Keywords:
External Beam Radiotherapy;
Direct Aperture Optimization;
Intensity Modulated Radiation Therapy;
Volumetric Modulated Arc Therapy;
Cone Beam Computed Tomography;
iv
Co-Authorship Statement
Chapter 2 was adapted from the published article entitled “Evaluation of unified
intensity-modulated arc therapy for the radiotherapy of head-and-neck cancer” by
Michael MacFarlane, Douglas A. Hoover, Eugene Wong, Nancy Read, David Palma,
Varagur Venkatesan, Alex Hammond, Jerry J. Battista, and Jeff Z. Chen, Radiotherapy
and Oncology, 119 (2): 331-336 (2016). Michael MacFarlane developed the planning
algorithm, performed the retrospective planning study, performed the statistical analysis,
and wrote the manuscript. Douglas Hoover, Eugene Wong, Jerry Battista, and Jeff Chen
provided input on the planning study design and helped edit the manuscript. Nancy Read,
David Palma, Varagur Venkatesan, and Alex Hammond provided the patient datasets and
helped edit the manuscript.
Chapter 3 was adapted from the published article entitled “A fast inverse direct aperture
optimization algorithm for intensity-modulated radiation therapy” by Michael
MacFarlane, Douglas Hoover, Eugene Wong, Pedro Goldman, Jerry J. Battista, and Jeff
Z. Chen, Medical Physics, 46 (3): 1127-1139 (2019). Michael MacFarlane developed the
algorithms, performed the planning study, and wrote the manuscript. Douglas Hoover,
Eugene Wong, Pedro Goldman, Jerry Battista, and Jeff Chen provided input on the
algorithm and the study design and helped edited the manuscript.
Chapter 4 was adapted from an unpublished technical note entitled “A fast inverse direct
aperture optimization algorithm for volume modulated arc therapy” by Michael
MacFarlane, Douglas Hoover, Eugene Wong, Jerry J. Battista, and Jeff Z. Chen. Michael
MacFarlane developed the algorithms, performed the planning study, and wrote the
manuscript. Douglas Hoover, Eugene Wong, Jerry Battista, and Jeff Chen provided input
on the algorithm and the study design and helped edited the manuscript.
Chapter 5 was adapted from the published article entitled “Patient-specific calibration of
cone-beam computed tomography data sets for radiotherapy dose calculations and
treatment plan assessment” by Michael MacFarlane, Daniel Wong, Douglas A. Hoover,
v
Clinical Medical Physics, 19 (2): 249-257 (2018). Michael MacFarlane developed the
calibration algorithm, lead the evaluation study, performed the statistical analysis, and
wrote the manuscript. Daniel Wong and Carol Johnson assisted in performing the
retrospective planning study and editing the manuscript. Douglas Hoover, Eugene Wong,
Jerry Battista, and Jeff Chen provided input on the algorithm and the study design and
helped edit the manuscript.
Appendix A was adapted from the published article entitled “Feasibility of a unified
approach to intensity-modulated radiation therapy and volume-modulated arc therapy
optimization and delivery” by Douglas Hoover, Michael MacFarlane, Eugene Wong,
Jerry J. Battista, and Jeff Z. Chen, Medical Physics, 42 (2): 726-734 (2015). Michael
MacFarlane developed the planning algorithm, performed the retrospective planning
study, and helped edit the manuscript. Since the thesis authors contribution to this paper
was completed prior to entering the PhD program, the article is included as an Appendix
to the thesis. Douglas Hoover provided input on the algorithm, performed the statistical
analysis, and wrote the manuscript. Eugene Wong, Jerry Battista, and Jeff Chen provided
vi
Dedication
vii
Acknowledgments
I would like to first and foremost thank my supervisors, Drs. Jeff Z. Chen and Jerry J.
Battista. I am eternally grateful for the support and guidance that they have provided me
over these years, and for having the confidence in me to pursue a medical physics career.
I also would like to extend my gratitude to my advisory committee members, Drs.
Michael Lock, Douglas Hoover, and Eugene Wong, for all their valuable time, thoughtful
suggestion and clinical feedback on my work.
A sincere thank you to all of my collaborators over the years: Carol Johnson, Karl
Bzdusek (of Philips Radiation Oncology group), Daniel Wong, Dr. Pedro Goldman
(Ryerson University), Dr. Nancy Read, Dr. David Palma, Dr. Varagur Venkatesan, and
Dr. Alex Hammond. Many of these projects would not have been possible if it weren’t
for their contribution.
I would like to extend my deepest gratitude to all the members in the Department of
Physics and Engineering at the London Regional Cancer Program; as well as the staff,
administrators and teachers in the Department of Medical Biophysics at the University of
Western Ontario. I would like to particularly thank the CAMPEP director, Dr. Rob
Stodilka, who has been a great mentor. I would also like to acknowledge the various
sources of funding that have helped support this research and my graduate studies. This
includes the London Regional Cancer Program; the London Health Research Institute
(LHRI), Phillips Healthcare, and the Government of Ontario who provided funding
through the Ontario Research fund (OCAIRO Project); and the Canadian Institutes for
Health Research (CIHR).
Last of all, I would like to thank all my friends – both near and far – who have made
these last few years special. In particular, Kevin Pichler, who has long been an inspiration
to me and who is deeply missed. Finally, thank you to my parents, Mary and Jim; to my
sisters, Katherine, Sarah, and Heather, and their wonderful families; and to my partner,
viii
Table of Contents
Abstract ... ii
Co-Authorship Statement... iv
Dedication ... vi
Acknowledgments... vii
Table of Contents ... viii
List of Tables ... xiii
List of Figures ... xvi
List of Appendices ... xxii
List of Units and Abbreviations (in order of use) ... xxiii
List of Symbols ... xxv
Chapter 1 – Introduction ... 1
1.1 Cancer statistics ... 1
1.2 Radiation Therapy Overview ... 1
1.3 EBRT Treatment Process ... 4
1.3.1 Image Acquisition ... 4
1.3.2 Contouring and Prescription ... 5
1.3.3 Beam Selection ... 6
1.3.4 Plan Optimization ... 8
1.3.5 Plan Evaluation ... 12
1.3.6 Quality Assurance ... 14
1.3.7 Plan delivery ... 15
1.4 Research Motivation ... 15
1.5 Research Hypothesis ... 17
ix
1.7 References ... 19
Chapter 2 – Evaluation of unified intensity-modulated arc therapy (UIMAT) for the radiotherapy of head-and-neck cancer ... 24
2.1 Introduction ... 24
2.2 Methods and materials ... 25
2.3 Results ... 28
2.4 Discussion ... 33
2.5 Conclusion ... 35
2.6 Acknowledgement ... 35
2.7 References ... 35
Chapter 3 – A fast inverse direct aperture optimization algorithm for intensity-modulated radiation therapy ... 38
3.1 Introduction ... 38
3.2 Materials and Methods ... 39
3.2.1 Introduction to FIDO ... 39
3.2.2 FIDAO Formulation... 41
3.2.3 Dose-volume objectives ... 47
3.2.4 Implementation & testing of the prototype algorithm ... 48
3.3 Results ... 51
3.4 Discussion ... 57
3.5 Conclusions ... 60
3.6 Appendix ... 61
3.7 Acknowledgements ... 64
3.8 Disclosure ... 64
x
Chapter 4 – A fast inverse direct aperture optimization algorithm for volumetric
modulated arc therapy ... 67
4.1 Introduction ... 67
4.2 Methods and Materials ... 68
4.3 Results ... 70
4.4 Discussion ... 73
4.5 Conclusion ... 75
4.6 References ... 75
Chapter 5 – Patient-specific calibration of cone-beam computed tomography images for dose tracking and treatment plan assessment ... 78
5.1 Introduction ... 78
5.2 Materials and Methods ... 80
5.2.1 Patient Selection... 80
5.2.2 Imaging ... 80
5.2.3 Creation of calibrated CBCT image sets ... 81
5.2.4 Patient-specific calibration (PSC) Method ... 82
5.2.5 Voxel-to-voxel DIR method ... 84
5.2.6 Density-override method ... 84
5.2.7 Gold standard (reCT) for dose evaluation ... 84
5.2.8 Contouring and dose metrics ... 86
5.2.9 Gamma analysis ... 86
5.2.10 Statistical Analysis ... 86
5.2.11 Phantom Study ... 87
5.3 Results ... 88
5.4 Discussion ... 91
xi
5.6 Reference ... 94
Chapter 6 – Summary & Future Work ... 98
6.1 Contributions and Findings ... 98
6.2 Limitations and Future Work ... 100
6.2.1 UIMAT ... 101
6.2.2 FIDAO ... 105
6.2.3 PSC ... 108
6.2.4 Summary ... 108
6.3 References ... 109
Appendix A – Feasibility of a unified approach to intensity-modulated radiation therapy and volumetric modulated arc therapy optimization and delivery ... 112
A.1 Introduction ... 112
A.2 Material and Methods ... 114
A.3 Results ... 120
A.4 Discussion ... 128
A.5 Conclusion ... 130
A.6 Acknowledgements ... 130
A.7 Reference ... 130
Appendix B – Permission to Reproduce Content ... 133
B.1 Permission to reuse figure from Bzdusek et al. in Figure 1.2 ... 133
B.2 Permission to reproduce Chapter 2 ... 138
B.3 Permission to reproduce Chapter 3 ... 139
B.4 Permission to reproduce Chapter 5 ... 144
B.5 Permission to reproduce Appendix A ... 145
Appendix C – Supplemental Data for Chapter 2 ... 150
xii
Appendix E – Supplemental Data for Chapter 5 ... 161
xiii
List of Tables
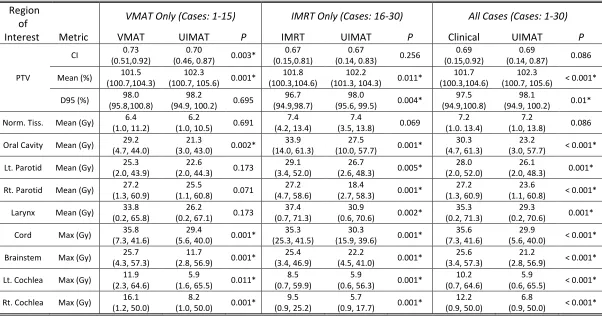
Table 2.1: Median (Min, Max) metric value between our UIMAT plans and the clinically delivered plans. Summaries are provided for VMAT cases (patients 1 – 15), IMRT cases
(patients 16 – 30), and all cases. PTV mean doses and D95s (dose to 95% of the PTV) are
given as percentages of the prescribed dose to the PTV. Reported max dose is the dose to
2% of the volume. Statistically significant differences are indicated by *. ... 31
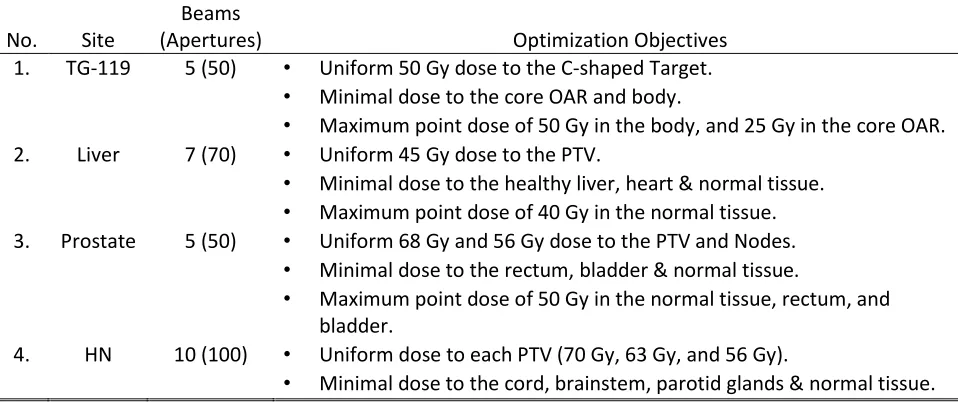
Table 3.1: Optimization objectives used by both algorithms... 50
Table 3.2: Information related to the size of the optimization problem, and each
algorithm’s performance. ... 51
Table 4.1: Optimization objectives used by both algorithms... 70
Table 4.2: Information related to the size of the optimization problem, and each
algorithm’s performance. ... 71
Table 5.1: Mean (standard deviation) dose metric differences compared to the gold standard reCT, normalized by the prescribed dose. Dose metrics that were significantly
different to the reCT are indicated with the asterisk (p < 0.05) and dagger (p < 0.01). ... 88
Table 5.2: The average density and Sørensen-Dice similarity coefficient (compared to the reCT) calculated for each insert in the CIRS 062 phantom, and for each image set. . 91
Table A.1: Comparison of clinically-delivered treatments with UIMAT treatment plans. Note that some patients had multiple target volumes with distinct dose levels (e.g. Patient
3 had both a 70 Gy and a 56 Gy target volume). Approximate treatment delivery times
are given. ... 119
Table A.2: Dose volume parameters of interest for five head-and-neck cases. The mean PTV dose is represented as a percentage of the prescription dose. Certain OARs were not
contoured for some patients, either because the OAR was well outside the treatment
volume or because it was completely enclosed within the PTV. The conformity indices
xiv
mean PTV doses. Since not all patients had the same number of PTV dose levels, P
values and average doses for PTVs were calculated for the highest dose level only. .... 122
Table A.3: Dose volume parameters of interest for five lung cases. The mean PTV dose is represented as a percentage of the prescription dose. ... 124
Table A.4: Dose volume parameters of interest for five prostate cases. The bowel was not contoured for two patients as it lay well outside the treatment volume. The
conformity indices correspond to the target volumes listed in the third-last column, and
similarly for the mean PTV doses. Since not all patients had the same number of PTV
dose levels, P values for PTVs were calculated for the highest dose level only. ... 127
Supplementary Table 2.1: Summary of UIMAT and clinically delivered treatment plans. Patients with several prescriptions had multiple target volumes, each with the listed
dose levels. ... 151
Supplementary Table 2.2: Comparison of dose metrics between the unified plans and the clinically delivered VMAT plans. PTV mean doses and D95 (dose to 95% of the
volume) are given as percentages of the prescribed dose to the target volume(s). Max
doses are defined as the dose to 2% of the volume. Missing dose metrics are a result of
OARs which were not contoured, for example due to an OAR being completely enclosed
within the PTV. ... 152
Supplemental Table 2.3: Comparison of dose metrics between the unified plans and the clinically delivered IMRT plans. PTV mean doses and D95 (dose to 95% of the volume)
are given as percentages of the prescribed dose to the target volume(s). Max doses are
defined as the dose to 2% of the volume. Missing dose metrics are a result of OARs
which were not contoured, for example due to an OAR being completely enclosed within
the PTV. ... 154
Supplemental Table 3.1: PTV dosimetric and volume statistics for each plan. Note that P.S. stands for the Post Sequencing plan. R50 is defined as the ratio of the 50%
xv
Supplemental Table 3.2: OAR dose statistics for each plan and structure. ... 159
Supplemental Table 5.1: Summary of Patient Treatment Information ... 161
Supplemental Table 5.2: Summary of the planning CT acquisition. ... 162
Supplemental Table 5.3: Summary of the re-planning CT acquisition. ... 162
xvi
List of Figures
Figure 1.1: Picture of a linac [left] and the linac’s treatment head (collimator) [right]. Note that these images have been recolored to help identify each component. [left] The
patient lies on the treatment couch (orange) during treatment. Ionizing radiation is
delivered from the gantry (green) towards the patient, as illustrated by the yellow cone.
The gantry (and therefore the beam) can fully rotate around the patient, while the couch
can be rotated, elevated, and repositioned as well. Some linacs possess onboard imaging
capabilities for patient positioning and setup. The x-ray source and detector of this linac’s
imaging unit is highlighted blue and red, respectively. [right] The beam can be attenuated
and shaped using the jaws (blue) and the multileaf collimator (MLC, purple) within the
collimator of the linac. The rotation angle of the collimator can also be adjusted. ... 3
Figure 1.2: Axial view of a left-sided whole breast radiotherapy plan using two parallel and opposing IMRT beams. These beams are visualized as the red and green cones
intersecting with the patient. With this beam setup, dose is limited primarily to the breast
tissue. Meanwhile, the steep dose gradient (illustrated by the isodose lines, with each
colour indicating the region receiving the corresponding dose (or more) in the legend on
the right) generated by the beam edge is used to spare the nearby lung and heart. ... 7
Figure 1.3: Axial view of a prostate radiotherapy plan using a single 360° VMAT arc (beam is not shown to improve visibility). With its wide range of deliverable angles,
VMAT can produce dose distributions that are very conformal to the PTV. ... 8
Figure 1.4: Illustration of the SmartArc planning process. FMO and aperture sequencing is performed at 24° increments. The two CPs with the highest number of open leaf pairs
are selected from each beam, while the rest (CPs 1a & 2a) are discarded. The selected
CPs are then repositioned along the arc (crosses). Additional CPs are generated via linear
interpolation (circles) until a maximum distance between consecutive CPs (typically 4°)
is achieved. This figure is reproduced from Bzdusek et al. [29], with permission from
xvii
Figure 1.5: A sample dose-volume histogram from VMAT lung case. Common dose metrics for the lungs, esophagus and PTV are labelled. ... 13
Figure 2.1: Illustration showing IMRT phases (lavender) and VMAT phases (orange) generated by the UIMAT script. ... 26
Figure 2.2: Comparison of average DVHs for various organs at risk. The clinical average DVH is plotted with the dashed line while the UIMAT average DVH is plotted with a
solid line. ... 30
Figure 2.3: Comparison of dose distributions between: (a) the clinical VMAT plan (left) and UIMAT plan (right) for patient 1 with PTV64Gy in red and PTV60Gy in light green
color wash; (b) the IMRT plan (left) and the UIMAT plan (right) for patient 29 with
PTV70Gy in red, PTV63Gy in green, and PTV56Gy in cyan color wash. ... 32
Figure 3.1: Illustration of the transmission matrix. The left grid shows the index that each beam was assigned (1-16) during FMO. The right grid shows the
pencil-beam array superimposed with MLC of the first aperture (shown in blue). The
corresponding values assigned to the first column of the transmission matrix, due to the
first apertures shape, is provided in the right array. ... 43
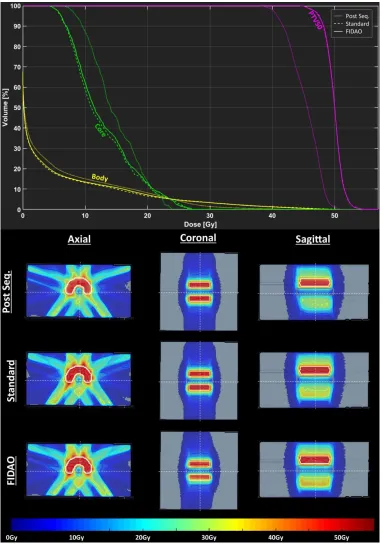
Figure 3.2: Dose-volume histograms (upper) and sample dose-distributions (lower) of the AAPM TG-119 phantom plan after undergoing FMO and aperture sequencing (dotted
line) and when optimized with the FIDAO (solid line) and the standard (dashed line)
DAO algorithms. The cross-section of the axial, sagittal, and coronal planes are shown as
dashed lines on the dose distributions. ... 53
Figure 3.3: Dose-volume histograms (upper) and sample dose-distributions (lower) of the prostate case after undergoing FMO and aperture sequencing (dotted line) and when
optimized with the FIDAO (solid line) and the standard (dashed line) DAO algorithms.
The cross-section of the axial, sagittal, and coronal planes are shown as dashed lines on
xviii
Figure 3.4: Dose-volume histograms (upper) and sample dose-distributions (lower) of the liver case after undergoing FMO and aperture sequencing (dotted line) and when
optimized with the FIDAO (solid line) and the standard (dashed line) DAO algorithms.
The cross-section of the axial, sagittal, and coronal planes are shown as dashed lines on
the dose distributions. ... 55
Figure 3.5: Dose-volume histograms (upper) and sample dose-distributions (lower) of the head-and-neck case after undergoing FMO and aperture sequencing (dotted line) and
when optimized with the FIDAO (solid line) and the standard (dashed line) DAO
algorithms. The cross-section of the axial, sagittal, and coronal planes are shown as
dashed lines on the dose distributions. ... 56
Figure 3.6: Dose-volume histograms of the prostate case after DAO with FIDAO with (solid) and without (dashed) a minimum 64.6 Gy PTV dose objective (upper), a
maximum 35 Gy dose objective to 50% of the rectum and bladder (middle), and a
maximum 60 Gy point dose objective to the rectum (lower) as indicated by the circles
and arrow markers... 63
Figure 4.1: Dose-volume histograms of the AAPM TG-119 phantom plan after undergoing FMO and aperture sequencing (dotted line) and when optimized with the
FIDAO (solid line) and the standard (dashed line) DAO algorithms. ... 72
Figure 4.2: Dose-volume histograms of the liver plan after undergoing FMO and aperture sequencing (dotted line) and when optimized with the FIDAO (solid line) and
the standard (dashed line) DAO algorithms... 72
Figure 4.3: Dose-volume histograms of the prostate plan after undergoing FMO and aperture sequencing (dotted line) and when optimized with the FIDAO (solid line) and
the standard (dashed line) DAO algorithms... 73
Figure 5.1: Schematic of the process used to generate a calibrated CBCT data set for dose calculation (left). The gold standard reCT data set is rigidly registered with the final
xix
Figure 5.2: Illustration of the patient-specific calibration (PSC) method. a) An HU correlation plot is generated for each slice, between corresponding voxels of the CBCT
and the deformed planning CT. Despite the presence of DIR errors (highlighted by the
arrows), a strong slice-specific linear calibration curve of the CBCT HU values to the
planning CT HU values, can be obtained by least square fitting. b) Once the linear
mappings are applied, the calibrated CBCT image set is then rigidly registered, resampled
and merged with the original planning CT image set to extend its field-of-view. Slices
with poor correlation between the CBCT and the deformed planning CT voxel values (R2 < 0.8; outside of dashed lines) were replaced by the original planning CT... 83
Figure 5.3: Illustration of the density-override method. Regions of weight loss (shown in a teal colourwash) were assigned a density of 0 g/cm3 for dose calculations. ... 86
Figure 5.4: The image sets and contours produced for the phantom study. A simulated reCT was produced by reducing the Planning CT’s in-plane voxel size by 5%. The CBCT
voxel size was also adjusted by 5%. The CBCT was then calibrated using both the PSC
and DIR methods. The inserts were delineated on each image and the average density and
Dice Coefficient (relative to the reCT) was computed for comparison. ... 87
Figure 5.5: Average dose-volume histograms of fifteen plans, calculated with the gold-standard reCT image set (dashed line), and the CBCT calibrated with the patient-specific
calibrated method (PSC, solid line), and the DIR method (DIR, dotted line). ... 89
Figure 5.6: (Upper) Sample dose distributions from patient 1 for the plans calculated on the gold standard reCT (left), PSC calibrated CBCT (middle), and DIR calibrated CBCT
(right) image sets. (Lower) Differences between the PSC, DIR calculated dose
distribution and the reCT calculated dose distribution. ... 90
Figure 5.7: Illustration of how the linear calibration tool may be used to highlight regions of deformation error. The bottom frame shows the correlation plot generated for
this slice. The linear mapping used to calibrate the slice is shown in orange, while the
upper and lower bounds of the 95% confidence interval (CI) are shown as the dashed
xx
plot and are also highlighted on the top-right deformed planning CT to show regions
where the CBCT (top-left) and deformed planning CT (top-middle) differ due to DIR
errors. ... 94
Figure 6.1: Visual diagram of proposed future work. The section number describing each future project is stated along each arrow. ... 101
Figure 6.2: Illustration of the new UIMAT algorithm. A) FMO and aperture sequencing (each CP illustrated as a square) is performed at 4° increments. B) DAO with a CP
weight regularizer is performed. As this DAO progresses, the regularizer eliminates CPs
from the treatment plan. C) The results of this DAO are parsed and VMAT (green) or
IMRT (purple) beams are sequenced using the CPs from B). A final DAO is then
performed. ... 102
Figure 6.3: Preliminary DVH [left] and sample dose distributions [right] from the new UIMAT algorithm. ... 104
Figure A.1: Schematic showing how the control points from the initial fixed-beam optimization are distributed into VMAT and IMRT phases. Control points within each
beam have been re-ordered to minimize MLC motion. As well, higher-weighted control
points are preferentially placed in the middle of the ordering to minimize the difference
between the initial and final gantry angles. Interpolated MLC segments are inserted as
necessary to maintain a maximum control point spacing of four degrees. ... 115
Figure A.2: A typical UIMAT plan. The angular ranges for three VMAT phases are represented by arc segments while the fixed gantry angles corresponding to four IMRT
phases are represented by straight line pairs. ... 117
Figure A.3: Comparison of dose distributions between a clinical VMAT plan (top left) and a UIMAT plan (top right) and corresponding dose volume histograms (bottom) for a
xxi
Figure A.4: Comparison of dose distributions between a clinical IMRT plan (top left) and a UIMAT plan (top right) and corresponding dose volume histograms (bottom) for a
lung case (patient 6). ... 125
Figure A.5: Comparison of dose distributions between a clinical VMAT plan (top left) and a UIMAT plan (top right) and corresponding dose volume histograms (bottom) for a
prostate case (patient 14). ... 126
Supplemental Figure 2.1: OAR dose-volume histograms averaged over: a) & b) all cases; c) & d) VMAT cases only; e) & f) IMRT cases only. ... 150
Supplemental Figure 3.1: Dose-volume histograms of the prostate case after undergoing FMO and aperture sequencing (dotted) and when optimized with the FIDAO (solid) and
the standard (dashed) DAO algorithms... 156
Supplemental Figure 3.2: Dose-volume histograms of the liver case after undergoing FMO and aperture sequencing (dotted) and when optimized with the FIDAO (solid) and
the standard (dashed) DAO algorithms... 157
Supplemental Figure 3.3: Dose-volume histograms of the head-and-neck case after undergoing FMO and aperture sequencing (dotted) and when optimized with the FIDAO
xxii
List of Appendices
Appendix A – Feasibility of a unified approach to intensity-modulated radiation therapy
and volumetric modulated arc therapy optimization and delivery ... 112
Appendix B – Permission to Reproduce Content ... 133
Appendix C – Supplemental Data for Chapter 2 ... 150
Appendix D – Supplemental Data for Chapter 3 ... 156
Appendix E – Supplemental Data for Chapter 5 ... 161
xxiii
List of Units and Abbreviations (in order of use)
Gy Gray (1 joule per kilogram) EBRT External Beam Radiotherapy
Linac Linear Accelerator MLC Multileaf Collimator
3D Three Dimensional
HU Hounsfield Unit
CT Computed Tomography
MRI Magnetic Resonance Imaging PET Positron Emission Tomography TPS Treatment Planning System DIR Deformable Image Registration
GTV Gross Tumour Volume
CTV Clinical Target Volume PTV Planning Target Volume
IMRT Intensity Modulated Radiation Therapy VMAT Volumetric Modulated Arc Therapy
OAR Organ at Risk
CP Control Point
MU Monitor Unit
FMO Fluence Map Optimization DAO Direct Aperture Optimization CCC Collapsed Cone Convolution SVD Singular Value Decomposition
DVH Dose Volume Histogram
ROI Region Of Interest
QA Quality Assurance
CBCT Cone-Beam Computed Tomography
GPU Graphical Processing Unit MCO Multi-criteria Optimization
ART Adaptive Radiotherapy
UIMAT Unified Intensity Modulated Arc Therapy FIDAO Fast Inverse Direct Aperture Optimization
SS Step-and-Shoot
RTOG Radiation Therapy Oncology Group
QUANTEC Quantitative Analyses of Normal Tissue Effects in the Clinic
CI Conformity Index
CPU Central Processing Unit
FIDO Fast Inverse Dose Optimization IPOPT Interior Point Optimization
COIN-OR Computational Infrastructure for Operations Research CORT Common Optimization for Radiation Therapy
NVBB Non-Voxel-based Broad-Beam
xxiv SRS Stereotactic Radiosurgery
reCT Re-planning CT
PSC Patient Specific Calibration kVp Kilovoltage Potential
FoV Field of View
OBI Onboard Imaging System
FDK Feldkamp-Davis-Kress
MANOVA Multivariate Analysis of Variance ANOVA Analysis of Variance
CI Confidence Interval
DMPO Direct Machine Parameter Optimization
DASSIM-RT Dense Angularly Sampled and Sparse Intensity-Modulated Radiation Therapy
xxv
List of Symbols
𝐷̅ Mean Dose Metric
𝐷𝑚𝑎𝑥 Max Dose Metric
𝐷𝑥 Dose to 𝑥 percent or volume (in cubic centimeters)
𝑉𝑥 Volume (in percent) receiving 𝑥 dose or more
γ Index used in the gamma analysis
Minimum radial distance between the measurement dose point and the calculation dose points
𝒅𝑥𝑖 Dose calculation matrix
Describes the dose deposited to voxel 𝑥 by pencil beam 𝑖
𝜏𝑖 Fluence Map
Describes pencil beam 𝑖’s intensity
𝑝𝑅𝑂𝐼 Penalty weight assigned to the region of interest’s (ROI) objective
𝑑𝑝𝑡𝑣 Dose prescribed to the PTV
𝑯[𝑓], 𝜶 Hessian matrix of the objective function (𝑓)
𝛿 Kronecker delta function
𝛽⃗ Gradient vector of the objective function
𝑙⃗, 𝑤⃗⃗⃗ Aperture MLC positions and weight, respectively
𝑻𝑗𝜈 Transmission through pencil beam 𝑗 by aperture 𝜈
Θ Heaviside function
1
Chapter 1 – Introduction
1.1
Cancer statistics
Cancer is a highly prevalent disease and a leading cause of death worldwide [1-5]. In
2018, the Canadian Cancer Society projects that about one in two Canadians will be
diagnosed with cancer at some point in their lifetime, and about one in four Canadians
will die with this disease [1]. Fortunately, the cancer mortality rates are declining in many
countries – including Canada – due to earlier detection and intervention, greater access to
treatment, and from advancements in cancer treatments, including radiation therapy [4,5].
1.2
Radiation Therapy Overview
Radiation therapy plays a vital role in the treatment of cancer, with more than half of
all cancer patients receiving radiation therapy at some point over their course of treatment
[3,5]. In radiation therapy, the patient is exposed to one or more sources of ionizing
radiation (i.e. high-energy x-rays, gamma rays, and/or charged particles). This ionizing
radiation can penetrate through the patient’s body, damaging and killing cells along its
trajectory [6,7]. The goal of radiation therapy is to preferentially deliver radiation to the
tumour volume while minimizing the amount of healthy tissue exposed and collaterally
damaged by treatment.
A commonly used metric in radiation therapy is the absorbed dose. Absorbed dose
measures the amount of energy (in joules, J) that is deposited per unit mass of an
absorber (in kilogram, kg), by ionizing radiation [6]. Absorbed dose is measured in the SI
unit Gray (Gy), where 1 Gy = 1 J/kg. The higher the absorbed dose in a volume, the more
likely that lethal cell damage will occur in that volume, and the more likely that cells
within that volume will transform or perish [7]. Therefore, the goal of radiation therapy is
to achieve a high absorbed dose in defined target regions containing cancerous tissue, and
a lower absorbed dose in regions containing normal tissue.
Radiation treatments are often administered over multiple treatment sessions. The
2
instance, healthy tissue can repair faster from radiation damage than most cancerous cells
[7]. Therefore, by administering the treatment over multiple treatment sessions, we can
offer the healthy tissue more repair than cancerous cells. Furthermore, between treatment
sessions, the tumour volume can re-oxygenate, and its cells can enter into more
radiosensitive phases of the cell division cycle. As a result, the tumour volume becomes
more susceptible to radiation damage in future treatment sessions, and the therapeutic
ratio can be improved with fractionated-radiotherapy. A typical radiation treatment will
deliver 60 Gy to the tumour volume over 30 sessions (i.e. in 2 Gy / fraction over 30
fractions).
Radiation therapy can be administered in one of two ways: externally, through a
treatment known as external beam radiotherapy (EBRT), or internally, through a
procedure known as brachytherapy [6]. In brachytherapy, radioactive sources are
permanently or temporarily implanted in the patient, within or in close contact with the
tumour volume [6]. As the radionuclide decays, it emits ionizing gamma rays and/or
charged particles capable of damaging the nearby cells [6,7]. By placing the
radionuclides near or within the tumour volume, the absorbed dose is highest in the
cancerous tissue and reduces rapidly in the distal healthy tissue. Due to the invasiveness
of this procedure, brachytherapy is often only performed in a subset of patients where the
surgical procedure is well tolerated or minimally invasive (e.g. cervical, esophageal, or
localized prostate cancer) [6]. Instead, most cancer patients are treated using EBRT. This
thesis will focus exclusively on EBRT. In EBRT, beams of high-energy x-rays or charged
particles are generated by a medical linear accelerator and directed towards the patient’s
cancerous tissue [6]. While medical linear accelerators (also referred to as a linacs) can
be used to deliver megavoltage electron or x-ray beams, this thesis will deal exclusively
with x-ray beams. A medical linear accelerator and its treatment head (collimator) is
shown in Figure 1.1. To reach deeply seated tumours, the x-ray beam must first travel
through – and deposit dose into – healthy tissue. Due to the dosimetric properties of
x-rays, more dose will be deposited in the shallow healthy tissue than in the deep-seated
cancerous tissue [6]. To minimize the healthy tissue dose, EBRT treatments will use
3
that intersect at the tumour volume. By doing this, less dose is deposited in the healthy
tissue, while a high cumulative dose is deposited in the cancerous tissue. Components
within the collimator, such as the jaws and multileaf collimator (MLC) shown in Figure
1.1, can also be used to attenuate and shape the beams. The plan beams can be optimized
to limit normal tissue dose and to improve the cumulative dose received by the target
volume [6]. In order to determine which beam configuration, beam shapes, and exposure
times to use for each patient, a treatment planning procedure is required as described in
the following section.
Figure 1.1: Picture of a linac [left] and the linac’s treatment head (collimator) [right]. Note that these images have been recolored to help identify each component. [left] The
patient lies on the treatment couch (orange) during treatment. Ionizing radiation is
delivered from the gantry (green) towards the patient, as illustrated by the yellow cone.
The gantry (and therefore the beam) can fully rotate around the patient, while the couch
can be rotated, elevated, and repositioned as well. Some linacs possess onboard imaging
capabilities for patient positioning and setup. The x-ray source and detector of this linac’s
imaging unit is highlighted blue and red, respectively. [right] The beam can be attenuated
and shaped using the jaws (blue) and the multileaf collimator (MLC, purple) within the
4
1.3
EBRT Treatment Process
The EBRT treatment planning process consists of the following major steps: (1)
image acquisition, (2) delineation of target volumes and organs at risk (contouring), (3)
beam selection, (4) plan optimization, (5) plan evaluation, (6) quality assurance, and (7)
plan delivery. Details of each step that are relevant to this thesis, are provided in the
following subsection.
1.3.1
Image Acquisition
Treatment planning begins by acquiring three-dimensional (3D) image sets of the
patient. To calculate the absorbed dose from EBRT treatment in the patient, 3D maps of
the tissue electron density (in electrons per cm3) are needed [8-10]. These maps can be easily generated from the pixel values (Hounsfield Units (HU)) of x-ray computed
tomography (CT) scans [9,10]. These CT scans are acquired in the intended treatment
position and will include any immobilization equipment that will be for treatment. For
instance, personalized immobilization masks are often used for patients with brain and
head-and-neck cancer to hold their head in the same reproducible position during the CT
scan and in each of the treatment sessions. These masks are securely fastened to the
couch of the linac. Similarly, abdominal compressors may be used in patients with lung
cancer to help suppress respiratory tumour motion during the CT scan and treatment.
These CT scans are often referred to as the ‘planning CT’ or ‘CT-sim’ as they are used to
plan and simulate the treatment.
In some cases, it may not be possible to differentiate healthy tissue from cancerous
tissue on the planning CT images, as the borders of the tumour may not be well defined
on this type of scan. Moreover, additional information such a metabolic activity or water
diffusivity may be helpful for differentiating cancerous lesions from healthy tissue,
staging the cancer, or visualizing nearby critical structures (e.g. hippocampus). Therefore,
additional scans of the patient may be acquired using other imaging modalities such as
5
1.3.2
Contouring and Prescription
The image sets (planning CT, MRI, PET) of the patient are imported into a
commercial treatment planning system (TPS). If MRI or PET scans were acquired of the
patient, these image sets are co-registered with the patient’s planning CT using rigid or
deformable image registration (DIR) techniques [12]. The patient’s tumour(s), organs,
and healthy tissue are then delineated on the planning CT with the assistance of the
co-registered MRI or PET scans [13]. The delineated tumour – as it is visible on the MRI,
PET, and/or CT scan – is referred to as the gross tumour volume (GTV).
Cancerous lesions are typically encapsulated by microscopic disease that cannot be
clearly visualized on MRI, PET, or CT scans. To ensure that all cancerous tissue is
treated, a treatment margin is added to the GTVs. This expansion of the GTV is referred
to as the clinical target volume (CTV) [13].
Some patients may have their gross tumour(s) surgically resected prior to radiation
therapy. If no gross tumour is left behind from surgery, the tumour bed will be contoured
instead and labelled as the CTV [13].
In some patients, there may be concerns that the disease has spread into the nearby
lymphatic tissue; even when there is no clear GTV in these regions. In these cases, the
lymphatic tissue may be delineated and treated prophylactically [13]. This is done to
mitigate the risk of local reoccurrence and the risk of the disease spread (metastasis) to
other regions of the body.
Lastly, a margin is added to the CTVs to account for the interfraction variability in
patient positioning, intrafraction motion such as breathing, and the general uncertainties
associated with treatment delivery. This expansion of the CTV is called the planning
target volume (PTV). Each PTV is prescribed a specific absorbed dose level. Primary
PTVs containing the GTV will be prescribed a high absorbed dose that will result in a
high tumour control probability (e.g. 70 Gy). Meanwhile, PTVs containing the lymphatic
6
radiotherapy plan is normalized so that 95% of primary PTV is covered by 100% of the
prescription dose.
1.3.3
Beam Selection
In this step, a treatment planner specifies what type of beam the linac will deliver
(x-rays or electrons); the energy of each beam; the gantry, collimator, and couch angles of
the beams; and how the linac will deliver this radiation. While there are many EBRT
techniques available today, such as electron beams and 3D conformal radiotherapy, the
majority of advanced EBRT treatments use x-ray beams delivered via one of two delivery
techniques: fixed-gantry intensity-modulated radiation therapy (IMRT) and rotational
volumetric modulated arc therapy (VMAT).
In fixed-gantry IMRT, the gantry, couch and collimator angles will remain fixed
while the x-ray beam is being delivered. However, during beam delivery, the linac can
alter the shape of the beam using the MLC and jaws shown in Figure 1.1 [14]. The MLC
(and in some cases, jaws) can move while the beam is being delivered, in a technique
known as sliding-window IMRT. Alternatively, the jaws and MLC can only be moved
when the beam is shut off, known as step-and-shoot IMRT [6]. By modulating the shape
of the beam during treatment, the net intensity (or fluence) delivered from each gantry
angle is spatially varied, hence the name intensity-modulated radiation therapy. This
intensity modulation can be used to improve PTV dose coverage and to minimize the
dose to organs-at-risk (OAR) along the beam trajectories [6]. With the wise selection of
gantry angles, IMRT can generally minimize the healthy tissue exposure and generate
steep dose gradients to spare nearby critical structures, as demonstrated by the whole
7
Figure 1.2: Axial view of a left-sided whole breast radiotherapy plan using two parallel and opposing IMRT beams. These beams are visualized as the red and green cones
intersecting with the patient. With this beam setup, dose is limited primarily to the breast
tissue. Meanwhile, the steep dose gradient (illustrated by the isodose lines, with each colour
indicating the region receiving the corresponding dose (or more) in the legend on the right)
generated by the beam edge is used to spare the nearby lung and heart.
In VMAT, radiation is delivered as the linac gantry continuously rotates the beam
around the patient. Along the arc trajectory, the beam’s dose-rate (i.e. the beam flux) and
shape is modulated [15-16]. The treatment planner specifies the arcs to be used in the
treatment plan and their arc range. While VMAT has limited intensity-modulation at any
given gantry angle, the wide range of deliverable angles allows for more conformal dose
distributions when treating quasi-spherical target volumes, like the prostate PTV shown
in Figure 1.3. The wide range of deliverable angles in VMAT may result in a large
volume of healthy tissue receiving low levels of dose, whereas the limited number of
beams used by fixed-gantry IMRT may result in a smaller volume of healthy tissue being
exposed but receiving higher levels of dose (as illustrated by the isodose lines in Figure
1.2). VMAT treatments are also typically more efficient to deliver than fixed-gantry
8
Figure 1.3: Axial view of a prostate radiotherapy plan using a single 360° VMAT arc (beam is not shown to improve visibility). With its wide range of deliverable angles,
VMAT can produce dose distributions that are very conformal to the PTV.
1.3.4
Plan Optimization
It will be helpful for this section to first go over how medical linear accelerators are
instructed to deliver IMRT and VMAT treatment plans. During delivery, a linac follows a
series of programmed instructions known as control points (CP) [17]. Each CP specifies
the position of each machine components (i.e. the couch position and angle, the gantry
angle, the collimator angle, each jaw position, and each MLC leaf position) and the
cumulative number of monitor units (MUs) that the machine is to deliver by the next CP.
Note that the MU is a calibrated radiation unit that is measured by a monitoring ion
chamber inside the linac head during beam delivery [6]. MU is calibrated to deliver a
certain dose to a reference point in a water phantom under specific condition.
Specifically, one MU is typically calibrated to deliver one cGy to a reference point in a
water phantom at depth 5 cm and source to detector distance 100 cm for a beam with a
field size of 10x10 cm2. In step-and-shoot IMRT, the linac moves the components to the positions specified in the first CP. It then delivers the number of MUs specified for the
9
delivered, the linac moves the components to the positions specified in the next CP, then
delivers the MUs specified for that CP. Conversely, in VMAT and sliding-window
IMRT, the linac moves the machine components between the positions specified in the
first and second CP while delivering the number of MUs that are to be delivered by the
second CP. It continues transitioning the components and delivering the MUs
simultaneously until the last CP is reached.
The goal of plan optimization is to determine what the CPs parameters of the
treatment plan should be. This process begins with the treatment planner creating a list of
plan objectives (sometimes referred to as IMRT objectives). This list will consist of, for
instance, a homogeneous prescribed absorbed dose to each PTV and a maximum dose
permitted for each OAR. A weighting factor is also assigned to each of the planning
objectives, indicating the relative importance of the objective.
When optimizing the treatment plan, each IMRT objective is represented by a scalar
objective function [18]. This function reaches a global minimum value of zero when the
3D dose distribution of the plan satisfies the corresponding IMRT objective. The goal of
plan optimization is to determine the CP parameters whose 3D dose distribution
minimizes the weighted sum of these objective functions (i.e. that simultaneously
satisfies as many of the IMRT objectives as possible). Unfortunately, these objective
functions often have multiple minima, and so there is a risk that conventional
deterministic optimization methods like gradient-descent could become trapped at a local
minimum (i.e. at a sub-optimal solution). This issue can be avoided by using stochastic
optimization techniques, such as simulated annealing, which can ‘escape’ from local
minima [19]. However, stochastic optimization methods are typically much slower than
deterministic methods, and so most commercial treatment planning systems use
deterministic optimization algorithms (as described in Chapter 3 and Chapter 4). Briefly,
these optimization algorithms perform the following IMRT/VMAT treatment planning
procedure which will initialize the CP parameters as close to the global minimum of the
10
IMRT plan optimization begins with fluence map optimization (FMO). FMO
optimizes each beam’s fluence map based on the planning objectives [20]. A more
detailed summary of FMO can be found in Chapter 3.2.1. FMO tells us what the ideal
beam fluence should be after a beam is delivered, but it does not tell us how many CPs
are needed or what the CP parameters should be to generate the optimal fluence map. To
get this CP information, an aperture-sequencing algorithm is executed on the optimized
fluence maps [14]. These sequencing algorithms decompose the fluence map into a
collection of segments, with each segment having a single homogeneous intensity. These
segments can be easily converted into equivalent CP information. Usually, the number of
CPs needed to faithfully recreate the optimal fluence map, is too high for delivery to be
practical [19]. Therefore, sequencing algorithms are typically forced to approximate the
ideal fluence map using a limited number of CPs. Due to this approximation, plan quality
often degrades after aperture sequencing. To recoup this plan degradation, direct aperture
optimization (DAO) are typically used [19,21-27]. These DAO algorithms iteratively
optimize the MLC, jaw, and MUs values of each CP while also taking into consideration
the delivery limitations of the specific linear accelerator. A more detailed introduction to
DAO can also be found in Chapter 3.2.2. Some DAO algorithms optimize the aperture
shapes after FMO and aperture sequencing [22], while others incorporate the aperture
sequencing step into the FMO algorithm [23]. Both types of DAO use the same planning
objectives as FMO. The result of these DAO algorithms is the CPs necessary for
achieving the desired planning objectives.
The plan optimization algorithm used for VMAT treatment planning is dependent on
the commercial TPS [16,28,29]. For this thesis, only the SmartArc VMAT planning
algorithm is introduced [29]. Upon starting VMAT optimization, SmartArc performs
FMO and aperture sequencing at fixed-gantry angles every 24 degrees between the
user-specified starting and stopping angle. It then selects the two CPs with the highest number
of open leaf pairs from each beam, while discarding all the rest of CPs. The selected CPs
are then redistributed around their original gantry position. Additional CPs are then
created between the selected and repositioned CPs, via linear interpolation, until a
11
process is referred to as arc sequencing and is illustrate in Figure 1.4. DAO is then
performed on the CPs of the VMAT arc, using the same planning objectives as before.
Note, the DAO algorithms used for VMAT also incorporate any VMAT related delivery
constraints, such as the maximum dose rate and gantry rotation speed.
Figure 1.4: Illustration of the SmartArc planning process. FMO and aperture sequencing is performed at 24° increments. The two CPs with the highest number of open leaf pairs
are selected from each beam, while the rest (CPs 1a & 2a) are discarded. The selected
CPs are then repositioned along the arc (crosses). Additional CPs are generated via linear
interpolation (circles) until a maximum distance between consecutive CPs (typically 4°)
is achieved. This figure is reproduced from Bzdusek et al. [29], with permission from
John Wiley and Sons (Appendix B.1).
The accuracy and efficiency of plan optimization relies heavily on the dose calculation
algorithm that is used for plan optimization [10]. High dosimetric accuracy is needed so
that the plan parameters are correctly optimized, and the optimization converges to the
users-specified plan objectives. However, the dose calculation should be sufficiently fast
for the optimization to complete in a practical amount of time. A common approach is to
perform an accurate but less efficient dose calculation (e.g. collapsed cone convolution
(CCC)) in the middle of the optimization. Then, during DAO, the algorithm uses a fast
but less accurate dose engine (e.g. singular value decompositions (SVD)) to ‘perturb’ the
dose distribution, based on the difference between the current plan parameters and plan
12
optimization without a substantial decrease in the dosimetric accuracy. At the end of
optimization, a more accurate dose calculation algorithm such as CCC will be used again
for the final dose computation of the plan.
1.3.5
Plan Evaluation
The plan quality will be evaluated once plan optimization is completed. The
following tools are commonly used to assess EBRT plan quality: (1) the 3D dose
distributions, (2) cumulative dose-volume histograms (DVH), and (3) dose metrics [6].
3D dose distributions and isodose lines (as shown in Figure 1.2 and Figure 1.3) can
be used to evaluate the conformity of the dose distribution to the PTVs and doses to
organs at risk.
Cumulative DVHs gives a compact summary of the 3D dose distribution for selected
regions of interest (ROIs). Each DVH is plotted with the volume (absolute or relative) of
a ROI on the vertical axis that is receiving more than or equal to the dose on the
horizontal axis. An example of a DVH for a VMAT lung case is shown in Figure 1.5.
Each of the PTV and OAR volumes are plotted separately on the DVH. Ideally, PTV
DVHs will be as close to the top right as possible, indicating a high dose to as much of
the PTV as possible. Conversely, all OAR DVHs should be bunched as close to the
bottom left as possible, indicating that as little of the OAR is exposed to as low of a dose
as possible. Many planning objectives, like the minimum and maximum dose, can be
13
Figure 1.5: A sample dose-volume histogram from VMAT lung case. Common dose metrics for the lungs, esophagus and PTV are labelled.
Dose metrics are typically points on the DVH (e.g. the maximum dose as described
above) or quantify some property about a DVH (e.g. conformity of the PTV coverage).
Common dose metric include: the mean dose (𝐷̅), the maximum point dose (𝐷𝑚𝑎𝑥), the
minimum dose received by 𝑥 volume in cubic centimeters (𝐷𝑥 𝑐𝑐), the minimum dose
received by 𝑥 % of the volume (𝐷𝑥%), and the percent volume receiving 𝑥 dose or more
(𝑉𝑥 𝐺𝑦). Various dose metrics have been labelled on the DVH in Figure 1.5. Several dose
metrics have been correlated with patient outcome data [31]. For instance, the lungs
𝑉20𝐺𝑦 (the volume of the lungs receiving 20 Gy or more, shown in Figure 1.5) has been
shown to be predictive of the patient developing pneumonitis after radiotherapy [32]. It is
recommended that the lung 𝑉20𝐺𝑦 be below 30% for treatment (it is about 7% in the plan
14
If the dose distribution, the DVHs, or any of the dose metrics don’t meet the clinical
goal (e.g. the 𝑉20𝐺𝑦 objective above), the plan will be re-optimized with modified
planning objectives and/or objective weights. This cycle is repeated, in a trial-and-error
approach, until a satisfactory treatment plan is achieved.
1.3.6
Quality Assurance
Once a satisfactory plan has been obtained, a series of quality assurance (QA) checks
are performed to ensure that the treatment plan is safe, effective, and can be delivered
accurately [33]. One QA test that will be relevant to this thesis is the patient-specific plan
QA. First, the patient’s treatment plan is delivered to a phantom that can measure and
record the cumulative dose at numerous points in space. Let the spatial location of these
measurements be denoted by, 𝑟𝑚, and the dose that is recorded at these points be,
𝐷𝑚(𝑟𝑚). The measured dose is then compared with the dose distribution calculated by the
TPS, via a gamma analysis [34]. Specifically, let 𝐷𝑐(𝑟𝑐) be the dose calculated by the
TPS at the location 𝑟𝑐. For each measurement point 𝑟𝑚, the gamma analysis will find the
𝑟𝑐 that yields the lowest value to the function:
Γ(𝑟𝑚, 𝑟𝑐) = √(
𝐷𝑐(𝑟𝑐) − 𝐷𝑚(𝑟𝑚)
ΔD )
2
+ (𝑑(𝑟𝑐, 𝑟𝑚)
Δ𝑑 )
2 .
That is,
𝛾(𝑟𝑚) =min𝑟
𝑐 Γ(𝑟𝑚, 𝑟𝑐) .
Note, 𝑑(𝑟𝑐, 𝑟𝑚) is the Euclidean distance between 𝑟𝑐 and 𝑟𝑚, and ΔD and Δ𝑑 are the dose
difference and distance-to-agreement acceptance criteria set by the user. Any
measurement points where 𝛾(𝑟𝑚) > 1 indicates a region where the measured dose and
calculated dose disagree by more than the composite acceptance criteria. The gamma
pass-rate gives the percentage of points where the measured dose agrees with calculated
dose within the acceptance criteria. A common criteria is that 95% or more of the
phantom dose measurements agree with the calculated dose, when the gamma analysis is
performed with a 3% dose difference and 3 mm distance-to-agreement acceptance
15
1.3.7
Plan delivery
During a treatment session, the patient will be set up on the treatment couch (see
Figure 1.1) in the same treatment position as the planning CT. Planar x-ray images or
cone-beam computed tomography (CBCT) images may be acquired with linac’s on-board
imaging system (shown in Figure 1.1) and compared with the planning CT, to ensure
accurate patient positioning [6]. Alternative image guidance technique like megavoltage
x-ray CT, MRI, or optical guidance systems may also be used, if available, for patient
positioning [35]. Once the patient is in the planned treatment position, the linac will
deliver the patient’s treatment plan. The patient will be treated with this plan, once or
twice a day, Monday to Friday, for up to several weeks.
Over the course of treatment, the patient may undergo anatomical changes such as
weight loss or tumour regression [36]. These changes may impact the effectiveness of the
patient’s immobilization equipment, leading to possible setup errors. Moreover, these
changes may alter how radiation dose is distributed in the patient, leading to sub-optimal
outcomes or unintended treatment-related side-effects [37].
To ensure that the patient receives adequate treatment, the patient may be referred for
a new planning CT when their immobilization equipment is no longer effective or if large
anatomical changes are observed between the patient’s original planning CT and a CBCT
acquired on-line. The patient’s new planning CT will be contoured and registered with
the patient’s original planning CT. The patient’s plan will then be ‘copied’ onto the new
planning CT for dose calculation and plan assessment. If the plan quality is deemed
inadequate, a new treatment plan will be generated on an accelerated timeline. The
patient will then resume treatment with this new treatment plan. This is the process of
treatment plan adaptation
1.4
Research Motivation
There are a number of ways in which the EBRT process described above, could be
16
First, EBRT treatments typically use either IMRT or VMAT delivery techniques.
However, due to the complementary dosimetric properties of VMAT and IMRT, there
could be an advantage to combining both VMAT and IMRT together in the same plan, as
opposed to using one or the other. Currently, TPS do not support the simultaneous
optimization of VMAT and IMRT. Instead, hybrid VMAT-IMRT treatment plans can
only be created by optimizing the VMAT and IMRT portions separately [38]. This calls
into question whether the treatment plan is truly optimal, as the plan parameters are never
truly optimized together at the same time. Moreover, this planning approach will require
that the IMRT and VMAT beams be delivered separately, making treatment delivery
much less efficient.
Another source for improvement is the time spent optimizing IMRT, VMAT, as well
as any future hybrid VMAT-IMRT treatment plans. Due to the computational complexity
of the DAO problem, and the current trial-and-error approach to plan optimization,
treatment planning can sometimes take several hours or even days to complete in some
very complex cases. Furthermore, when there is limited time for treatment planning (e.g.
for re-planning), sub-optimal treatment plans may be deemed acceptable for treatment, so
that treatment delivery is uninterrupted. While newer TPS offer DAO algorithms that are
implemented on fast parallelized graphical processing units (GPU), they are still not fast
enough for applications like: (1) multi-criteria optimization [39,40] where numerous
treatment plans are generated and compared, and (2) on-line adaptive radiotherapy (ART)
where treatment re-planning is performed at the linear accelerator – while the patient is
immobilized and awaiting treatment – using the 3D image sets acquired on-line (e.g.
CBCT, MRI) [41,42].
Finally, even if fast DAO algorithms were available for on-line ART, another hurdle
for ART is getting accurate electron density information from the 3D data sets acquired
on-line, for dose calculations and plan optimization. For instance, MRI lacks a one-to-one
correspondence between the voxel (3D pixel) intensity and electron density [43].
Meanwhile, patient-specific scattering conditions in CBCT can influence the accuracy of
electron density maps [44]. Several methods of calibrating CBCTs for accurate dose
17
registration (DIR) algorithms that warp the accurate planning CT data onto the patient
anatomy obtained from the CBCT. However, these DIR algorithms often introduce
localized deformation errors which could potentially impact the densitometric, dosimetric
and contouring accuracy within the region (see Chapter 5 for details). Therefore, more
precise methods of acquiring electron density information from these image sets are still
needed.
Even if fast DAO algorithms are unavailable for on-line ART, these electron density
maps will be helpful for on-line dose calculations and plan assessment to judge whether
treatment re-planning is truly necessary. Specifically, the effectiveness of the patient’s
immobilization equipment and the anatomical changes viewed on CBCT may not always
be good indicators that treatment intervention and re-planning is necessary. It is not
uncommon for a new planning CT to be acquired, contoured, and the plan copied over for
plan assessment, only to find that the plan quality has not changed significantly to
warrant re-planning. More importantly, these markers could be failing to identify patients
that do need treatment intervention.
The overarching goal of this research is to address these critical areas of improvement
in EBRT. Note that this is by no means an exhaustive list of how EBRT could be
improved for gains in clinical outcomes. Many other areas for improving EBRT and
patient outcome are currently under investigation at institutions around the world, such as
the use of heavy-ion beams (e.g. proton, carbon-ion) [6], hypo-fractionation treatment
regimens for the treatment of primary and oligometastatic cancer [45,46], and
immunotherapy and its possible synergistic effects with radiation therapy [47], to name a
few.
1.5
Research Hypothesis
We hypothesize that a fast plan optimization algorithm that unifies rotational
volumetric modulated arc therapy and fixed-gantry intensity-modulated radiation therapy
will improve radiotherapy plan quality, planning and delivery efficiency, and will provide
18
1.6
Chapter Objectives
In Chapter 2, we evaluate a plan optimization algorithm called unified
intensity-modulated arc therapy (UIMAT) on complex head-and-neck cases. This UIMAT
algorithm simultaneously optimizes both rotational VMAT and fixed-gantry IMRT
delivery techniques and combines their delivery. That is, UIMAT sequences the plan CPs
such that, at delivery, the linac will deliver just like a VMAT beam. However, when this
UIMAT beam reaches a gantry angles selected for IMRT delivery, it will halt gantry
rotation and begin delivering like a step-and-shoot IMRT beam. After delivering this
IMRT portion, the UIMAT beam will resume VMAT delivery. Delivery efficiency is
improved by combining VMAT and IMRT’s delivery in this way. Since this UIMAT
algorithm was initially developed before entering this PhD program, details of this
UIMAT plan optimization algorithm are provided in Appendix A.
In Chapter 3, a new DAO algorithm called fast inverse direct aperture optimization
(FIDAO) is developed. FIDAO introduces modification to the equations used in DAO.
These modifications greatly reduce the computation time of repeated calculations
performed in the DAO process. By reducing the time of these calculations, DAO will be
able to execute faster and improve the treatment planning efficiency, potentially allowing
for on-line applications. Chapter 3 describes and evaluates this FIDAO algorithm for
fixed-gantry IMRT treatment planning, while Chapter 4 evaluates FIDAO for rotational
VMAT treatment planning.
In Chapter 5, a patient-specific CBCT calibration technique for on-line dose
calculation and plan assessment is developed. By performing dose calculations and plan
assessment on-line with these CBCT datasets, we can better differentiate the patient that
truly require treatment re-planning from those who do not, saving resources and time.
Moreover, with a fast DAO algorithm like the one developed in Chapter 3 & Chapter 4,
the treatment re-planning could be potentially performed on-line with the calibrated
CBCTs.
Finally, Chapter 6 summarizes the findings of this thesis, the potential clinical impact
![Figure 1.1: Picture of a linac [left] and the linac’s treatment head (collimator) [right]](https://thumb-us.123doks.com/thumbv2/123dok_us/1901557.1248936/28.612.109.535.248.500/figure-picture-linac-left-linac-treatment-collimator-right.webp)