STRATEGIC DRIFT AND ITS EFFECT ON THE PERFORMANCE OF INSURANCE COMPANIES IN NAIROBI CITY COUNTY, KENYA
LEE ESTONE GACHANJA D53/CTY/30860/2015
A RESEARCH PROJECT SUBMITTED TO THE SCHOOL OF BUSINESS IN PARTIAL FULFILLMENT OF THE REQUIREMENTS FOR THE AWARD OF THE
DEGREE OF MASTERS IN BUSINESS ADMINISTRATION (STRATEGIC MANAGEMENT OPTION), KENYATTA UNIVERSITY
ii DECLARATION
This research project is my original work and to the best of my knowledge has not been presented for a degree in any other University.
Signature……… Date……….
Lee Estone Gachanja
D53/CTY/30860/2015
This research project has been submitted for examination with my approval as the university supervisor.
Signature……… Date……….
Dr. Philip Wambua
Lecturer
School of Business
iii
ACKNOWLEDGEMENT
iv
TABLE OF CONTENTS
DECLARATION... ii
ACKNOWLEDGEMENT... iii
TABLE OF CONTENTS ... iv
LIST OF TABLES ... viii
LIST OF FIGURES ... ix
LIST OF ABBREVIATIONS AND ACRONYMS ...x
OPERATIONAL DEFINITION OF TERMS ... xi
ABSTRACT ... xii
CHAPTER ONE: INTRODUCTION ... 1
1.1 Background of the Study ... 1
1.1.1 Organization Performance ... 2
1.1.2 Strategic Drift ... 3
1.1.3 Insurance Industry in Kenya ... 5
1.2 Statement of the Problem ... 6
1.3 Objectives of the Study ... 7
1.3.1 General Objective ... 7
1.3.2 Specific Objectives ... 7
1.4 Research Questions ... 7
1.5 Significance of the Study ... 8
1.6 Scope of the Study ... 8
1.7 Limitations of the Study... 8
1.8 Organization of the Study ... 9
CHAPTER TWO: LITERATURE REVIEW ... 10
v
2.2 Theoretical Review ... 10
2.2.1 Black Swan Theory... 10
2.2.2 Path Dependency Theory... 11
2.2.3 Arbitrage Pricing Theory ... 12
2.2.4 The Resource-Based View ... 13
2.3 Empirical Review... 15
2.3.1 Organizational Culture and Performance of Insurance Companies ... 15
2.3.2 Leadership and Performance of Insurance Companies ... 16
2.3.3 Innovation and Performance of Insurance Companies ... 17
2.3.4 Strategic Planning and Performance of Insurance Companies ... 19
2.4 Summary of Reviewed Literature and Research Gaps ... 20
2.5 Conceptual Framework ... 22
CHAPTER THREE: RESEARCH METHODOLOGY ... 24
3.1 Introduction ... 24
3.2 Research Design... 24
3.3 Target Population ... 24
3.4 Sample Size and Sampling Procedure ... 25
3.5 Data Sources and Collection ... 25
3.6 Validity and Reliability of Research Instrument ... 26
3.6.1 Pilot Test ... 26
3.6.2 Validity of Research Instrument ... 26
3.6.3 Reliability of Research Instruments... 26
3.7 Data Analysis and Presentation ... 27
vi
CHAPTER FOUR: DATA ANALYSIS, PRESENTATION AND INTERPRETATION
... 29
4.1 Introduction ... 29
4.2 Response Rate ... 29
4.3 Demographic Characteristics of the Respondents ... 30
4.3.1 Length of Time in the Insurance Company ... 30
4.3.2 Highest Education Level of the Respondents ... 31
4.3.3 Type of Premiums/ Policies Offered ... 31
4.4 Descriptive statistics ... 32
4.4.1 Organization Culture and Performance of Insurance Companies ... 33
4.4.2 Leadership and Performance of Insurance Companies ... 34
4.4.3 Innovation and Performance of Insurance Companies ... 36
4.4.4 Strategic Planning and Performance o f Insurance Companies ... 38
4.4.5 Organization Performance ... 40
4.5 Inferential statistics ... 41
4.5.1 Regression Analysis... 41
CHAPTER FIVE: SUMMARY OF FINDINGS, CONCLUSIONS AND RECOMMENDATIONS... 45
5.1 Introduction ... 45
5.2 Summary of Findings... 45
5.3 Conclusions ... 47
5.4 Recommendations ... 47
5.5 Areas for Further Research ... 48
REFERENCES... 49
vii
Appendix I: Introduction Letter ... 59
Appendix II: Questionnaire... 60
Appendix III: List of Registered Insurance Companies-2014 ... 64
viii
LIST OF TABLES
Table 2.1: Summary of Reviewed Literature and Research Gaps ... 20
Table 3.1: Target Population... 25
Table 3.2: Reliability Statistics ... 27
Table 4.1: Descriptive Statistics for Organization Culture ... 33
Table 4.2: Descriptive Statistics for Leadership ... 35
Table 4.3: Descriptive Statistics for Innovation ... 37
Table 4.4: Descriptive Statistics for Strategic Planning ... 39
Table 4.5: Descriptive Statistics for Organization Performance ... 40
Table 4.6: Model Summary ... 41
Table 4.7: ANOVA ... 42
ix
LIST OF FIGURES
Figure 2.1: Conceptual Framework ... 23
Figure 4.1: Response Rate of the Respondents... 29
Figure 4.2: Length of Time in the Insurance Company ... 30
Figure 4.3: Highest Education Level of the Respondents ... 31
x
LIST OF ABBREVIATIONS AND ACRONYMS
AIBK- Kenya Insurance Brokers of Kenya AKI- Association of Kenya Insurers
ANOVA- Analysis of Variance
APT- Arbitrage Pricing Theory CFA- Confirmatory factor analysis
GDP- Gross Domestic Product
ICT- Information and Communications Technology IRA- Insurance Regulatory Authority
NACOSTI- National Commission for Science, Technology and Innovation SEM- Structural Equation Modelling
xi
OPERATIONAL DEFINITION OF TERMS
Innovation- the procedure of the adopting the internally or externally produced policies, schemes, strategies, platforms, processes, outcomes or services that are latest to the adopting firm
Leadership- twofold focused management method that works regarding what is paramount for persons and what is paramount for a group as a whole concurrently
Organization Culture- the shared morals, dogmas and ideologies of members of an organization
Performance- definite output or outcomes of an organization as calculated against its envisioned outputs (aims and intentions)
Strategy - sum of the proceedings an organization wishes to seize in the achievement of long-term objectives
Strategic drift – A steady worsening of competitive actions resulting in the flopping of a firm in the acknowledgement and response to variations in the business setting.
xii ABSTRACT
1
CHAPTER ONE: INTRODUCTION
1.1 Background of the Study
Organizational performance is a detailed analysis of its performance against its targets and purposes (Kanogo, 2013). It focuses on the financial performance, market performance and shareholder value of the organization. Devinney et al., (2008) suggested that organizational performance is inclusive of financial performance that is profits, return on assets and return on investments, market performance including sales and market share and shareholder return. Some organizations measure performance based on how effective they use their resources to make profit (Mutuku et al., 2013).
2
Organizations’ remaining very competitive over a period of time as the business setting alters, learning adaptation strategies and reorienting themselves is very critical in avoidance of strategic drift (Auster & Choo, 2004). There is need of having cautious and harmonized inclination leading to a steady systematic readjustment amid organization’s business setting and strategic positioning resulting in improved performance, efficiency and effectiveness so as to achieve the long term growth and improve their performance (O’Regan et al., 2012). Understanding the constraints, opportunities and menaces provided by the external setting is vital for the firms to profit from opportunities and avoidance of the menaces by applying appropriate response strategies as well as avoid strategic drift that will hinder their performance, survival and competitiveness (Xu et al., 2003).
Generally, in developed economies, the contribution of the insurance business is significant to the Gross Domestic Product (GDP). Insurance business is the mainstay of the risk management system of any country as it safeguards financial security, aids in the intermediation chain of finances and poses an organized basis for long term capital for infrastructural projects in Nigeria (Augustine & Nwanneka, 2011).
1.1.1 Organization Performance
3
satisfaction of the employee, retention and plans on succession must be kept on track by business enterprises.
Measurement of performance is the foundation of establishing the strategy and future accomplishments since it categorically brings the vision and the strategic targets of a company to all the members of an organization and performs a function making effective internal business processes possible (Chang & Chuang, 2009).The resultant assumption is that organizational performance is a concept with many elements intercepting into the finances, operations and domains allied to the customer (Karanja et al., 2014). Practically, organizational performance is considered as the comparison of the value created by a firm, measured through efficacy, effectiveness and significance of performance of the organization, with the value the owners expect to receive from the firm (Fahey & King, 2010). The firm’s performance can therefore be reflected by indicators like product sustainability, reliability, quality, productivity, profitability, cost management and market share among others (Mathur, 2004).
Each organization has a distinctive set of situations, making measurement of performance essentially situational. Outcomes of performance result from success or the position in the market attained (Constable & McCormick, 2009). Market share, profitability and customer satisfaction are the performance measurement indicators for this study.
1.1.2 Strategic Drift
4
According to Sammut-Bonnici (2014), strategic drift is the steady decline of competitive action resulting in an organization failure in acknowledging and responding to alterations in the business setting. It describes a gist of intellectual inactivity in the organization’s ability in meeting the objectives originally put in place. The signs of strategic drift are a similar viewpoint at the management and panel levels, protection of the ranks, absence of emphasis on the exterior business setting and performance failure.
According to Dwyer & Edwards (2009), strategic drift is a strategic management concept which refers to an organization’s response when going through a changing business setting. When developing strategies that may bring changes in an organization, different unexpected challenges and situations may arise. Alterations on what consumers expect and need, structure of the market and competition, macro-environment and internal strategies change are sets of causes to address strategic drift (Danciu, 2010). Strategic drift distracts the management, causes a loss of momentum, wastes time, money and valuable resources. Grant (2008) argues that it therefore increases the total operating cost which hinders achievement of competitive advantage by organizations.
5
Strategic drift occurs when there is a failure of the strategies to maintain pace with the changing environment. Also, due to uncertainty of change hence a tendency to stick to the familiar. Strategic drift can also be due to core rigidities whereby competencies that are taken for granted and deeply embedded in procedures are hard to alter even when their suitability is no longer there. Strategic drift is therefore characterized by highly homogeneous organizational culture and paradigm and where questioning is discouraged, there are significant blockages of power to change such as dominating leaders who are resistant and there is less focus on the organization’s external business setting (Mark & Spencer, 2008).
1.1.3 Insurance Industry in Kenya
According to Insurance Regulatory Authority, 49 insurance companies are registered in Kenya. 23 companies of which are life insurance companies with 26 being purely non-life insurance companies while 37 are general insurance companies (IRA, 2014). There are 16 companies which involve themselves in general insurance business while 7 are pure life insurance companies. The body that does supervision and regulation of the players in the insurance industry is the IRA.
6
at end of 2014, pressure has been exerted on insurers to articulate effective strategies facilitating proactive reaction to these alterations in the competitive business setting and most specifically avoidance of strategic drift (Kiragu, 2016).
1.2 Statement of the Problem
The business setting in Kenya is dynamic, turbulent and unpredictable. The success of any business in such a setting is dependent on its capability to respond to environmental variations. In the recent past, the insurance industry in Kenya has undergone a sequence of variations through reforms in finances, advancements in ICT, financial services globalization and development in the economy (AKI Report, 2014). These alterations have had a significant effect on efficacy, productivity and structure of the market and giving rise to a business setting that is highly competitive affecting the insurers’ performance (Gitau, 2013). Further, there has been competition in the various services offered by the insurance companies affecting their market share subsequently profitability.
7
endeavored to establish. It is in light of this knowledge gap that this research sought to fill by investigating the effect of organizational culture, leadership, strategic planning and innovation on strategic drift.
1.3 Objectives of the Study 1.3.1 General Objective
The main objective of the study was to establish the effect of strategic drift on the performance of insurance companies in Nairobi City County, Kenya.
1.3.2 Specific Objectives
i. To establish how organizational culture affects the performance of insurance companies in Nairobi City County, Kenya.
ii. To examine the effect of leadership on the performance of insurance companies in Nairobi City County, Kenya.
iii. To assess how strategic planning affects the performance of insurance companies in Nairobi City County, Kenya.
iv. To find out how innovation affects the performance of insurance companies in Nairobi City County, Kenya.
1.4 Research Questions
i. How does organizational culture affect the performance of insurance companies in Nairobi County, Kenya?
ii. What are the effects of leadership on the performance of insurance companies in Nairobi County, Kenya?
8
iv. To what extent does innovation affect the performance of insurance companies in Nairobi County, Kenya?
1.5 Significance of the Study
This study is of significance to the top management of insurance companies to understand better the issues surrounding strategic drift. This study has brought out peculiarity of strategic drift in the Kenyan economy as compared to other world economies. The outcome of this study are significant to the county government and national government as it brings to light the effect of strategic drift on the performance of insurance companies in Nairobi City County Kenya and Kenya as a nation. Policy makers would also use the findings of the study in enhancing efficiency and effectiveness in insurance companies’ performance in Nairobi City County. The study findings may awaken the concerns of insurers and scholars to do more research in the developing economies especially in Africa. The researchers will have a basis for further research by adopting a different research methodology or extending the period of analysis. Future studies will also be referred in this report.
1.6 Scope of the Study
The study established strategic drift and its effect on the insurance companies’ performance in Nairobi County. The study targeted the 49 insurance companies in Nairobi County, since all insurance companies have their headquarters based in Nairobi. The study used a descriptive survey design to ensure there is least bias in data collection. The study targeted general managers in the insurance companies.
1.7 Limitations of the Study
9
ensured that the questions were clear and well understood. The study was limited by the work experience of the respondents which was based on their understanding on the dimension and concepts under study. Targeting general managers of the insurance companies ensured this limitation was eliminated.
1.8 Organization of the Study
10
CHAPTER TWO: LITERATURE REVIEW 2.1 Introduction
Determinants of strategic drift and their effects on the insurance companies’ performance in Nairobi County, Kenya were assessed in this chapter. Theoretical review and empirical review of literature relating to the topic directed by the specific study objectives was done. Summary and knowledge gap were also identified.
2.2 Theoretical Review
Various theories attempt to elucidate the correlation between strategic drift and insurance companies’ performance. This study adopted the Black Swan Theory, Path Dependency Theory and Arbitrage Pricing Theory.
2.2.1 Black Swan Theory
The theory was propagated by Nassim (2008) who stated that the earth is deeply influenced by occasions that are intermittent and unpredictable, of low probability but causing significant effect. Silberzath (2013) denoted that new categories of events are not created by a black swan but simply a known category of events occurs whose probability is normally underestimated. The occurrence of these events is not because their probability is intrinsically unpredictable, but the wrong calculation by the model used or dismissal of the probability of the occurrence of the event if the needful to take them earnestly.
11
production and investment decisions even when they are dealing with processes that are risky. There is no provision of a satisfactorily large sample for adequate black swans’ appearance in calculation of a probabilistic risk of combating a black swan in this theory.
This black swan theory relates with the leadership of the insurance companies. This can help the management in a great way in making centralized decisions to avoid making decisions that would jeopardize the running of the company in case a mistake is done. Conversely, the management is able to make informed decisions based on the probable risks expected.
2.2.2 Path Dependency Theory
This is a dynamic theory with varying levels and builds on the theoretical descriptions by Brian (1994). The process of path-dependence is categorized into three stages. Stage one is illustrated by a process of searching that is undirected. There are unconstrained choices and decisions are considered as contingent events unexplainable by events or initial conditions that took place before (Mahoney, 2000). This means that all the occurrences are dependent on the decisions made. When decisions are made, vibrant self-reinforcing processes sets in, eventually leading to patterns that are deterministic. The moment where setting of the path dependency into action takes place indicates a significant juncture (Collie & Collier, 1991). These junctures are significant since once a specific choice has been made, it turns out hard to go back to the beginning point where multiple options were available (Mahoney, 2000).
12
justifiable effect to develop, diffuse and adapt to a technology or an institution. Incidentally this prompts a process that is self -reinforcing with a likelihood of becoming principally regulated by the procedure of escalating proceeds (Arthur, 1994)
Changing to the third stage is evidenced by a lock-in (Arthur, 1994). One specific technology or institution at this phase is usually adopted makes the new entrants forcefully adopt it too. This specific outcome is as a result of the processes. Valid options are no longer useful. The rational choices are the basis for the classical model of path dependency. Rational decisions are taken by individuals who may not have intentional and rational effects at a collective or system level (Arthur, 1994).
This theory is relevant to the study since identification of deeds and occurrences actually prompting a path-dependent procedure within and across firms earliest possible is increasingly important. Further, it is critical to detect strategic difference indicators at strategic articulation points (Burgelman & Grove, 1996) in the description of one type of dynamics of an industry giving way to another and/or when, on the organization, there is a variation in one strategy into another, regardless of being purposeful or developing. Once identification has taken place, there should not be giving up by the management, but should join in the process of shaping, breaking and creating the path so as to avoid strategic drifts (Ebbinghaus, 2005).
2.2.3 Arbitrage Pricing Theory
13
should be similar to the expected end of period asset value or future cash flows discounted at the rate indicated by the model. Varying the asset value, arbitrage brings it back to the line.
APT is in agreement that although many varying particular forces can affect the proceeds of an individual stock, the specific consequences tend to annul in large and well differentiated portfolio. This is the diversification dogma and has an effect in the insurance industry. There isn’t a way of predicting if a specific person will fall sick or their involvement in a misfortune by an insurance firm but there is a way of perfectly predicting of the losses by the company on a large pool of such risk. Occurrence of natural disasters significantly affects losses on insurance by instantaneously upsetting a lot of claimants.
Estimation of the insurance prices relating to the competitive market is designed by the models. The company’s market value is increased by arraigning a price higher than the competitive price and the vice versa. Financial dummies and financial worthiness are therefore significant information items at the disposal of insurers’ financial decisions making on tariff calendars and reinsurance terms of contract. Estimations of the risk market prices for the factors that are risky and the beta coefficients for insurance are required by the model. Comparably, there is a possibility of getting insurance models giving a price for the policy of the insurance such as default risk free thus relevant to this study as it was useful in strategic planning in pricing of the insurance policies.
2.2.4 The Resource-Based View
14
relational rent and competitive advantage. Alliance formation is perceived to offer synergies between firm skills, competencies and capabilities, in terms of resources that can be leveraged to offer competitive advantage. This competitive advantage can be realized in terms of cost leadership, differentiation or focus or a combination of these (Locket & Wild, 2014)
Duysters and Heimeriks (2007) observed that in order to successfully leverage on the synergies offered by its competitive partners, firms require skills, proficiencies and capabilities information of probable partners. The firm’s historical level of collaborative experience is seen as key in enabling the firm to identify potential partners that will offer maximum value added relationships. Penrose (2009) indicated that there are undeniable valuable resources at a particular point in an organization, useful for exploiting productive opportunities to allow the firm to grow successfully. Researchers have identified a variety of resources that create an exceptional advantage for a company by sharing them across businesses.
15 2.3 Empirical Review
This section covered existing literature on determinants of strategic drift and their relation to performance of insurance companies. It presented arguments by different studies on organizational culture, leadership, innovation, strategic planning and organization performance.
2.3.1 Organizational Culture and Performance of Insurance Companies
A study was done by Ojo (2008) who investigated the impact of organizational culture on the insurance companies’ performance in Nigeria. The study investigated the significance of the relationship between organizational culture and performance and stressed the importance of a robust employee-responsive culture. Collection of data was done using questionnaires and research hypotheses were tested using the chi-square method. Findings showed an organization culture and performance relationship and that an effectual performance results from a strong employee-responsive culture. Further, companies’ values and beliefs were incompatible with that of few employees. The study recommended putting in place proper machinery to bring about compatibility which will ensure unity of purpose.
16
Bashayreh (2014) did a study on culture of an organization and its influence on the performance of an organization whose focus was on the Jordanian insurance sector. The study examined the relationship between the culture of an organization’s dimensions and performance of an organization among insurance companies operating in the Jordan market. 240 randomly sampled respondents from the insurance companies partook in the study. Data was collected using survey questionnaires and analysis using descriptive and inferential statistics. Findings showed an insignificant relationship between stability and communication, expectations of an organization, development encouragement, behavioral styles and performance of the organization.
A study was conducted by Omondi (2014) on the impact of culture of an organization on employee performance on their jobs at Pacis Insurance Company Ltd. Self-administered questionnaire was the data collection tool and analysis was done using SPSS. Findings confirmed that alignment of a workforce that is committed with the pursuits, concepts and beliefs of an organization and helping employees participate towards the accomplishment of their purpose in the firm by the supervisors and management characterizes high performing organizations. The conclusion was that an organization with the culture which involves its employees has a tendency of performing well since the decisions made by the organization tend to be owned by the employees.
2.3.2 Leadership and Performance of Insurance Companies
17
performance management were done. Key performance indicators were suggested and factors of success for performance management in insurance companies.
Adeoye (2014) did a study on the effect of compensation management on the role of leadership of employees in insurance sector in Nigeria. Questionnaires were the data gathering tools. Analysis of data was conducted using SPSS where descriptive statistics and Pearson Product Moment Correlation was done. The study showed a positive relationship amongst the variables with a weak association r= 0.481 (48.1%). Additionally, compensation management affects leadership roles of the employee and leadership is a motivation to the employees to perform efficiently.
Hsu (2016) did a study on the relationships among transformational leadership, employees’ learning abilities, creativity and job performance in Taiwan insurance companies. Sample size was 209 salespersons from 10 insurance companies in Taiwan and Multifactor Leadership. Data was collected using questionnaire. Findings indicated that transformational leadership was positively related to employees’ learning abilities, employees’ learning abilities were positively related to their creativity, employee creativity was positively related to their job performance and employees’ learning abilities were positively related to their job performance.
2.3.3 Innovation and Performance of Insurance Companies
18
was insignificant. Further, operation processes and system innovations were statistically significant in explaining return on assets of insurance companies.
Gitau (2013) assessed the strategies adopted by Kenyan insurance companies in the alleviation of low insurance penetration. Data collection and analysis was conducted using questionnaires and SPSS respectively. Findings indicated that the linguistic in the legal documents creating an insight that much is in the concealed print is the key difficulty faced by the insurance companies in their products marketing. Additionally, there is unhealthy competition due to absence of creativity and innovations among insurance companies.
19
2.3.4 Strategic Planning and Performance of Insurance Companies
Irajpour and Zabihi (2015) did an examination on the impacts of strategic planning on private insurance firms’ performance in Iran. Data collection was by questionnaires and were analyzed using SPSS. Research results showed that the strategic process where strategic analysis tools are used and strategic issues are focused on affects the financial performance and that there is need for strategic planning and strategies emphasis. Liyai (2014) determined strategy and performance of British American insurance company Kenya limited. Interview Guides collected primary data and secondary data was extracted from existing published and unpublished records such as The AKI and IRA Annual Publications, Articles, related Journals, Electronic data and the company’s audited Financial Statements. The data collected was analyzed through the Content Analysis Technique. The results confirm to the findings of other past studies on the relationship between strategies adopted and effectively implemented and organization performance.
Gaitho (2015) conducted a study on the adoption of strategic planning practices that affect performance of UAP insurance company limited in Kenya. Primary source of data was used which was collected through interview guide. Key interviewees of the study included the underwriting manager, business development manager, customer service and the communications manager. Data was analyzed was by content analysis. Findings denoted that there exist strategic planning practices among them competitive pricing to set the premium amounts, controls that ensure high level of performance together with periodic evaluation that ensure UAP Insurance has improved performance.
20
performance was a strong positive one and the regression coefficients showed a positive and significant association between differentiation strategy and performance of insurance. Additionally, a strong and positive significant relationship was found between focus strategy and insurance performance.
2.4 Summary of Reviewed Literature and Research Gaps
Literature review in this study involved empirical review, theoretical framework and conceptual framework. Empirical review on the study variables was done to aid in the identification of the knowledge gaps. The conclusion that may be drawn from the reviewed literature is that the existing framework for analyzing performance of insurance companies is inadequate and therefore the effect of strategic drift on the performance of insurance companies in Nairobi City County, Kenya would help in explaining further the phenomenon of performance of insurance companies.
Several researchers have identified organizational culture, leadership, innovation and strategic planning as the main missing link in performance of insurance companies. Hence the need to continue with research endeavors, particularly in devolved governments in an attempt to obtain concrete evidence on the effect of strategic drift on performance of insurance companies.
Table 2.1: Summary of Reviewed Literature and Research Gaps Author and
year
Study focus Research findings
Research gaps Focus of the current study Moradi et al.,
(2013)
Effect of organizational culture on the performance of insurance firms
Organizational culture impacts competitive strategy directly and
organizational performance
The study failed to establish whether values and beliefs affects
performance of insurance firms
To establish how
organizational culture affects the
21
indirectly. companies in
Nairobi County, Kenya Hsu (2016) Relationships
among transformational leadership, employees’ learning abilities,
creativity and job performance
Transformational leadership was positively related to employees’ learning abilities.
The study did not focus on communication as a key aspect in leadership
To examine the effect of leadership on the
performance of insurance companies in Nairobi
County, Kenya.
Kiragu (2016) Effect of innovation on performance of insurance firms
No evidence was found for a significant relationship between market innovation and performance.
The study only focused on the effect market innovation
To find out how
innovation affects the performance of insurance companies in Nairobi
County, Kenya.
Gaitho (2015) Strategic planning practices
adopted by UAP insurance
Existence of strategic
planning
practices among them
The study used interviews as the only data collection
method
To assess how strategic
planning
22 company limited competitive
pricing to set the premium
amounts,
controls that ensure high level of performance
of insurance companies in Nairobi
County, Kenya.
Boadi et al., (2013)
Determinants of profitability of insurance
companies
Tangibility had a negative
relationship, there was a positive relationship between leverage, liquidity and profitability of insurance firms
The study only collected
secondary data on financial reports which is not be the only performance indicator in the insurance
companies
To assess the performance of insurance firms
2.5 Conceptual Framework
23
Independent Variables Dependent Variables
Figure 2.1: Conceptual Framework Source: Researcher, (2017)
Organizational Culture Values and
beliefs Mission Vision
Leadership
Decision making Communication Flexibility
Strategic Planning Formulation Implementation Analytical tools
Performance of Insurance companies
Market share Profitability Customer
satisfaction Innovation
24
CHAPTER THREE: RESEARCH METHODOLOGY 3.1 Introduction
This chapter comprises of the research design, target population, sampling procedure, sample size, data collection procedures, research instruments, data analysis and presentation and ethical considerations. It indicates the methods used in this study in the collection, analysis, presentation and exploration of the findings.
3.2 Research Design
Descriptive survey and explanatory research design were the research designs used. Descriptive survey design provides an inclusive account of actions, statuses and interfaces between individuals and things as indicated by Cooper and Schindler (2006). According to Kothari (2008), there is minimal biasness during data collection when research survey design is used and therefore the results can be inferred as the true representation of the population. An explanatory design indicates an attempt to connect ideas to understand causation, meaning researchers want to attempt to explain the relationship among the study variables (Saunders, et al., 2007). Explanatory research looks at how variables come together and interact (Babbie, 2007). Saunders, et al., (2007) observes that the explanatory design is best suited for gathering information where the researcher wants to elucidate a cause-effect relationship between independent and dependent variables in a post facto research study. Good explanatory researches effectively answer the ‘why’ questions in research (Shields & Rangarjan, 2013).
3.3 Target Population
25
advantage has been built by the companies and they are majorly involved in the daily running of the company.
Table 3.1: Target Population
Categories
Number of insurance firms in the categories
General
managers Total
Composite 11 1 11
Life 13 1 13
General
Business 25 1 25
Total 49 3 49
Source: AKI (2014)
3.4 Sample Size and Sampling Procedure
A census study was conducted and thus all the insurance companies were involved in the study. Since the population involved was not so large, the census was the best preferred method because it gives more accurate results (Mugenda & Mugenda, 2008). Sample size was 49 respondents. General managers of all the insurance companies were sampled purposively.
3.5 Data Sources and Collection
26 3.6 Validity and Reliability of Research Instrument 3.6.1 Pilot Test
A pilot test was done to assess for constancy and any faults in designing and in the development of the questionnaire before rolling out the main study. The pilot study helped in the identification of crucial information within the data sets. Questions attracting bias and unclear were corrected. The research instruments was pilot tested using a sample size of five (5) respondents who were randomly selected from the insurance companies as indicated by Mugenda and Mugenda (2008) who denoted that 1% to 10% of the actual sample size is successful for a pilot test.
3.6.2 Validity of Research Instrument
Validity infers to the correctness and significance of extrapolations based on the results of a research (Kothari, 2008). This study used face, content and constructs validity. Face validity deals with the subjective assessment of the research measuring instrument. This research depended on instruments that have been developed in other studies related to the current study and the concepts which were derived from suitable literature. Content validity is a measurement of the extent to which the instrument gives satisfactory coverage of the questions which guides the study. Construct validity investigates whether the individual scale items correctly operationalizes the study variables (Cooper & Schindler, 2006).
3.6.3 Reliability of Research Instruments
27
the internal consistency. A Cronbach’s coefficient alpha of 0.896 (89.6%) was gotten which indicated that the questionnaire was reliable.
Table 3.2: Reliability Statistics
Cronbach's Alpha
Cronbach's Alpha Based on
Standardized Items N of Items
.896 .901 23
Source: Field (2017)
3.7 Data Analysis and Presentation
Data analysis was conducted using SPSS software version 22. Descriptive (means, percentages, standard deviations and frequencies) and inferential statistics (linear regression) were conducted. Data was presented in form of graphs and tables.
A linear regression model was utilized to indicate the relationship between the study variables. The general model was as below
Y= βo + β1Χ1+ β2Χ2+ β3Χ3+ β4Χ4+ εo
Where: Y = Organizational Performance
β0 = Constant
β1 = Coefficients
Χ1 = Organization culture
Χ2 = Leadership
Χ3 = Innovation
28 εo= Error term
3.8 Ethical Considerations
29
CHAPTER FOUR: DATA ANALYSIS, PRESENTATION AND INTERPRETATION 4.1 Introduction
This chapter shows the response rate, demographic characteristics of the respondents, data analysis and discussion of strategic drift and its effect on the performance of insurance companies in Nairobi County, Kenya. Data analysis was done using SPSS with the guidance of the objectives.
4.2 Response Rate
The study population encompassed forty nine (49) insurance companies where a sample size of 49 general managers from all the insurance companies was purposively selected.
Figure 4.1: Response Rate of the Respondents Source; Field (2017)
Out the 49 questionnaires given to the respective respondents 43 of them were collected indicating a response rate of 88% (Figure 4.1). According to Mugenda and Mugenda (2008), a response rate of more than 50% is adequate for analysis. Further, Babbie (2007) indicated that
88% 12%
Response Rate of the Respondents
30
return rates of 50% are acceptable, 60% good and 70% very good for analysis and publishing. The response rate achieved in this study was very good.
4.3 Demographic Characteristics of the Respondents
This sub-sector includes the demographic characteristics evaluated which are the length of time the respondents have been in the insurance company, their highest education level and the type of premiums/ policies the insurance company offers.
4.3.1 Length of Time in the Insurance Company
The researcher sought to establish the length of time the respondents had worked for the insurance company.
Figure 4.2: Length of Time in the Insurance Company Source: Field (2017)
From the Figure 4.2 above, 36% of the respondents had worked 8-10 years, 32% for over 10 years, 21% for 4-7 years while 11% had worked for 0-3 years. Having about 68% of the respondents with a working experience of more than 8 years was advantageous to this study since the information given is reliable and at the same time, they have been in the company long
0 10 20 30 40
0-3 years 4-7 years 8-10 years Over 10 years 11 21 36 32 P e rc e n tage Years
31
enough to see how the company had survived through the business turbulence and able to avoid strategic drift.
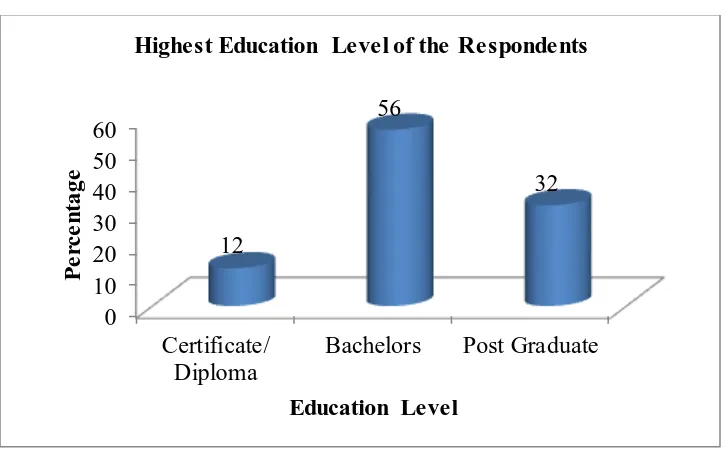
4.3.2 Highest Education Level of the Respondents
The researcher evaluated respondents’ highest education level.
Figure 4.3: Highest Education Level of the Respondents Source: Field (2017)
From the Figure 4.3 above, bachelors and post graduates were 56% and 32% respectively. Only 12% were certificate/ diploma holders. High education level is associated with the respondents having a clear understanding about the market and the ability to make decisions.
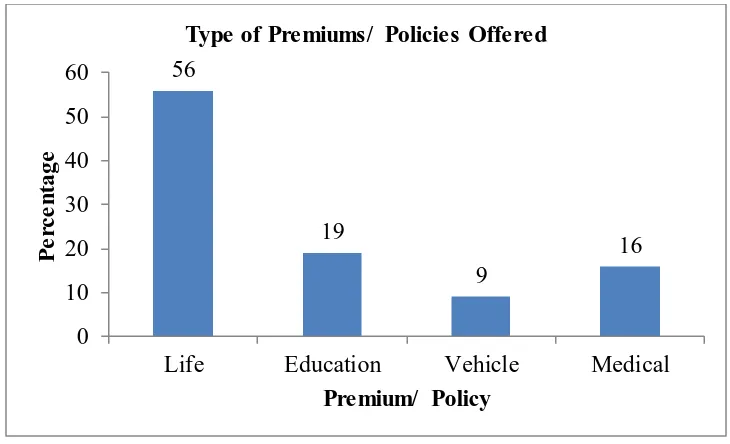
4.3.3 Type of Premiums/ Policies Offered
The researcher sought to establish from the respondents the premiums/ policies their companies mostly majored on.
0 10 20 30 40 50 60
Certificate/ Diploma
Bachelors Post Graduate 12
56
32
P
e
rc
e
n
tage
Education Level
32 Figure 4.4: Type of Premiums/ Policies Offered Source: Field (2017)
Results in Figure 4.4 above indicated that most insurance companies offered life premiums with 56%, 19% and 16% offered education and medical premiums respectively while only 9% offered vehicle premiums/ policies. The findings were in contradiction with those of Kiragu (2016) who found out that there was low focus on life insurance as compared to general insurance due to the fact that many Kenyans now prefer alternative investment products in the market that they believe offer higher returns than those offered under life insurance.
4.4 Descriptive statistics
Descriptive statistics provide simple summaries about variables and their measures and forms the basis of virtually every quantitative data analysis. The descriptive statistics of each of the study variables are presented below. In this study, the respondents were to denote their agreement level on different aspects of organization culture, leadership, innovation, strategic planning and organization performance of insurance companies ranging from strongly disagree to strongly agree. 56 19 9 16 0 10 20 30 40 50 60
Life Education Vehicle Medical
P e rc e n tage
33
4.4.1 Organization Culture and Performance of Insurance Companies
The researcher asked the respondents whether organization culture important in any insurance company and if organization culture of any insurance company determines whether the mission and vision (objectives) are achieved.
Table 4.1: Descriptive Statistics for Organization Culture
Organization Culture Indicators N Min Max Mean
Std. Deviation There are common values in our insurance
company
43 1.00 5.00 3.58 1.03
Core values of the insurance company are well adhered to by management and all staff
43 2.00 5.00 3.84 0.84
The management of the company is committed to the company's vision
43 2.00 5.00 4.26 0.90
The mission of the insurance company has been communicated to the employees clearly
43 2.00 5.00 4.35 0.95
Valid N (listwise) 43 4.01
Source: Field (2017)
34
management of the company is committed to the company's vision had an average of 4.26 and an SD of 0.90. Results indicated that all the respondents agreed that organization culture was important and that it was a determinant in the achievement of the organization’s mission and vision. Lowest mean of 3.58 and an SD was obtained from having common values in our insurance company. The mean score of 4.01 indicated a strong agreement that organization culture affects organization performance of insurance companies.
Bronn (2001) indicated that management commitment which is made visible through the company’s vision becomes the driver of all successive decisions which surround its implementation ensuring that decision making is done when both the company’s and everybody else’s interest are considered. Additionally, Ojo (2008) found out that a robust employee-responsive culture leads to efficient performance which the study findings agreed with.
4.4.2 Leadership and Performance of Insurance Companies
35 Table 4.2: Descriptive Statistics for Leadership
Leadership Indicators N Min Max Mean
Std. Deviation There is centralized decision making
in all matters concerning this company
43 3.00 5.00 4.33 0.75
All the decisions made by the management affecting the staff are communicated timely
43 2.00 5.00 3.98 0.91
There is effective communication within the management then to all subordinates
43 2.00 5.00 3.95 0.92
There is flexibility in the management in response to the changing external environment
43 2.00 5.00 3.84 1.02
Valid N (listwise) 43 4.03
Source: Field (2017)
36
A study by Eriksson and Gustavsson (2013) found out that there is need for a centralized decision making in multi organizations which allowing allowing control for uniformity creation and achievement of the goals set. Majtan (2001) found out that management’s key function is to make decisions which bring or take the needed change and thus need for timely communication to the employees acting as a source of motivation towards achieving the targets.
4.4.3 Innovation and Performance of Insurance Companies
37 Table 4.3: Descriptive Statistics for Innovation
Innovation Indicators N Min Max Mean
Std. Deviation Innovative products have the ability of
attract diverse consumers with varied needs
43 3.00 5.00 4.33 0.71
Innovative insurance products have high success chances regardless of the insurance firm that launches the product
43 2.00 5.00 4.23 0.84
The setting up of branches in different regions ensures that the reach of insurance is wide
43 3.00 5.00 4.21 0.74
Development of multiple distribution channels for insurance is considered a smart way of doing business
43 3.00 5.00 4.12 0.70
Process innovation achieves business process re-engineering
43 2.00 5.00 4.16 0.99
Process innovation has the ability to cut down on operational costs
43 2.00 5.00 3.95 0.97
Valid N (listwise) 43 4.17
Source: Field (2017)
38
the ability of attract diverse consumers with varied needs obtained a high average of 4.33 and an SD of 0.71 and that innovative insurance products have high success chances regardless of the insurance firm that launches the product which had an average of 4.23 and an SD of 0.84. The mean score of 4.17 indicated high level of agreement that innovation affects organization performance of insurance companies.
The results agree with Camison and Lopez (2010) who found that product innovation is lauded for retaining and growing the competitive position of a firm. Further, the study established that process innovation has the ability to cut down on operational costs as depicted by Hippel (2005) and Kiragu (2016) whose study showed that process innovation cut down on operational costs.
4.4.4 Strategic Planning and Performance of Insurance Companies
39
Table 4.4: Descriptive Statistics for Strategic Planning
Strategic Planning Indicators N Min Max Mean
Std. Deviation During formulation of strategic plans
in the company, views of all staff are considered
43 3.00 5.00 4.49 0.70
Implementation of strategic plans is done as per the set timelines
43 3.00 5.00 4.33 0.78
Strategic analytical tools are used in the company to ensure that strategic plans put in place are achieved
43 3.00 5.00 4.30 0.74
Valid N (listwise) 43 4.37
Source: Field (2017)
The respondents were to denote their agreement level on the several indicators of strategic planning. The survey established that during formulation of strategic plans in the company, views of all staff are considered had the highest average of 4.49 and an SD of 0.70. Additionally, the survey found out that implementation of strategic plans is done as per the set timelines had an average of 4.33 and an SD of 0.78. The mean score of 4.37 indicated a strong agreement that strategic planning affects organization performance of insurance companies.
40
(2015) who found that strategic process where strategic analysis is used as the analysis tool and strategic issues are focused, performance of organizations is affected.
4.4.5 Organization Performance
Organization performance indicators were given and respondents’ agreement level was sought. Table 4.5: Descriptive Statistics for Organization Performance
Organization Performance
Indicators N Min Max Mean
Std. Deviation
Market share 43 3.00 5.00 4.21 0.68
Sales and profitability 43 3.00 5.00 4.37 0.72 Customer satisfaction 43 3.00 5.00 4.44 0.73
Valid N (listwise) 43 4.34
Source: Field (2017)
41 4.5 Inferential statistics
Inferential statistics makes inferences about a population from information taken from a small sample of that population. They are crucial in social sciences research since they allow generalization of results to a larger population.
4.5.1 Regression Analysis
To test the relationships on the independent and dependent variables, the organizational culture, leadership, innovation and strategic planning were regressed against performance of insurance companies. The findings are presented in the sections that follow
Table 4.6: Model Summary
Model R R Square
Adjusted R Square
Std. Error of the Estimate
1 .875(a) .765 .749 .22432
Predictors: (Constant), Organization Culture, Leadership, Innovation and strategic planning Source: Field (2017)
According to the direct relationship model applied in this study, Adjusted R Square was 0.749 which implies that the independent variables studied explain 74.9% of the changes in organization performance among insurance companies in Kenya. This implies that 25.1% of the variability in organization performance is a contribution of other variables not examined in this study. The adjusted R-square is used instead of the R-squared as it takes care of the adjustments in the degrees of freedom.
42
As shown in Table 4.7, the ANOVA results which assessed the overall significance of the regression model indicated that it was significant. At 5% level of significance, F calculated was 48.832 and the p value was 0.000 < 0.05 confirming the significance of the overall model. Table 4.7: ANOVA
Model
Sum of
Squares Df Mean Square F Sig.
1 Regression 7.372 3 2.457 48.832 .000
Residual 2.264 45 .050
Total 9.636 48
a. Predictors: (Constant), Organization Culture, Leadership, Innovation and strategic planning b. Dependent Variable: Organization Performance
Source: Field (2017)
Regression coefficients are shown in Table 4.8 below. Table 4.8: Table of Coefficients
Model
Unstandardized Coefficients
Standardized Coefficients
B Std. Error Beta t Sig.
1 (Constant) 5.359 1.172 4.571 .000
Organization Culture -0.377 0.128 -0.464 -2.946 0.005
Leadership -0.074 0.131 -0.085 -0.563 0.577
Innovation 0.030 0.169 0.026 0.180 0.858
Strategic Planning 0.152 0.144 0.161 1.056 0.298 a. Dependent Variable: Organization Performance
43
The model showed a statistically significant negative relationship between organization culture (β= -0.377, t= -2.946, p<0.05) and organization performance, a statistically insignificant negative relationship between leadership (β= -0.074, t= -0.563, p>0.05) and organization performance. Additionally, there was an insignificant positive relationship between innovation (β= 0.030, t= 0.180, p>0.05) and organization performance was found and an insignificant positive relationship between strategic planning (β= 0.152, t= 1.056, p>0.05) and organization performance.
From the regression model, the following regression equation was derived: Y = 5.359 - 0.377X1 - 0.074X2 + 0.030X3+ 0.152X4
The regression results indicated that strategic planning had a beta coefficient of 0.152, this is in agreement with Arasa and K’ Obonyo (2012) who indicated that there exists a strong relationship between strategic planning and organizational performance, followed by innovation with a beta coefficient of 0.030 agreeing with Karabulut (2015) who indicated that innovation makes organizations improve their customer performance and learning and growth performance, then leadership with -0.074 which is in contradiction with findings of Edoka (2012) who found a positive and significant relationship between effective leadership and organizational performance and organization culture with a beta coefficient of -0.377 which contradicts with Zakari et al. (2013) who found a positive relationship between organizational culture and performance.
44
45
CHAPTER FIVE: SUMMARY OF FINDINGS, CONCLUSIONS AND RECOMMENDATIONS
5.1 Introduction
This chapter is a presentation of the summary of the findings of this study and provides conclusion and recommendations based on the findings. The study sought to examine the strategic drift and its effect on the performance of insurance companies in Nairobi County, Kenya. The researcher conducted a survey to find out how organization culture, leadership, innovation and strategic planning affected organization performance.
5.2 Summary of Findings
According to Dwyer & Edwards (2009), strategic drift is a strategic management concept which refers to an organization’s response when going through a changing business setting. When developing strategies that may bring changes in an organization, different unexpected challenges and situations may arise. Today’s business setting in Kenya is dynamic, stormy and unpredictable. Additionally, there has been a sequence of changes through reforms in finances, advancement in ICT, financial services globalization and development in the economy (AKI Report, 2014). These alterations have had a significant effect on efficacy, productivity and structure of the market and giving rise to a business setting that is highly competitive affecting the insurers’ performance (Gitau, 2013). Therefore the researcher aimed at evaluating strategic drift and its effect on the performance of insurance companies in Nairobi County, Kenya.
46
insurance companies in Nairobi County, Kenya, finding out how innovation affects the performance of insurance companies in Nairobi County, Kenya and assessing how strategic planning affects the performance of insurance companies in Nairobi County, Kenya.
The first objective was to establish how organizational culture affects the performance of insurance companies in Nairobi County. Results indicated that the mission of the insurance company has been communicated to the employees clearly had the highest mean while having common values in our insurance company had the lowest mean. The mean score of 4.01 indicated a strong agreement that organization culture affects organization performance of insurance companies. Findings showed a statistically significant negative relationship between organization culture and organization performance.
The second objective was to examine the effect of leadership on the performance of insurance companies in Nairobi County, Kenya. The survey established that having a centralized decision making in all matters concerning the company obtained the highest mean. Moreover, there is need that all the decisions being made by the management affecting the staff be communicated timely. The mean score of 4.03 indicated a strong agreement that leadership affects organization performance of insurance companies. There was a statistically insignificant negative relationship between leadership and organization performance.
47
of agreement that innovation affects organization performance of insurance companies. There was an insignificant positive relationship between innovation and organization performance.
The fourth objective of the study was to assess how strategic planning affects the performance of insurance companies in Nairobi County, Kenya. The survey established that during formulation of strategic plans in the company, views of all staff are considered had the highest mean. Additionally, the survey found out that implementation of strategic plans is done as per the set timelines was found a key strategic planning indicator. The mean score of 4.37 indicated a strong agreement that strategic planning affects insurance companies’ performance. There was an insignificant positive relationship between strategic planning and organization performance.
5.3 Conclusions
The study concluded that organizational culture is a key strategic drift indicator that affects performance of insurance companies as it was found to significantly affect organization performance. Leadership, innovation and strategic planning were insignificant strategic drift indicators affecting the performance of insurance companies in Nairobi City County. The management of insurance companies should therefore consider organizational culture for their companies to improve customer satisfaction and profitability and increase their market share. 5.4 Recommendations
The following recommendations were made to assist the management of insurance companies to improve their performance relative to the strategic drift.
48
ii. Insurance companies’ leadership should ensure that there is centralized decision making in all matters concerning the company which will help in enabling achievement of the set targets.
iii. Since innovative products have the ability of attract diverse consumers with varied needs and high success chances regardless of the insurance firm that launches the product, insurance companies should encourage innovation of new products.
iv. There is need for consideration of all the views of all staff during formulation of strategic plans in the company
5.5 Areas for Further Research
49
REFERENCES
Adeoye, A. O. (2014). The Influence of Compensation Management on Employee’s Leadership Role in Insurance Sector: Nigeria Experience. Mediterranean Journal of Social Sciences, 5(27), 342-352
AKI Report (2014). Association of Kenya Insurers.
Arasa, R., & K’ Obonyo, P. (2012). The Relationship between Strategic Planning and Firm Performance. International Journal of Humanities and Social Science, 2(22), 201-213
Arthur, J. (1994). Effects of Human Resource Systems on Manufacturing Performance and Turnover. Academy of Management Journal, 37(4), 670-687.
Auster, E., & Choo, C. W. (2009). How senior managers acquire and use information in environmental scanning. Information Processing and Management Journal,30, 67-85. Augustine, U., & Nwanneka, N. J. (2011). Repositioning Insurance Industry for Operational
Efficiency: The Nigerian Case. Journal of Applied Finance & Banking, 1(3), 15-32 Babbie, E. (2007). The Practice of Social Research, (11th Ed.), Belmont CA: Thompson –
Wadsworth
Barney, J. B. (1991). Firm Resources and Sustained Competitive Advantage. Journal of Management, 17(1), 99-120
Bashayreh, A. M. (2014). Organizational Culture and Effect on Organizational Performance; Study on the Jordanian Insurance Sector. International Journal of Knowledge and Systems Science, 5(2), 35-48
50
Borg, W. R. & Gall, M. D. (1989). Educational Research: An Introduction (5th. ed). New York: Longman.
Boromo, J. O. (2015). Determinants of Financial Performance for Life Insurance Companies in Kenya. Unpublished Project University of Nairobi
Bron, P. S. (2001). Corporate Mission as a Driver of Corporate Social Responsibility. Norwegian School of Management
Burgelman, R. A., & Grove. A. S. (1996). Strategic Dissonance. California Management Review, 38 (2), 8-28
Camison, C., & Villar, L. A. (2010). An Examination of the Relationship between Manufacturing Flexibility and Firm Performance: The Mediating Role of Innovation. International Journal of Operations & Production Management, 30(8), 853-878.
Chang, T., & Chuang, S. (2009). Performance Effects of Knowledge Management: Corporate Management Characteristics and Competitive Strategy Enablers. Asian Journal of Management and Humanity Sciences, 4(4), 181-199.
Collier, R. B., & Collier, D. (1991). Shaping the Political Arena: Critical Junctures, the Labor Movement, and Regime Dynamics in Latin America. Princeton: Princeton University Press.
Constable, M., & McCormick, F. (2009). Market Orientation and Company Profitability: Further Evidence Incorporating Longitudinal Data. Australian Journal of Management, 25(2), 173-99.