Electronic Thesis and Dissertation Repository
5-30-2018 9:00 AM
Examining motor unit stability of first dorsal interosseous (FDI)
Examining motor unit stability of first dorsal interosseous (FDI)
and biceps brachii (BB) muscles in healthy and older adults using
and biceps brachii (BB) muscles in healthy and older adults using
decomposition-based quantitative electromyography (DQEMG)
decomposition-based quantitative electromyography (DQEMG)
Igor Angelovski
The University of Western Ontario
Supervisor
Timothy John Doherty
The University of Western Ontario Graduate Program in Neuroscience
A thesis submitted in partial fulfillment of the requirements for the degree in Master of Science © Igor Angelovski 2018
Follow this and additional works at: https://ir.lib.uwo.ca/etd
Part of the Other Neuroscience and Neurobiology Commons
Recommended Citation Recommended Citation
Angelovski, Igor, "Examining motor unit stability of first dorsal interosseous (FDI) and biceps brachii (BB) muscles in healthy and older adults using decomposition-based quantitative electromyography (DQEMG)" (2018). Electronic Thesis and Dissertation Repository. 5406.
https://ir.lib.uwo.ca/etd/5406
This Dissertation/Thesis is brought to you for free and open access by Scholarship@Western. It has been accepted for inclusion in Electronic Thesis and Dissertation Repository by an authorized administrator of
Abstract
Aging of the human neuromuscular system is associated with gradual decline in motor
unit (MU) number leading to denervation of muscle fibers and subsequent compensatory
reinnervation from surviving MUs. Lower limb muscles exhibit age-related increased
MU instability (measured electrophysiologically), however not much is known regarding
MU stability of aging upper limb muscles. The purpose of this study was to examine
age-related MU loss in upper limb muscles (first dorsal interosseous [FDI] and biceps brachii
[BB]) and the impact on MU stability in younger and older healthy subjects using
electrophysiological near fiber analysis from decomposition-based quantitative
electromyography (DQEMG). FDI and BB muscles from older (74 ± 5 years) and
younger (31 ± 13 years) healthy subjects were examined through surface and
intramuscular collection of EMG signals during volitional contractions, which were
analyzed with DQEMG. Older subjects showed significantly larger MUs associated with
greater instability in the form of near fiber (NF) jiggle and NF jitter in the FDI and BB
muscles when compared to younger controls. These results suggest that age-dependent
MU remodeling and progressive reduction in FDI and BB MU pools are associated with
greater transmission instability at the neuromuscular junction.
Keywords
Acknowledgments
I would like to thank my supervisor, Timothy Doherty, for his invaluable
guidance and unwavering support in the progress and completion of this project. It has
truly been a pleasure sharing my graduate years with his enduring charisma and expertise
that any student could only appreciate.
My utmost gratitude is expressed as well for my advisory committee members,
Charles Rice and Brian Allman, who have provided sensible feedback and practical
suggestions for presenting my thesis and achieving overall academic fulfilment.
I am grateful for fellow lab members, Neal McKinnon and Shannon Davidson, for
their useful insight and cooperative participation in the research environment.
Much thanks to Kevin Gilmore for his help in elucidating data analysis
procedures used in this project.
I am highly appreciative of all subjects who consented to be involved in this study
Table of Contents
Abstract . . . i
Acknowledgments . . . ii
Table of Contents . . . .iii
List of Tables . . . .vi
List of Figures . . . .vii
List of Appendices . . . .ix
List of Abbreviations . . . x
Chapter 1 Literature review . . . .1
1.1 Overview . . . .1
1.2 The motor unit . . . 2
1.2.1 Motor unit anatomy . . . 2
1.2.2 Motor unit physiology . . . 3
1.2.3 The neuromuscular junction . . . .5
1.3 Aging of the motor unit . . . .6
1.3.1 Sarcopenia . . . .6
1.3.2 Animal studies of aging . . . 9
1.3.3 Human aging and motor unit loss . . . .11
1.4 Quantitative electromyography . . . .16
1.4.1 MUP analysis . . . 16
1.4.2 MUNE analysis . . . .18
1.4.3 Jiggle and jitter analysis . . . 21
1.4.4 Near fiber analysis . . . 24
1.5 The first dorsal interosseous and biceps brachii muscles . . . .25
1.6 Study objectives . . . 27
Chapter 2 Introduction . . . .29
Chapter 3 Methods . . . .32
3.1 Participants . . . 32
3.2 Muscle strength grading . . . 32
3.3 Needle EMG data acquisition . . . .33
3.4 EMG signal analysis . . . .39
3.5 Stability analysis . . . .44
3.6 Statistics . . . 47
Chapter 4 Results . . . .48
4.1 Muscle strength values . . . 48
4.2 FDI MUP and stability values . . . .50
4.3 BB MUP and stability values . . . 53
4.4 S-MUP distribution . . . .56
4.5 Correlations with stability . . . .59
Chapter 5 Discussion . . . .66
5.1 Muscle strength results . . . .67
5.2 CMAP results . . . 67
5.3 S-MUP results . . . .68
5.4 MUNE results . . . .69
5.5 Motor unit stability results . . . 70
5.6 Limitations . . . 73
5.7 Future directions . . . .74
5.8 Conclusion . . . 75
References . . . .76
Appendices . . . 84
List of Tables
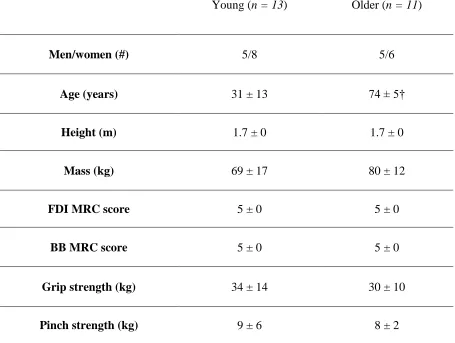
Table 1: Subject characteristics and muscle strength values in young and older subject groups . . . 49
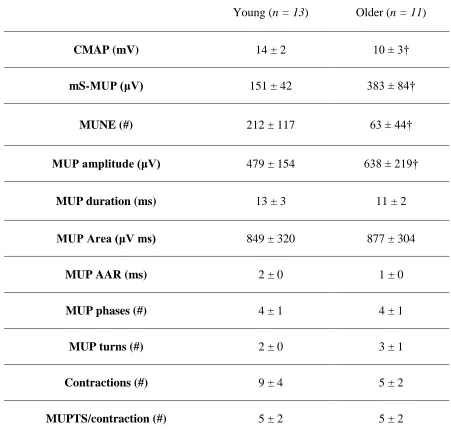
Table 2: Electrophysiological MUP values for the first dorsal interosseous (FDI) muscle in young, and older subject groups . . . .51
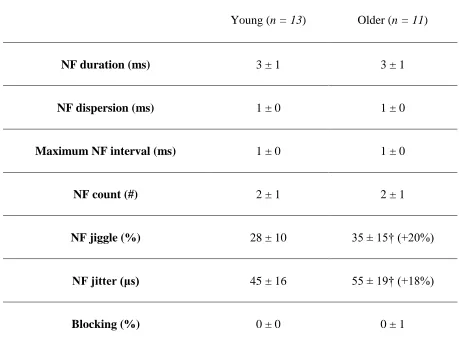
Table 3: Electrophysiological near fiber (NF) stability values for the first dorsal
interosseous (FDI) muscle in young and older subject groups . . . .52
Table 4: Electrophysiological MUP values for the biceps brachii (BB) muscle in young and older subject groups . . . .54
List of Figures
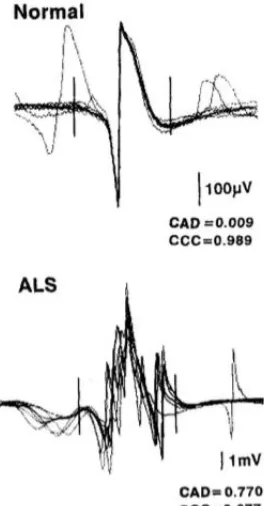
Figure 1: Schematic representing the significantly increased shape variability or jiggle in an ALS patient. . . .23
Figure 2: Intramuscular recording of FDI muscle from a younger subject during a
submaximal voluntary contraction . . . 36
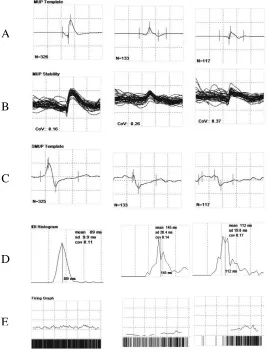
Figure 3: Summary screen displaying MUP template (A), shimmer plot (B), S-MUP template (C), IDI histogram (D), and firing graph (E) from sampled MUs in an FDI contraction . . . .38
Figure 4: Raster plots for two MUP trains algorithmically classified as distinct MUs from one voluntary FDI contraction . . . 40
Figure 5: Motor unit potential (MUP) template and corresponding spike-triggered surface motor unit potential (S-MUP) sampled from the FDI . . . 41
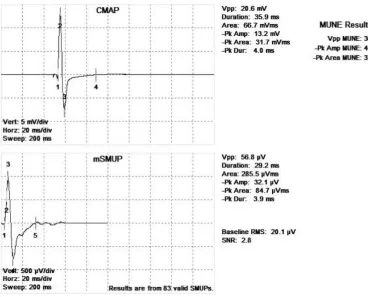
Figure 6: Compound muscle action potential (CMAP) and motor unit number estimate (MUNE) for the biceps brachii (BB) of a younger subject . . . .43
Figure 7: Near fiber (NF) MUP acceleration templates from the FDI muscle of a younger (A) and older (B) subject . . . 46
Figure 8: Frequency distribution of SMUPs from the first dorsal interosseous muscle (FDI) muscle of young subjects . . . 57
Figure 9: Frequency distribution of SMUPs from the first dorsal interosseous (FDI) muscle of older subjects . . . 57
Figure 10: Frequency distribution of SMUPs from the biceps brachii (BB) muscle of young subjects . . . .58
Figure 11: Frequency distribution of SMUPs from the biceps brachii (BB) muscle of older subjects . . . 58
Figure 12: Relationship between NF jiggle and SMUP amplitude in the first dorsal
interosseous (FDI) muscle of young and older subjects . . . .60
Figure 13: Relationship between NF jitter and SMUP amplitude in the first dorsal
interosseous (FDI) muscle of young and older subjects . . . .61
Figure 15: Relationship between NF jitter and MUNE in the first dorsal interosseous (FDI) muscle of young and older subjects . . . 63
Figure 16: Relationship between NF jiggle and SMUP amplitude in the biceps brachii (BB) muscle of young and older subjects . . . .64
List of Appendices
Appendix A: Research ethics board approval for current study . . . 84
List of Abbreviations
AAR: Area to amplitude ratio
ACh: Acetylcholine
ALS: Amyotrophic lateral sclerosis
BB: Biceps brachii
CMAP: Compound muscle action potential
CNS: Central nervous system
DE-STA: Decomposition-enhanced spike-triggered averaging
DQEMG: Decomposition-based quantitative electromyography
EMG: Electromyography
FDI: First dorsal interosseous
IDI: Inter-discharge interval
MFAP: Muscle fiber action potential
MN: Motor neuron
MRC: Medical Research Council
MU: Motor unit
MUNE: Motor unit number estimate
MUP: Motor unit potential
MUPT: Motor unit potential train
MuSK: Muscle-specific kinase
mS-MUP: mean surface motor unit potential
NF: Near fiber
NMJ: Neuromuscular junction
PNS: Peripheral nervous system
S-MUP: Surface motor unit potential
Chapter 1
1
Literature review
1.1
Overview
Neuromuscular function depends upon the excitation of motor neurons and the
skeletal muscle fibers they innervate in order to initiate appropriate muscle contraction
during voluntary and reflex movement. The motor neuron, it’s myelinated axon, and the
group of muscle fibers innervated by that axon via the neuromuscular junction comprise
the motor unit (MU). The MU is the basic functional component of the motor system and
determines the efficacy of whole muscle contraction based on their firing characteristics
when activated as well as their organization within the muscle.
As a result of the normal aging process, there is marked loss of motor units caused
by age-dependent variables such as accumulation of reactive oxygen species (that stress
the mitochondria of energetically-demanding motor neurons) resulting in denervation of
muscle fibers, many of which degenerate as a result of the loss of their parent motor
neuron. However, a compensatory motor unit remodeling process of reinnervating
remaining denervated muscle fibers (through their incorporation into surviving motor
units by sprouting collateral axons) attempts to mitigate the consequential decline in
muscle mass and strength often referred to as sarcopenia. Electrophysiological measures
of motor unit and muscle fiber potential characteristics, and in particular, those that
examine transmission stability (jiggle and jitter) aid in assessing the viability of
mechanisms and impact of sarcopenia in various muscle groups. This overview will
highlight the basics of motor unit and neuromuscular junction physiology, biological
consequences of normal aging in humans and animal studies, and electrophysiological
parameters and techniques for analyzing the underlying features associated with aging of
the MU.
1.2
The motor unit
1.2.1 Motor unit anatomy
Neurons are highly specialized cells involved in electrochemical signaling for
information transmission throughout the human body. These electrically excitable,
fundamental processing units of the nervous system receive ion gradient impulses in their
branched, antenna-like structures known as dendrites. In the peripheral nervous system
(PNS), specialized efferent neurons will then transfer this electrical signal down long
processes called axons (usually grouped into mixed nerves along with afferent sensory
nerve axons) for the release of chemical neurotransmitters into the surrounding
extracellular space termed the synaptic cleft. In motor neurons (MNs), which initiate
body movement, this cleft is known as the neuromuscular junction (NMJ), where
acetylcholine (ACh) is the neurotransmitter that binds to the post-synaptic receptors on
target muscle endplates. This triggers muscle fiber excitation and subsequent muscle
contraction through the interaction of myosin heads attaching to actin filaments of the
sarcomere contractile apparatus. This process is true of all lower MNs, which are situated
in the anterior horn of the spinal cord and brainstem and are activated by upper MNs of
and rubrospinal tracts, both of which are important for distal fine motor control) or from
afferent input from the periphery. These specialized cells project their axons in the PNS
to the muscle fibers they innervate to effect voluntary motion through skeletal muscle
contraction. Therefore, the MU is a functional unit comprised of the motor neuron, its
myelinated axon and varying numbers of innervated muscle fibers and is designated as
the final common pathway (Sherrington, 1929) underlying all voluntary and reflex
muscle contraction.
1.2.2 Motor unit physiology
The motor unit is composed of the motor neuron, motor axon, and the population
of muscle fibers supplied by the axon. During voluntary muscle contraction, it was noted
in classical early studies that motor units of smaller size tended to be recruited earlier,
while larger motor units, with more muscle fibers, entered contraction later as intensity
increased (Denny-Brown and Pennybacker, 1938). This pattern of motor unit recruitment
was later established as a physiological phenomenon in mammalian neuromuscular
function, termed Henneman’s size principle of orderly MU recruitment, whereby
activation of additional motor neurons during increasing contractile intensity was based
on their somatic and dendritic size (Henneman, 1957). Additionally, MUs can be
activated with increasing impulse frequency in a phenomenon termed rate coding. In
humans, initial sustained discharge frequencies of MUs are between 7-10 Hz. During
ramp contractions of increasing force, the discharge frequencies of these earliest recruited
MUs increase resulting in increased force contribution. Subsequent increases in force
result from a combination of recruitment and rate coding with human MUs firing at
Further studies examining mean innervation ratios (number of muscle fibers per motor
unit) revealed that relative motor unit size was in part dependent upon the size of the
muscle it comprises, since MU innervation ratios tend to be much higher on average in
larger muscles like the gastrocnemius than in comparatively smaller muscles (e.g.
extraocular muscles) (Feinstein et al., 1955). It is suggested that this disparity in the
number of muscle fibers innervated per motor unit across muscles of varying size may be
related to requirement of fine motor control in smaller muscles, such as intrinsic hand
muscles, whereby a higher number of MUs is observed relative to their mass, in larger
muscles where power generation or control of posture are more important functionally
(Doherty et al., 1995).
In general, motor units are classified according to their metabolic strategy as well
as by their contraction speed. Type I MUs with constituent slow-twitch fibers express a
significant quantity of oxidative enzymes (Buchthal and Schmalbruch, 1980), contracting
under aerobic conditions for a longer period of time than fast-twitch muscle fibers
comprising type II MUs, which contract under anaerobic conditions revealing a
significant proportion of glycolytic enzymes (Burke et al., 1973). Intermediate type IIA
MUs express high levels of both aerobic and anaerobic enzymes. Typically, human
muscles tend to exhibit heterogeneous populations of both motor unit subtypes and fiber
type distribution, with some exception such as the type I fiber-dominant soleus and type
1.2.3 The neuromuscular junction
Also known as the neuromuscular synapse, the neuromuscular junction is the site
of release of quanta of acetylcholine from the motor neuron terminal to its corresponding
acetylcholine receptor on a muscle fiber endplate within the muscle fibers of a given
motor unit (Dale et al., 1936). Transmission at the neuromuscular junction, from axonal
electrochemical signaling to muscular excitation allowing for muscle contraction and
movement, is initiated by the arrival of a motor neuron action potential at the axon
terminal, causing an increased local intracellular concentration of calcium ions (Baker,
1977). This chemical gradient causes acetylcholine vesicle release from the presynaptic
terminal for diffusion into the neuromuscular synaptic cleft (Silinsky, 1985).
Acetylcholine receptors expressed on the muscle fiber membrane or endplate have two
binding sites for the ACh neurotransmitter, which when bound successfully, generates a
local sub-threshold depolarization known as an end-plate potential at the muscle
membrane (Fatt and Katz, 1951). Once the end-plate potential exceeds threshold and
produces an action potential for propagation along the muscle fiber, the active contraction
of muscle tissue occurs as a result of the release of calcium from the sarcoplasmic
reticulum initiating coupling of actin and myosin. However, for successive transmission
and subsequent contraction to occur via the neuromuscular junction, unbound
acetylcholine within the synapse is catabolized by the synaptic enzyme
acetylcholinesterase to acetyl coenzyme A and choline (the latter of which is actively
transported back into the presynaptic nerve terminal), in addition to reuptake of ACh
1938; Taylor, 1991). This process of excitation-contraction coupling across the
ACh-mediated neuromuscular junction provides the basis for effective MU function.
1.3
Aging of the motor unit
1.3.1 Sarcopenia
Sarcopenia describes the process by which skeletal muscle shows a decline in
both mass and strength as a consequence of the normal aging process (Rosenberg 2011;
Doherty, 2003). Progressive decreases in muscle mass and strength beginning as early as
the 4th decade (Marcell, 2003) as well as reduced power output eventually result in
reduced mobility and loss of functional independence (McKinnon et al., 2017). Muscular
atrophy and frailty associated with sarcopenia is influenced by changes in hormone
secretion, inadequate nutrition, inflammatory mediators and in particular, changes in
innervation of the peripheral and central nervous systems (Doherty, 2003). Although the
exact mechanisms that contribute to the development of sarcopenia remain to be
identified, it has been well-established that skeletal muscle fiber loss (Lexell, Taylor and
Sjöström, 1988) as well as decreased cross-sectional area of surviving muscle fibers
(Aniansson et al., 1986) occurs. Several possible biological scenarios are likely to yield
the functional consequences of sarcopenia, which include increasing sedentary lifestyle,
downregulation in protein production, altered hormonal expression, increased
neuromuscular denervation rate, in addition to greater turnover of apoptotic cells (Pollack
and Leeuwenburgh, 2001). Secondary to decreased muscle mass, strength loss due to
total cross-sectional area of muscle from 20 to 60 years of age shows a roughly 40%
decline (Doherty, 2003).
In addition to losses in muscle mass, aging has been associated with gradually
more ineffective elimination of faulty proteins within muscle tissue, possibly accounting
for the observed greater reduction in strength than losses of muscle mass alone can
account for; so called decrease in muscle quality. For example, it has been discovered
that expression of the autocrine factor myostatin, which is involved in inhibition of
muscle development (McPherron, Lawler and Lee, 1997), is up-regulated in type II
glycolytic skeletal muscle fibers (Lexell and Downham, 1992), which are thought to be
preferentially targeted by age-related muscle loss.
Despite these multiple potential mechanisms, survival of muscle fibers in
response to aging is thought to be largely dependent upon their regular activation by
corresponding motor neurons, whose number has been shown to decline significantly
beyond the 7th decade. This progressive loss of MUs results in progressive cycles of
denervation and reinnervation, and eventually loss of muscle fibers as reinnervation
cannot keep pace with denervation (McKinnon et al., 2017). Additionally, lower motor
neuron loss in older adults is associated with decreased myelination of mainly
fast-conducting axons through Schwann cell reduction, which contributes to significantly
diminished motor nerve conduction velocity (Doherty et al., 1993; Rivner et al., 2001) in
part related to increased intermodal distance (Delbono, 2003; Jang and Van Remmen,
2011). Muscle biopsy studies provide evidence for neural factors due to MU loss as a
numbers of angulated muscle fiber morphology (typical of denervation) and greater fiber
type grouping (secondary to collateral reinnervation) have been observed in multiple
studies (Brown and Hasser, 1996; Lexell and Downham, 1992). Such age-associated MU
remodeling has the most pronounced impact on type II muscle fibers, with greater loss of
type II fibers and more substantial decreases in cross-sectional area, in comparison to
type I fibers. (Lexell, Taylor and Sjöström, 1988; Grimby et al., 1982; Larsson, Grimby,
and Karlson, 1979).
Aged skeletal muscle has also been shown to exhibit higher rates of mitochondrial
DNA mutation in individual muscle fibers of both rats and nonhuman primates (Bua et
al., 2002; Lopez et al., 2000), with older human subjects also displaying higher genetic
alterations when compared with younger individuals (Wang, Michikada and Mallidis,
2001). This observation could describe why long-term accumulation of mitochondrial
reactive oxygen species throughout life may increase vulnerability of
energetically-demanding motor neurons and fast-twitch muscle fibers to apoptosis. In response to
aging, muscle fibers exhibit marked histological changes in their morphology which
contribute to gradual decline in neuromuscular function. Such features as variation in the
size of fibers in addition to grouping of neighbouring fibers of the same type are
increased in both aged humans as well as older mice (Hepple and Rice, 2016; Andersen,
2003; Kanda and Hashizume, 1989; Rowan et al., 2011). Further indication of sarcopenia
involves co-expression of various myosin heavy chain isoforms (Andersen et al., 1999;
Patterson et al., 2006; Rowan et al., 2012), which combined with modified fiber size and
type distribution denote effects from MU remodeling driven by recurring fiber
1.3.2 Animal studies of aging
The process of aging has a prominent impact upon neuromuscular junction
physiology in not only older men and women, but these observations are also present on
aged animals as well. Organization of contiguous ACh receptor expression at the mouse
motor endplate indicates rapid turnover. Additionally, a shifting toward disjointed
populations of post-synaptic receptors in conjunction with formation of proximal nerve
terminal varicosities contribute to weakened maintenance of the synapse (Li, Lee and
Thompson, 2011). Following age-associated disturbance of the mouse neuromuscular
junction, there is denervation-dependent muscle fiber necrosis and reinnervation-driven
synapse modification as evidence by centrally-positioned nuclei in fibers comprising
affected synapses (Li, Lee and Thompson, 2011). Though age-related injury to fibers
produces irreversible changes in mice that become exacerbated with age, presence of
central nuclei in reinnervated fibers along with corresponding muscle fiber necrosis
occurred only briefly and rarely (Li, Lee and Thompson, 2011).
Histochemical examination of aged mice using transmission electron microscopy
revealed prominent signs of neuromuscular junction alteration in the fibularis longus
muscle when compared with younger controls (Boaro, Soares and König Jr, 1998). Much
of this modification observed in aged mice was thought to be the result of declining
motor neuron function as their degenerating terminal axons displayed mitochondrial
decay, aberrant Schwann cell activity and reduced synaptic vesicle production. Most
muscle fiber endplate of aged mice, implying severe morphological and functional
consequences for synapses affected by retreating motor neurons (Boaro, Soares and
Konig Jr, 1998)
Similar to studies of human muscle, studies on aging rats have provided evidence
of MU remodeling compromising neuromuscular junction configuration over time.
Greater degree of poly-innervated synapses, axon growth and decay, reinnervation of
orphaned muscle fibers, and deprivation of acetylcholinesterase sites on denervated
muscle fibers were all observed in aged rats when compared with younger controls
(Kawabuchi et al., 1995). Specifically, older rats exhibited extensive terminal axon
sprouting including neural growth even towards innervated muscle fibers, suggesting a
parallel process of neuromuscular synapse formation and collapse in rats prior to
advanced age that could trigger the adaptive process of MU remodeling and increasing
size through collateral reinnervation of the remaining MUs (Kawabuchi et al.,
1995).
Examination of neuromuscular aging in Drosophila flies with fluorescence and electron microscopy has also demonstrated similar change to the structure of
neuromuscular synapses. In response to aging, there is evidence of impeded release and
sequestering of synaptic vesicles since increased terminal axon size, area of endplate
receptor distribution and number of active zones present in the neuromuscular synapse
may compensate for presynaptic vesicular accumulation seen in aging flies (Wagner et
Research on the effect of aging on MU properties in rat medial gastrocnemius
muscle demonstrated several notable observations. Utilizing methods to examine
functional components of individual gastrocnemius MUs in old and middle-aged rats,
aged animals had high proportion of slow MUs (with proportionally less fast MUs) with
generalized grouping by fiber-type, higher amount of type I muscle fibers (with
corresponding decrease in type II fibers), and more angular fiber appearance (Kanda and
Hashizume, 1989). Furthermore, slow-twitch MUs in older rats produced overall higher
force output when compared to those in middle-aged rats due to expanded innervation
ratio observed as a result of age-related MU remodeling whereby additional muscle fibers
that have been denervated are integrated into surviving MUs (Kanda and Hashizume,
1989).Thus, evidence for age-related changes to MUs has been established in animals,
including MU loss, selective denervation of type II fibers, and modified neuromuscular
junction transmission.
1.3.3 Human aging and motor unit loss
One of the more characteristic features that illustrate the extent to which human
neuromuscular aging has occurred involves the gradual reduction in MU number,
rendering a decreased MU pool of predominantly larger remodeled MUs with altered
function (Doherty, 2003). Electrophysiological studies of both proximal and distal upper
and lower limb muscles have revealed significant decrease in MU number in older adults
that may lead greatly to progressive loss of muscle mass and decline in strength
McKinnon et al., 2015; McNeil et al., 2005; Power et al., 2010; Vandervoort, 2002). Prior
to significant MU loss, muscle fibers undergo denervation, which is brought about
through motor axon damage by excessive oxidative stress with age (Jang and Van
Remmen, 2011; Manini et al., 2013; Misgeld, 2011). Type II motor axons undergo
reduced expression of oxidative enzymes, which when coupled with higher metabolic
demand observed in type II axons (Gordon et al., 2004), could make them susceptible to
long-term aging effects, resulting in greater type II axon loss and subsequent fiber
denervation. It is possible that these metabolic factors may account for selective
degeneration of type II fibers and observed predominance of type I muscle fibers, since
type I motor neurons may increasingly reinnervate remaining type II fibers. These
combined processes result in expansion of MU size in the MU pool of aging muscle
(Doherty, 2003). Therefore older muscles are comprised of larger MUs with increased
numbers of type I fibers.
Age-related changes secondary to MU loss that impact normal innervation of
muscle fibers directly influence muscle function and subsequently result in loss of muscle
contractile strength (Doherty et al., 1993). Previous research has demonstrated that
individuals on average begin to lose approximately 10-15% of muscle strength capacity
each decade after 30 years of age (Vandervoort and McComas, 1986), which only tends
to have a pronounced effect on function around 60 years of age, when up to 50% of
strength has been lost (Doherty et. al., 1993). These physiological signs of sarcopenia,
including significantly decreased muscle mass (Doherty, 2003), are thought to be
underlying mechanism for muscle fiber degeneration for both distal and proximal muscle
groups, with an approximate 50% reduction in the estimated number of MUs beyond the
6th decade in humans (Doherty et al, 1993; Lexell, Taylor and Sjostrom, 1988). This
significant loss of MUs has been demonstrated based on various electrophysiological
motor unit number estimate (MUNE) techniques for the thenar (Brown, 1972; Sica et al.,
1974; Doherty and Brown, 1993), extensor digitorum brevis (Campbell et al., 1973),
hypothenar (Sica et al., 1974), and biceps/brachialis (Doherty et al., 1993), and tibialis
anterior (McNeil et al., 2005) muscles of older individuals. The tibialis anterior in
particular, was shown to exhibit further significant MU loss corresponding to significant
reduction in strength in individuals beyond the 8th decade in life when compared to older
adults of around 65 years of age. This observation may suggest that accelerated losses of
strength occur when a critical number of MUs are lost at which time reinnervation cannot
further effectively compensate (McNeil et al., 2005). Evidence of such age-related
alterations associated with MU loss preceding significant loss in muscle mass and decline
in strength demonstrates the importance of estimating motor unit number in older
subjects.
Though it has been also previously noted that aged (71 ± 4 years) subjects exhibit
about 45% less motor units (in the tibialis anterior) when compared with healthy young
(26 ± 5 years) controls (Piasecki et al., 2016), age-related motor unit remodeling (as a
consequence of MU loss) yields MUs that are increased in size, with greater muscle fiber
density per MU (Stalberg et al., 1989). Remodeled motor units that remain are recruited
mainly at low to moderate thresholds and reveal motor unit potentials of increased size,
Fawcett, 1982). Recently, lifelong exercise has been shown to diminish neural effects of
aging in the tibialis anterior muscle of master’s athletes beyond the 8th decade in life,
with significantly less reduction in the MU pool and less MU instability when compared
with non-trained, healthy older subjects (Power et al., 2016; Power et al., 2010).
1.3.4 Neuromuscular junction aging and stability
The integrity of the neuromuscular junction and indeed the stability with which
muscle fibers are activated is dependent upon a biochemical signaling cascade that
effectively works to concentrate ACh receptor expression on the muscle endplate directly
where synapses are formed by nerve terminals (Hepple and Rice, 2016). This is
accomplished through the expression of agrin by motor axon nerve terminals, which acts
upon muscle-specific kinase (MuSK) of muscle fibers to coordinate other signaling
proteins that help facilitate the coupling of ACh receptors to the muscle cell membrane
(Hepple and Rice, 2016).
It has been documented that processed agrin components in high quantity were
discovered in vivo for certain aged subjects with excessive muscle loss (Hettwer et. al.,
2013). A possible explanation for this occurrence could involve age-related
overexpression of neurotrypsin, the agrin protease which quickly triggers MU collapse.
The effect that such ageing processes may have on perisynaptic Schwann cells, which
promote effective reinnervation and maintain neuromuscular junction configuration
(Sugiura and Lin, 2011), remains to be studied. Alternatively, decreased levels of MuSK
been observed in elderly rats (Gouspillou et al., 2013) in addition to other rodent models
that exhibit disruption in normal recycling of ACh receptors (Carnio et. al., 2014).
Further investigations are necessary for identifying the presence of diminished MuSK in
aged rodents as an underlying cause of neuromuscular decline or as a response to neural
mechanisms.
In humans, the extent of sarcopenia and loss of strength in older subjects (of
relatively similar age and number of MUs) has been shown to be greatly influenced by
MU stability (Gilmore et al., 2017b). Older subjects with severe sarcopenia displayed
reduced maximal volitional strength in comparison to sarcopenic and pre-sarcopenic
older subjects of similar age, while also showing increased electrophysiological measures
of neuromuscular junction instability when compared with pre-sarcopenia individuals
(Gilmore et al., 2017b). Recent studies on proximal and more distal lower limb muscles
(vastus medialis and tibialis anterior, respectively) have revealed the correlation between
MU loss and increased MU instability with normal aging in comparison with younger
controls (Hourigan et al., 2015). Average near fiber (NF) jiggle from the tibialis anterior
muscle was reported in young controls as 26 % compared to 36 % for older individuals.
A similar significant increase in mean NF changes for the vastus medialis with older men
showing 31 % NF jiggle in relation to younger men with 23 % (Hourigan et al., 2015).
Electrophysiological measures of instability (NF jiggle and jitter) have also been used
successfully for assessing variability in the MU in other disorders involving denervation
and MU loss, including diabetic polyneuropathy (Allen et al., 2015) and chronic
inflammatory demyelinating polyneuropathy (Gilmore et al., 2017a). Examination of
demonstrated significant mitigation of age-related increase in MU instability from
lifelong exercise when compared to age-matched controls (Power et al., 2016). These
results might suggest the importance of examining the stability of the neuromuscular
junction when assessing progressive loss of strength with aging, once reduction of MU
number has become functionally relevant.
1.4
Quantitative electromyography
1.4.1 MUP analysisIn order to visually represent the physiology of individual MUs for clinical
analysis and diagnosis of neuromuscular disorders, needle electromyography (EMG)
involves the intramuscular recording of motor unit potentials using an inserted needle
electrode during voluntary muscle contractions. Important features of individual MUPs
for analysis include their amplitude, duration and complexity of their waveforms (phases
and turns). Muscle fiber loss or necrosis (as in myopathies) may be conveyed by MUP
amplitude and duration reduction whereas collateral reinnervation secondary to MU loss
and subsequent reinnervation yields MUPs of increased amplitude and longer durations
in neuropathic disorders such as nerve injury (Stashuk, 1999b). In the typical clinical
setting, an experienced electromyographer makes a subjective determination of MUP
size, shape and recruitment to indicate the presence or absence of diseases affecting the
nerve and muscle. However, in the research setting it is often necessary to obtain a
representative sample of MUPs to make a statistical determination of MUP size and
shape. To do so, during a sub-maximal muscle contraction, a composite signal
MU firing activity, is displayed and recorded. In order to produce MUP templates that
convey electrophysiological information of recruited individual MUs, the initial EMG
signal must be processed through digital filtering that accentuates constituent MUP peaks
as spikes for more reliable classification into templates. From this composite signal of
detected MUs, periodic spikes can be organized into valid spike trains through
recognition of significant spike detections and examination of consistency in shape (often
through pattern recognition algorithms) and the interval between spikes, respectively
(Stashuk, 1999b). From these MUP trains, a representative MUP is extracted, and
calculated variables such as amplitude, duration, phases, turns, and firing rate, for each
detected motor unit are determined (Stashuk, 1999b).
One method of obtaining a sample of MUPs for further analysis is
decomposition-based quantitative EMG (DQEMG) and decomposition decomposition-based spike triggered averaging
(DE-STA). DE-STA is a quantitative needle EMG method whereby intramuscular signals
and surface EMG are obtained to extract simultaneously-discharging needle MUPs and
their surface detected-MUPs (S-MUPs) (Doherty, Stashuk, and Boe, 2009; Nandedkar,
Stålberg, and Sanders, 2002). This is achieved through automated spatial and temporal
pattern recognition algorithms that decompose, sort and then match intramuscular
templates as MUP trains displaying the firing activity of distinctly sampled motor units.
From the intramuscular needle-detected MUP train a representative MUP template is
produced, and the associated S-MUP from the surface EMG signal is extracted through
spike-triggered averaging. Standard quantitative measures of MUP size (amplitude,
duration) and shape (phases, turns) are calculated from the MUP template, whereas an
on 20 or more MUPs from 4 to 6 contractions). The advantage of simultaneously
recording S-MUPs with non-selective surface electrodes and MUPs with selective
intramuscular needle electrodes is seen in the former providing information regarding
motor unit size and spatial distribution of muscle fibers (Stashuk, 1999b), while the latter
yields information concerning the spatial and temporal properties of the individual
muscle fibers (Stashuk, 1999b).
1.4.2 MUNE analysis
One approach to examining the state of all motor units in a particular muscle is
the motor unit number estimate (MUNE). The various MUNE methods, usually obtained
through electromyographic measures, approximate the number of functional motor units
in a muscle or muscle group, but also provide important information about motor unit
remodeling/collateral reinnervation by determination of mean MU size (Nandedkar,
Stålberg, and Sanders, 2002).
All electrophysiological methods of MUNE share a similar basic concept, that is,
the number of functioning MUs in a muscle or muscle group can be estimated by
dividing the mean size of a sample of individual MUs (mean S-MUP size) into the
maximum compound muscle action potential size (representing the sum of all constituent
MUPs). The methods vary only based on the way in which the sample of individual
S-MUPs is obtained.
Several electromyographic techniques have been developed to estimate motor unit
when divided into the compound muscle action potential (a maximal evoked response
representing the sum total of a muscle’s MUPs), yields the MUNE. Manual incremental
stimulation (McComas et al., 1971) is a MUNE technique that relies on successive nerve
stimulation of increasing intensity, whereby individual response increments to the CMAP
are thought to represent the additional individual MUs and their S-MUPs. This method
has the advantage of being collected at a single stimulation site with minimal
invasiveness. However, this incremental MU estimation method is limited by it being
inapplicable to proximal muscles (as their motor nerves are less accessible) and tendency
to overestimate MU number through the phenomenon of alternation (error derived from
considerable overlap in MU thresholds causing various combinations of previously
activated MUs with successive increments) (Milner-Brown and Brown, 1976).
Multiple-point simulation (Doherty and Brown, 1993) was developed to avoid alternation
completely by stimulating at multiple points along the motor nerve, obtaining only a
single S-MUP at each site to provide a sample of S-MUPs to derive the mean S-MUP
size. While this method avoids alternation, it has been contested whether or not this
technique provides a valid mean S-MUP size, given that smaller axons with lower
threshold may be those that are preferentially excited along the nerve (Doherty and
Brown, 1993). Furthermore, the estimation strategy is restricted to distal muscles and
requires significant skill and practice on the part of the operator to reliably stimulate
single axons. Spike-triggered averaging (Brown et al., 1988) is a MUNE technique that
relies upon simultaneous recording of intramuscular and surface electromyography (via
needle and macro surface electrodes) during low-intensity volitional contractions in order
detected MUP spikes are used as triggers to ensemble-average surface EMG signals from
their corresponding MU, thus providing a sample of MUPs to calculate average
S-MUP size (Brown et al., 1988). However, it becomes apparent that with greater
contraction force, the more complex MUP interference pattern can distort the triggering
of surface detection, which limits spike collection to the lowest threshold MUs recruited.
These low threshold MUs are typically of smaller size (Milner-Brown et al., 1973),
resulting in a mean S-MUP that might not be physiologically representative. The addition
of MU signal decomposition to spike-triggered averaging (Stashuk, 1999b; Gooch et al.,
2014), allows for automated identification and clustering of MUP trains to assist in
obtaining a sample of MUPs from at least moderate intensity contractions and more rapid
extraction of their associated S-MUPs. DE-STA achieves reliable automated
identification and ordering of MUP signals through initial first-order filtering of the raw
EMG composite signal, which is subsequently scanned for detection of individual MUPs.
(Stashuk, 1999b). Then, unsupervised classification (or clustering) of MUP data can be
grouped according to a shape and temporal-based pattern recognition algorithm for the
goal of estimating the number of active MUs as well as their corresponding MUP
waveform template (Stashuk, 1999b). Finally, supervised classification of clustered
MUPs uses a certainty algorithm which compares candidate MUPs to prospective MUP
templates for the purpose of generating MUP trains that accurately reflect the activity of
distinct MUs (Stashuk, 1999b).
DE-STA has previously been used to obtain reliable MUNEs in studies of aging,
amyotrophic lateral sclerosis, diabetic neuropathy, and chronic inflammatory
Gilmore et al., 2017a). This MUNE strategy has yielded S-MUPs which represent a
greater diversity of MU size from stronger contractions (Conwit et al., 1997) and
provides useful information regarding individual MU firing and waveform characteristics
(Conwit et al., 1999).
1.4.3 Jiggle and jitter analysis
An important variable for examining motor unit firing characteristics is jiggle.
Jiggle is the variability in MUP shape according to changes in output of individual fiber
contributions to the MUP, between consecutive discharges of their motor unit (Stålberg
and Sonoo, 1994; Figure 1). This jiggle parameter, or mean consecutive difference in
MUP shape between repetitive firings, has shown to be useful in denoting the presence
and time course of collateral reinnervation in response to age-related MU decline
(Stålberg and Sonoo, 1994). Within a given active motor unit, muscle fiber action
potential (MFAP) contributions to the MUAP vary in the intervals between their
discharges. This mean temporal variation between consecutive MFAPs is termed jitter
and in addition to jiggle, comprise statistics used for measurement of MU stability of
neuromuscular junction transmission, with greater jitter and jiggle indicative of greater
instability (Stålberg, 2012; Stålberg and Sonoo, 1994), Increases in jitter and jiggle have
been observed with age-related MU-remodeling as well as in amyotrophic lateral
sclerosis (ALS) and myasthenia gravis patients (Campos et al., 2000; Stålberg, 2012).
Typical values for these stability parameters in normal healthy adults (under the age of
60) has been observed within a range of about 0 - 28 % for jiggle (Stålberg and Sonoo,
1994) and within approximately 30 - 55 ms for jitter (Bromberg et al., 1994). Jitter values
shown significantly increased jiggle and jitter statistical measures of MUP stability in
Figure 1: Schematic representing the significantly increased shape variability or jiggle in an ALS patient. (as quantified by higher consecutive amplitude difference between successive MUPs), relative to a normal subject (reproduced with permission from Stålberg and
1.4.4 Near fiber analysis
Muscle fiber contributions to recorded MUs detected mainly within
approximately 350 μm of the concentric needle electrode are referred to as near fibers
(NFs) and are derived from the NF MUP template (Allen et al., 2015). This template is
achieved through high-pass acceleration filtering of the automated DQEMG-derived
MUP template and a second order differentiator for low pass signals. This so-called
“acceleration filtering” helps to accentuate detected fibers with spatial proximity close to
the needle electrode when creating the NF-MUP template (Stashuk, 1999a). Thus, NF
contributions accentuate temporal interval features, which are representative of individual
NF conduction times toward the needle electrode detection surface by single MFAPs
(Allen et al., 2015; Stashuk, 1999a). Given that MU fibers share comparable conduction
velocities, recorded NF temporal differences convey spatial distance of MFAP and axon
conduction, and by inferring similar muscle fiber conduction velocity within an MU,
temporal variance in NFs (jiggle and jitter) indicate the amount of nerve collateral
sprouting in aged reinnervated MUs (Allen et al., 2015; Stashuk, 1999a).
Several NF characteristics have been defined that describe relationships between
muscle fibers within a MU that contribute significantly to the NF MUP, and pertain to
specific underlying electrophysiological processes. NF count is suggestive of
approximate muscle fiber density in a MU since it measures the quantity of distinct,
detected NF contributions, distinguished as positive turns showing adequate amplitude
and symmetry (Stashuk, 1999a; Allen et al., 2015). Maximum NF interval is defined as
the maximum time measured between NF contributions detected consecutively, in which
reinnervation (Stashuk, 1999a; Allen et al., 2015). NF dispersion is the time interval from
the first to last recorded NF MUP contribution and also provides evidence of
reinnervation taking place. Analogous to the MUP parameter, NF duration is a temporal
measure reflecting the whole duration of the NF MUP (Stashuk, 1999a; Allen et al.,
2015). NF jiggle is a measure of NF MUP variability (akin to traditional MUP jiggle),
which is the mean consecutive difference in NF shape (expressed as a percentage), from
one individual NF MUP in a train to the next. Similarly, NF jitter measures temporal
variation between consecutive muscle fiber pairs detected in the NF MUP (Stashuk,
1999a; Allen et al., 2015) and is analogous to traditional jitter values acquired from either
a single fiber or concentric needle electrode. These NF methods of measuring MU
stability have been used successfully in studies in previous studies on human aging
(Hourigan et al., 2015), chronic inflammatory demyelinating polyneuropathy (Gilmore et
al., 2017a) and diabetic neuropathy (Allen et al., 2015), with significantly increased NF
instability reported in these aging and clinical subject groups.
1.5
The first dorsal interosseous and biceps brachii muscles
The ulnar nerve derives its axons from primarily the eighth cervical and first
thoracic roots that eventually form a collection of nerves that enter the lower trunk and
medial cord of the brachial plexus (Stewart and Bourque, 2002). The ulnar nerve is
derived from the medial cord. Beginning in the axilla, the nerve begins to run underneath
the intramuscular septum of the upper arm, along the medial triceps brachii muscle, only
to reach the elbow. The nerve then innervates the flexor carpi ulnaris and part of the
wrist, the nerve passes through Guyon’s canal, also known as the ulnar tunnel, this canal
is important as the site of ulnar branching into deep and superficial pathways, whereby
the latter innervates primarily the palmaris brevis muscle and the former extends across
the hand to innervate the hypothenar, lumbricals (3rd and 4th), interosseous (palmar and
dorsal) muscles, the adductor pollicis, and often a component of flexor pollicis brevis
(Kincaid and Campbell, 2002). Ulnar innervation is present in certain intrinsic muscles of
the hand, such as the interosseous, hypothenar and some thenar muscles, and is
responsible for contributing to fine motor control movements such as pinch and grip
strength (Kozin et al., 1999). The first dorsal interosseous (FDI) muscle, situated
superficially on the back of the hand between the thumb and index finger, is responsible
for abducting the latter digit exclusively, since dorsal interossei and lumbricals of the
hand primarily function in spreading the fingers away from the hand’s midline. The FDI
along with the other dorsal interossei are also involved in assisting finger flexion at the
metacarpophalangeal joints during grip and pinch contractions of the hand (Kozin et al.,
1999).
The musculocutaneous nerve originates in the lateral cord of the brachial plexus
and is derived from the fifth to seventh cervical roots, extending to supply the biceps
brachii (BB) and brachialis muscles of the upper arm (Stewart and Bourque, 2002).
Lateral to the BB tendon, the musculocutaneous nerve continues across the elbow to
become the lateral cutaneous nerve, innervating the lateral forearm to the level of the
wrist (Stewart and Bourque, 2002). One of the BB muscle’s functions during voluntary
movement is flexion of the elbow, however it is also involved in supination of the
their relative size, but also in that the latter muscle’s constituent MUs occupy a larger
territory with greater innervation ratio of muscle fibers incorporated in each MU and a
significantly larger MU pool in general. Specifically, the FDI reveals on average a total
of 119 ɑ-motor axons, 40,500 muscle fibers and an innervation ratio per MU to be 340,
compared with the BB, which is estimated to have around 774 ɑ-motor axons, 580,000
muscle fibers and an innervation ratio of about 750 (Feinstein et al., 1955; Doherty et al.,
2002). The FDI also differs from the proximal BB in fiber type percentage, with more
than half of muscle fibers (around 57%) in the former identified as type I, while the BB
exhibits a predominance of type II fibers or about 62% of total MUs (Johnson et al.,
1973; Brooke and Kaiser, 1970). The various anatomical and physiological differences
between these upper limb muscles make them ideal for studying the impact of aging
where muscle undergoes MU remodeling involving recurring cycles of denervation and
nerve collateral reinnervation of muscle fibers.
1.6
Study objectives
The primary aim of this study is to examine MU loss and remodeling, and
age-related MU instability via electrophysiological measures by comparing a distal (FDI) and
proximal (BB) muscle in young and older healthy subjects. DQEMG methods have been
previously applied to study MU loss (Boe, Stashuk and Doherty, 2006; McNeil et al.,
2005; McKinnon et al., 2017) and NF jiggle and NF jitter parameters have been used to
examine age-related MU stability for proximal and distal lower limb muscles (Hourigan
et. al., 2015). However, MU stability has not been examined to date in proximal and
individuals will show significant decline in MU number, associated increase in MU size,
as well as increased MU instability as measured by NF jitter and jiggle, when compared
Chapter 2
2
Introduction
The process of normal neuromuscular aging (referred to as sarcopenia) is marked
by gradual deterioration in skeletal muscle mass and quality with significant loss in
contractile strength, which culminates in reduced mobility and inevitable loss of
functional independence (Doherty, 2003). Underlying this process is evidence of muscle
fiber loss (particularly of type II fibers) as a result of chronic alpha-motor neuron
denervation (and subsequent motor unit loss) due to excessive oxidation damage over
time associated with the highly metabolic environment of motor axons (Manini et al.,
2013).
Since sprouting nerve terminals incorporate more muscle fibers in remodeled
MUs, this contributes to increased MU size, as exemplified by higher amplitude, longer
duration needle MUPs and larger surface MUPs (S-MUPs). These neuromuscular
features of normal aging can be extracted through the use of decomposition-based
quantitative EMG (DQEMG), which through simultaneous recording of needle-detected
intramuscular and macroelectrode-detected surface signals, can sample a MU pool
assisted by MU recognition and sorting algorithms to assess presence of reinnervation as
well as MU stability (Stashuk, 1999a; Stashuk, 1999b). These electrophysiological
measures using DQEMG have demonstrated MU remodeling due to aging, with
characteristic increased MUP and S-MUP amplitude as well as decreased MUNE (Power
demonstrated reduced MU numbers for upper and lower limb muscles that approach fifty
percent by the 7th decade and may accelerate thereafter (Doherty, 2003; McNeil et al.,
2005).
The significant decline in MU number, mainly as a result of increased denervation
and collateral reinnervation in response to aging, yields larger surviving MUs of fewer
number. These remodeled MUs exhibit physiological changes at the neuromuscular
junction, which impact their transmission stability during muscle activation. Such
increased transmission variability (or decreased firing stability) at the neuromuscular
junction is observed with animal as well as human studies on aging (Boaro, Soares and
Konig Jr, 1998; Kawabuchi et al., 1995; Li, Lee and Thompson, 2011; Gouspillou et al.,
2013; Gilmore et al., 2017a; Gilmore et al., 2017b; Hourigan et al., 2015). The integrity
of the neuromuscular junction can be examined using MUP stability parameters, jiggle
and jitter (Stålberg and Sonoo, 1994). Where jitter represents the average variability in
time interval between consecutively firing muscle fiber contributions to a single MU,
jiggle describes variability in MUP shape between successive discharges of one MU
(Stålberg and Sonoo, 1994).
Novel near fiber (NF) parameters of MUP stability (NF jiggle and NF jitter),
through the use of decomposition-based quantitative electromyography (DQEMG), have
shown evidence of MU instability in previous studies of aging and neuropathic disorders
(Hourigan et al., 2015; Allen et al., 2014; Gilmore et al., 2017). Significantly increased
jitter (measuring mean consecutive difference in time interval between pairs of
contributions to a set of isolated NF MUPs) have been observed in in lower limb muscles
of healthy older adults when compared with younger control subjects (Hourigan et al.,
2015; Power et al., 2012; Power et al., 2016). Although MU loss due to aging has already
been reported for proximal upper limb muscles such as the biceps brachii (Power et al.,
2010), the NF MUP stability of upper limb muscles in older adults has not yet been
studied. Due to functional differences between proximal and distal muscles of the upper
and lower limbs, it remains unclear which muscle groups would be impacted more
greatly due to aging mechanisms of denervation, MU loss and decline in muscle mass.
The purpose of the current study was to compare MU loss and age-related MU
stability between a distal (FDI) and proximal (BB) upper limb muscle in healthy young
and older adults with the specific objective of using NF parameters from DQEMG to
assess any age-related changes in stability for these muscles. It is hypothesized that both
muscles of interest in older individuals will show significant decline in MU number,
associated increase in MU size, as well as increased MU instability as measured by NF
Chapter 3
3
Methods
3.1
Participants
This study compared thirteen younger (31 ± 13 years; 5 males and 8 females) to
eleven older adults (74 ± 5 years; 5 males and 6 females). All young and older subjects
were free of known neuromuscular disorders. Specifically, no participant had any known
history of generalized polyneuropathy, ulnar nerve injury, or cervical radiculopathy. We
did not attempt to screen out subclinical disease and screening electromyography was not
specifically performed to rule out asymptomatic ulnar neuropathy or cervical
radiculopathy. Young subjects were recreationally active but not highly trained and the
older subjects took part in regular physical activity through the Retirement Research
Association and Ladies Retirement Research Association programs at the University of
Western Ontario.
For every participant tested, data from both their first dorsal interosseous (FDI)
and biceps brachii (BB) muscles were obtained. All subjects gave informed consent and
the study was approved by The University of Western Ontario Health Sciences Research
Ethics Board.
FDI and BB strength were tested using the Medical Research Council (MRC)
scale for muscle strength, where participants were asked to perform index finger
abduction and elbow flexion for their dominant limb against manual resistance from the
examiner. Contractions of full, normal strength were ranked a maximum score of 5, while
weaker contractions were graded lower on the positive integer scale, the lowest possible
score being 0 (indicating no movement). All participants also completed grip strength
testing with a Jamar hand-grip dynamometer (JAMAR® 5030J1, Chicago, IL) and
pinch-grip dynamometer (JAMAR® 749805, Chicago, IL). For both grip and pinch tests, three
trials were performed whereby the highest force measurement in kilograms was recorded
while subjects carefully rested their dominant forearm on a table while comfortably
seated. In this position, each subject squeezed the hand-grip dynamometer by making a
fist on the apparatus and applied force to the pinch-grip dynamometer by pushing their
thumb against their medial index finger with the pinching apparatus in between. Subjects
were verbally encouraged to give their maximal performance. In addition to force output
and MRC score, age, weight and height were recorded for each subject.
3.3
Needle EMG data acquisition
The FDI and BB were studied in all subjects. Both surface and intramuscular
EMG signals were detected simultaneously and analyzed using commercial software on
the Viking EMG system (Natus Medical Incorporated, San Carlos, California). Surface
EMG signals were acquired through the use of self-adhesive Silver Mactrode© electrodes
(GE Medical Systems, Milwaukee, Wisconsin) and intramuscular EMG with 25 mm 30
For each subject, surface potentials were detected using a bandpass of 5 Hz – 5 kHz,
while for intramuscular signals, 10 Hz – 10 kHz was used. Sampling rates for surface and
intramuscular potentials were at 4.8 Hz and 48 KHz, respectively.
Subjects were comfortably seated with their dominant forearm outstretched and
pronated on a table. Prior to EMG examination of the FDI muscle, the skin surface
overlying the muscle’s belly, MCP joint and distal ulnar styloid process (at the wrist)
were cleansed using wipes containing 70% isopropyl alcohol. Following this, surface
electrodes were cut into thirds (0.66 cm x 3.5 cm). The active electrode was placed over
the mid-belly of the FDI, the reference electrode over the MCP joint, and ground
electrode over the ulnar styloid. For the BB, the skin over the mid-belly of the muscle
was cleansed with alcohol. Full sized electrodes (2 cm x 3.5 cm) were placed over the
mid-belly of the muscle (active) and the distal tendon (reference), with the ground
electrode over the olecranon process.
In order to obtain a maximum compound muscle action potential for both muscles
of interest, a manual bipolar stimulator was used to apply stimuli to the ulnar nerve at the
wrist for the FDI muscle, and to the musculocutaneous nerve high in the axilla for the
BB. Stimulation intensity was gradually increased for each muscle until a maximal
potential was observed with no further increase in negative peak amplitude. The active
electrode was repositioned as necessary to minimize the rise time and maximize the
negative peak amplitude, at which point the surface electrodes were secured with
adhesive tape to prevent movement during subsequent data collection. Based on initial
majority of the older subjects due to adiposity, and the close proximity of the
musculocutaneous nerve to the median and ulnar nerves in the upper arm. As a result
valid CMAPs were obtained for the FDI, the majority of young subjects BB, but not older
subjects BB. Therefore, MUNEs were not calculated for BB.
After collection of the maximal CMAPs (where indicated), careful insertion of a
concentric needle electrode in both muscles, proximal to the active surface electrode, was
performed in each subject. All voluntary contractions performed by the subjects were
ensured to be isometric for both muscles by carefully stabilizing the limb and the
examiner providing manual feedback.
Voluntary isometric contractions were elicited by the subject, involving abduction
of the index finger for FDI activation and elbow flexion for BB movement, for a duration
of 30 seconds and recorded at submaximal intensities. The intensity of contractions was
controlled such that they generated between 40 – 60 pulses per second of the aggregate
needle EMG signal which was displayed in real time by the software and monitored by
the investigator to maintain appropriate levels of contraction intensity (Figure 2). This
intensity has been established to provide efficient detection of MUPTs previously by
DQEMG studies and approximates 25-30% of maximum voluntary contraction (McNeil,
Figure 2: Intramuscular recording of FDI muscle from a younger subject during a submaximal voluntary contraction. Intramuscular recording of FDI muscle screen depicting aggregate of concurrently firing MUs (upper left panel) sampled via
concentric needle electrode at monitored contraction intensity for a single 30 second
Following each contraction, a summary of concurrently acquired intramuscular
and surface EMG data was displayed and were reviewed for suitability for analysis
(Figure 3). Sixty seconds of rest was provided between contractions. Contractions were
repeated for approximately 6 – 8 trials, with the inserted needle electrode being
repositioned for each trial to sample different motor units. All subjects were instructed to
maintain relatively consistent intensity once motor units were activated and to refrain
from movement during each isometric contraction. Data collection for each muscle was
concluded when at least 20 or more individual MUP trains that met specific analysis
inclusion criteria (see below) were recorded from each muscle studied.
Figure 3: Summary screen displaying MUP template (A), shimmer plot (B), S-MUP template (C), IDI histogram (D), and firing graph (E) from sampled MUs in an FDI contraction. Three distinct MUP trains are represented by their MUP template (A), which accurately represents overall shape and duration for 51 traces of the MUP
train, as displayed by its shimmer plot (B). S-MUP templates corresponding to each MU
are also shown (C), along with the inter-discharge interval (IDI) histogram for each train
(D) and instantaneous firing rate plot for all detected MUPs in the MUP train. A
B
C
D
3.4
EMG data signal analysis
Throughout data acquisition, the D-QEMG software automatically saved and
organized all recorded intramuscular and surface EMG data signals. This was
accomplished by the software’s specific decomposition algorithms comparing temporal
and spatial similarities from the EMG needle recording that can be clustered and sorted
into their derivative MUP trains (Figure 2) (Doherty and Stashuk, 2003). First, detection
of suitable MUPs (Figure 3) for extraction was based on defined criteria regarding
amplitude and slope parameters (amplitude of at least 50 μV and 0.3 V/s,
respectively). These detected MUPs were initially clustered algorithmically into MUP
trains first according to similar potential waveform shape (unsupervised classification)
and subsequently by classifying unidentified MUPs through comparisons to the
newly-created groupings (supervised classification, Stashuk, 1999b). Automated analysis of
clustered MUPs concluded with confirming their attribution to assigned, distinct MUs by
examining their firing rates and looking for instances where MUPs never fired in unison
(indicating MUPs as belonging to the same MU) and MUPs that fired simultaneously on
occasion (belonging to different MUs) (Stashuk, 1999b). Through this process, distinct
MUPTs were derived that represented the firings of distinct MUs. For each MUPT, all
MUPs collected by the intramuscular needle were time-locked to the surface EMG signal,
allowing the constituent S-MUPs to be extracted for each associated MUP through
spike-triggered averaging (Doherty and Stashuk, 2003) (Figure 5). For each detected MUPT,
this information was necessary to yield ensemble averaged needle MUP template (which
were based on the median filtered data of 51 isolated contributions) and their associated
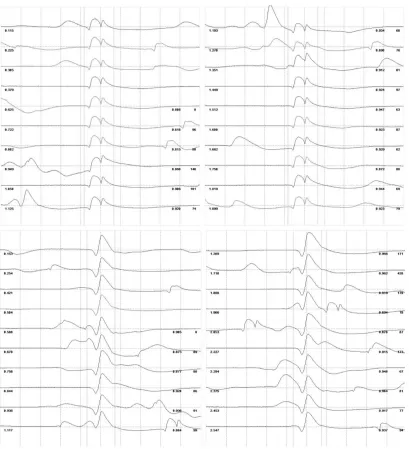
Figure 4: Raster plots for two MUP trains algorithmically classified as
distinct MUs from one voluntary FDI contraction. Each sweep represents the observed physiological variation in a given MUP contributing to its respective motor unit potential
train (MUPT). Times of occurrence (in seconds) in addition to inter-discharge intervals
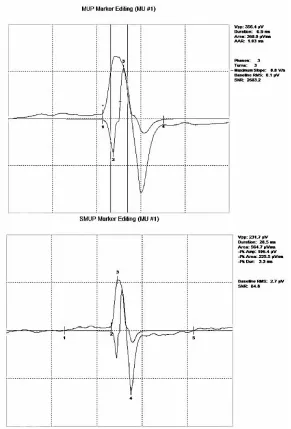
Figure 5: Motor unit potential (MUP) template and corresponding spike-triggered surface motor unit potential (S-MUP) sampled from the FDI. EachMUP template (top panel) and its corresponding spike-triggered S-MUP (bottom panel) are
examined for onset and end marker positions (which quantify the duration of a template
waveform) as well as the negative and positive peak positions, which give a measure of