Bibliography,
catalogs,
pixel
data:
M
anagement
of
heterogeneous
Big
Data
at
CDS
by
the
documentalists
BugaM.1,,FerniqueP.1,,BotC.1,AllenM. G.1,BonnarelF.1, andBroutyM.1
1Université de Strasbourg, CNRS, Observatoire astronomique de Strasbourg, UMR 7550, F-67000
Stras-bourg, France
Abstract. High speed Internet and the evolution of data storage space in terms of cost-effectiveness has changed the way data are managed today. Large amounts of
heteroge-neous data can now be visualized easily and rapidly using interactive applications such as “Google Maps”. In this respect, the Hierarchical Progressive Survey (HiPS) method has been developed by the Centre de Données astronomiques de Strasbourg (CDS) since 2009. HiPS uses the hierarchical sky tessellation called HEALPix to describe and orga-nize images, data cubes or source catalogs. These HiPS can be accessed and visualized using applications such as Aladin.
We show that structuring the data using HiPS enables easy and quick access to large and complex sets of astronomical data. As with bibliographic and catalog data, full documen-tation and comprehensive metadata are absolutely required for pertinent usage of these data. Hence the role of documentalists in the process of producing HiPS is essential. We present the interaction between documentalists and other specialists who are all part of the CDS team and support this process. More precisely, we describe the tools used by the documentalists to generate HiPS or to update the Virtual Observatory standard-ized descriptive information (the “metadata”). We also present the challenges faced by the documentalists processing such heterogeneous data on the scales of megabytes up to petabytes.
On one hand, documentalists at CDS manage small size textual or numerical data for one or few astronomical objects. On the other hand, they process large data sets such as big catalogs containing heterogeneous data like spectra, images or data cubes, for millions of astronomical objects. Finally, by participating in the development of an interactive visualization of images or three-dimensional data cubes using the HiPS method, docu-mentalists contribute to a long-term management of complex, large astronomical data.
1 Introduction
1.1 The context of Big Data
Strasbourg astronomical Data Center (CDS1) collects and distributes worldwide astronomical data and related information. Let me go back to the popular sense of the word “astronomical”: extremely
e-mail: [email protected] ORCID: 0000-0002-0845-7705 e-mail: [email protected]
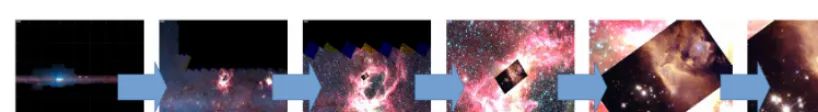
Figure 1.The more you zoom in on a particular area the more details show up
large, enormous. Hence, managing astronomical data has always been a matter of Big Data. But how big? Present or future missions bring astronomy into the era of petabyte surveys, with large volumes of high quality images and catalog data. The quantity of data is continuously growing. To point this out, we take as example the future LSST project2. Due to the high speed with which the telescope will map the sky, but also to the depth it can see, LSST will produce about 15 TB of data per night, with a total amount of collected data of 60 PB. Processing this data will produce a 15 PB catalog database. But already today the Gaia3satellite, launched in 2013, is observing one billion stars several times in order to get their brightness, proper motions, distances and positions over time. CDS documentalists, astronomers and an IT specialists team made the Gaia Data Release 1 (DR1) available for the scientific community4; it can be accessed in various ways using the Gaia@CDS5page: either by using the catalog service VizieR Web interface, Cone Search or TAP tools or by cross-identifying the Gaia sources with other catalogs using the X-Match service. Additionally, today, Gaia identifiers are present for almost 1.8 million of SIMBAD6sources.
Another way of accessing interactively large data is via Aladin7: pixel or catalog data structured using the Hierarchical Progressive Surveys (HiPS) [1] method can be displayed by panning or zoom-ing just like in google map, but lookzoom-ing at the sky and uszoom-ing sky survey data. HiPS is an IVOA8 standard (since May 2017) for packaging, storing, querying and describing astronomical data. It has been developed at CDS since 2009 and it has enjoyed a big success: various data centers such as IRAP9, IAS10, SSC-XMM11, CADC12, JAXA13 or ESAC14 use this method to provide hundreds of terabytes of data representing hundreds of HiPS. Fig. 1 shows an Aladin view of a large data set structured in HiPS, accessed at finer and finer resolution by zooming on a wide area until reaching a detailed view of the survey. Restructuring images into HiPS involves a resampling of the original pixels and a preservation of the associated meta data, as described in section 2 and 3.
This paper describes how documentalists structure original pixel data into HiPS. Section 2 outlines the mechanism behind the HiPS method. Section 3 shows the main steps documentalists follow to organize data using the HiPS method. In section 4 we discuss challenges faced by the documentalists and we provide our conclusions.
2https://www.lsst.org/about
3http://icc.ub.edu/research/key_projects/gaia
4check Boch T. October 2016 IVOA “Interop” Meeting presentation for more details about the Virtual Observatory access to Gaia DR1: http://wiki.ivoa.net/internal/IVOA/InteropOct2016Apps/Apps2-TBoch-VO-access-GaiaDR1.pdf
5http://cdsweb.u-strasbg.fr/gaia 6http://simbad.u-strasbg.fr/simbad/ 7http://aladin.u-strasbg.fr/aladin.gml 8http://www.ivoa.net/
9https://ov-gso.irap.omp.eu/doku.php 10https://idoc.ias.u-psud.fr/ipod 11http://xmmssc.irap.omp.eu/
12http://www.cadc-ccda.hia-iha.nrc-cnrc.gc.ca/en/about.html 13http://global.jaxa.jp//
14http://www.esa.int/About_Us/ESAC
processing it using various internal tools developed by the IT specialists, such as DJIN [3], COSIM[4] or HiPSgen15. The astronomers’ scientific expertise complements documentalists’ knowledge in order to provide pertinent and useful information to the scientific community. Namely, documentalists update the following CDS services:
• the SIMBAD database[6]: with cross-identifications, basic data, measurements and bibliogra-phy for individual astronomical objects outside the solar system;
• the VizieR catalog service [7]: with astronomical sources , published tables, observation logs, spectra, light curves, polarization data, models , statistical analyses, compilations, etc grouped in a collection of astronomical catalogs with associated data [5];
• the interactive sky atlas Aladin[2]: with images and data cubes structured in HiPS, accessed and visualized interactively16.
Therefore, in addition to the burst of the data volume in astronomy, documentalists at CDS also face data complexity. Indeed, CDS hosts numerical or text string data, related to a single SIMBAD object or organized in VizieR tables and catalogs; associated data such as spectra, time series, etc; images or data cubes in original format or structured into IVOA standards such as HiPS and MOC (Multi-Order coverage Map)17. Since 2016, documentalists joined the IT specialists and astronomers team handling big pixel data. Documentalists structure images and data cubes into HiPS, allowing Aladin or other specialized sky browsing tools developed by data centers such as JUDO18, ESASky19, MIZAR20 to give a progressive view of surveys covering a part of, or the entire sky, at various spatial scales. Data reorganization into HiPS uses a hierarchical multi-resolution division of the sky called HEALPix, that we will present next.
2 HiPS way of structuring astronomical data
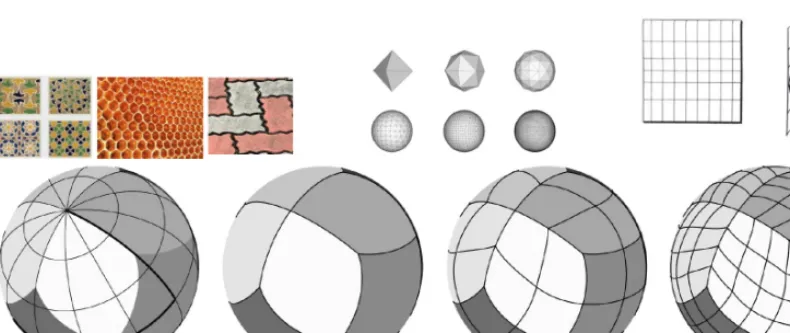
2.1 HEALPix tessellation techniqueTessellation is used by architects for brickwork, by artists for decoration and bees use this technique to build their honeycombs. In astronomy we use tessellation to map data on the sky. Let us go into a little more detail. Different hierarchical multi resolution divisions of the sky are used in astronomy:
WWT21 uses a triangular partition of the sphere and Google22 a cylindrical one (second and third upper panel in Fig. 2). The CDS Hierarchical Progressive Survey method uses a curvilinear partition-ing called HEALPix (Hierarchical Equal Area isoLatitude Pixelization)[8] (the lower panel in Fig. 2). The HEALPix way of dividing the sphere has a wide usage in astronomy and it has been chosen by CDS as a balance between performance and quality. HEALPix has a base resolution used to divide the sphere into 12 equal cells, called the order 0 HEALPix map (the most left frame from the lower panel
15http://aladin.u-strasbg.fr/hips/HipsIn10Steps.gml
16Big sources catalogs can also be structured into HiPS for a progressive view in Aladin (subsets of the catalog are displayed in function of the angular resolution), but this is done by other members of the team, not by documentalists
17http://ivoa.net/documents/MOC/
18https://darts.isas.jaxa.jp/astro/judo2/about.html 19http://sky.esa.int/
Figure 2. Tessellation usage. The first most left upper panel shows examples of tessellation in art, nature and architecture. The lower panel shows the type of tessellation called HEALPix. The second and third upper panels show other types of hierarchical multi-resolution tessellation of the sky used in astronomy, namely triangular and cylindrical division of the sphere.
in Fig. 2). Increasing resolution is reached by sub-dividing each cell into 4 equal cells, recursively, until reaching the maximum survey resolution (order 1 HEALPix map . . . max order HEALPix map). The lower panel in Fig. 2 shows the hierarchical structure of HEALPix : each pixel is divided into four similar pixels at each successive order.
2.2 HiPS structure: maps, tiles and pixels
Documentalists use the HiPS generator tool called HiPSgen to structure hierarchically large volumes of images or data cubes into HiPS. The associated astrometrical calibration has to be provided in the header of the FITS23image file or as an ascii separate file. A valid WCS24header is required in order to specify the coordinates on the sky for a given pixel location in the original image.
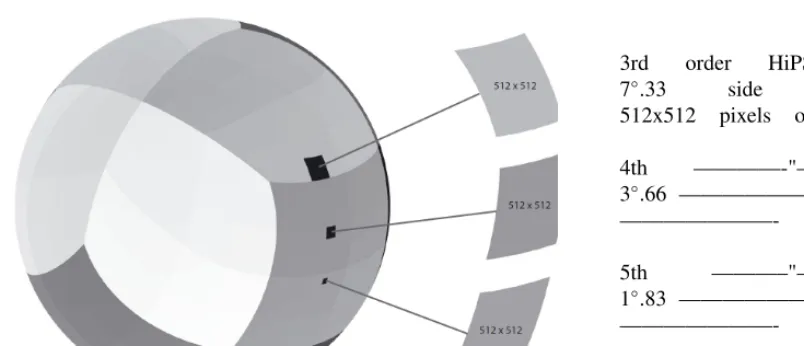
The result of structuring this astronomical data into HiPS, using the HEALPix tessellation of the sky, is a set of HEALPix maps over a range of successive orders: the higher the order, the better the resolution of the image. The tiles define the basic unit of storage for the HIPS. For instance, the projection of the sphere from Fig. 3 with various shades of gray indicating the successive orders of the HEALPix maps, shows three HIPS tiles of different orders: the bigger the HEALPix map order,
the smaller the tile, the higher the resolution of the data representation. Therefore, HIPS enables a multi-resolution data representation, allowing a visualization of the original data in a progressive way, from the full sky to individual image pixels.
To sum up, a HiPS representation of original data is a set of tiles and the associated metadata, stored all together as a directory tree, like in Fig. 4: NorderNN directories correspond to various shades of gray from the Fig. 3; NpixNNN .png or .fits tiles correspond to "smaller" or "bigger" tiles as those from the Fig. 3; other files such as properties or index.html store the metadata. A HiPS can be
Figure 2. Tessellation usage. The first most left upper panel shows examples of tessellation in art, nature and architecture. The lower panel shows the type of tessellation called HEALPix. The second and third upper panels show other types of hierarchical multi-resolution tessellation of the sky used in astronomy, namely triangular and cylindrical division of the sphere.
in Fig. 2). Increasing resolution is reached by sub-dividing each cell into 4 equal cells, recursively, until reaching the maximum survey resolution (order 1 HEALPix map . . . max order HEALPix map). The lower panel in Fig. 2 shows the hierarchical structure of HEALPix : each pixel is divided into four similar pixels at each successive order.
2.2 HiPS structure: maps, tiles and pixels
Documentalists use the HiPS generator tool called HiPSgen to structure hierarchically large volumes of images or data cubes into HiPS. The associated astrometrical calibration has to be provided in the header of the FITS23image file or as an ascii separate file. A valid WCS24header is required in order to specify the coordinates on the sky for a given pixel location in the original image.
The result of structuring this astronomical data into HiPS, using the HEALPix tessellation of the sky, is a set of HEALPix maps over a range of successive orders: the higher the order, the better the resolution of the image. The tiles define the basic unit of storage for the HIPS. For instance, the projection of the sphere from Fig. 3 with various shades of gray indicating the successive orders of the HEALPix maps, shows three HIPS tiles of different orders: the bigger the HEALPix map order,
the smaller the tile, the higher the resolution of the data representation. Therefore, HIPS enables a multi-resolution data representation, allowing a visualization of the original data in a progressive way, from the full sky to individual image pixels.
To sum up, a HiPS representation of original data is a set of tiles and the associated metadata, stored all together as a directory tree, like in Fig. 4: NorderNN directories correspond to various shades of gray from the Fig. 3; NpixNNN .png or .fits tiles correspond to "smaller" or "bigger" tiles as those from the Fig. 3; other files such as properties or index.html store the metadata. A HiPS can be
23Flexible Image Transport System; VO standard format for astronomical images and tables 24http://www.atnf.csiro.au/people/mcalabre/WCS/
4th ————-"————
3◦.66 ———————"——
———————- 25”.8
5th ———–"————
1◦.83 ———————"——
———————- 12”.9
Figure 3. HIPS tiles and pixels representation. The relationship between the tiles and the HEALPix pixels are discussed in detailed in Fernique et al. 2015 [1]. Each tile (in black) has a constant number of pixels over all of the orders, here 512x512 pixels/tile.
Figure 4.HiPS representation of the original images from the DSS POSS survey: tiles and associated metadata. The directories OrderNN (NN=3..10) contains all the tiles associated to the HEALPix maps.
used locally by Aladin or other dedicated clients by using its root directory name. To enable on-line25 use of HiPS, the directories and files are simply copied in a HTTP server.
3 HiPS creation process and metadata update
First, together with the astronomers and IT specialists, we establish a priority list and check the data availability, during meetings or by email.
Second, linux commands are used to get the data from internal or external server or from other file hosting services such as Dropbox.
Then the data are prepared. In other words, there are cases when bad margins have to be removed from the original data such as for the photographic plates digitized using the MAMA26 facility in Paris. In other cases, multi-filter data has to be structured in folders in order to create one HiPS per color, as for the DSS27survey.
Finally, the HiPSgen tool parameters are handled and the HiPS tiles and metadata generation process starts. The HiPS generation tool accepts a long list of parameters; usually, values are set for 10 to 15 of them. The only required parameter is the source image directory. Moreover, other optional parameters are used to handle:
• the original images: sky background, margins or metadata;
• the HiPS tiles: .fits extension tiles are created by default, but .png and .jpeg tiles can also be generated for faster access;
• HiPS metadata: the survey associated MOC following the IVOA MOC standard, information about the associated original data to be displayed for the final user in Aladin or other advanced HiPS clients.
The HiPS generation process can take from few minutes to several days, depending on the size of the data. Finally, the associated metadata are updated, the result is checked and together with the team, we validate the final HiPS. Here are two examples of associated metadata documentalists updates:
• the HiPS generic metadata(properties file from Fig. 4): All this generic metadata can be visu-alized either in a short HTML presentation associated to the HiPS ( index.html file from Fig. 4) or in Aladin. Besides adding a short description of the survey, information about the progen-itor data associated with the tiles, bibliography, etc28, calculations and conversions using VO standards metadata conventions are performed, such as for the survey wavelength unit or epoch representation;
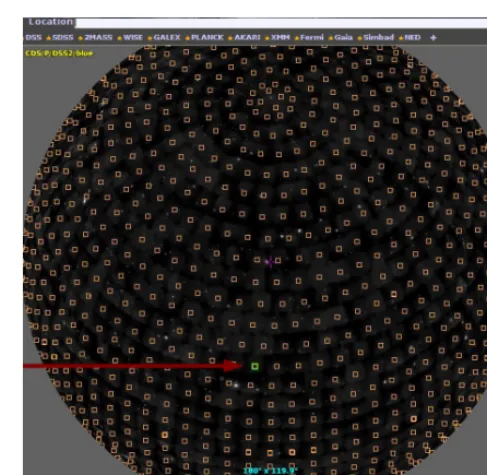
• the original images metadata: The information about the original images is included into the JSON format tiles (stored in the HpxFinder directory from Fig. 4) during the HiPS generation. The metadata.xml file ( see Fig. 4) is a VOTable29 template. Its content is updated in order to allow the final user to visualize information associated with the original images, such as the one present in the lower part of Fig. 5. In this panel one can see an Aladin all sky view of the sphere. The small squares invite us to select the original images used to build the HiPS and to access the associated meta information displayed in the lower part of the Aladin view. Any changes in the choice of the original images displayed information can be done by simply modifying the metadata.xml file.
4 Challenges for documentalists
The diversification of the astronomical data types and size brings changes in the way documentalists at CDS deal with databases content. Next, we will discuss how documentalists handle issues related
26Machine Automatique a Mesurer pour l’Astronomie 27http://www.cadc-ccda.hia-iha.nrc-cnrc.gc.ca/fr/dss/
28A list with the mandatory and optional keywords describing the associated meta information can be found in the IVOA Proposed Recommendation http://www.ivoa.net/documents/HiPS/20170406/PR-HIPS-1.0-20170406.pdf
hosting services such as Dropbox.
Then the data are prepared. In other words, there are cases when bad margins have to be removed from the original data such as for the photographic plates digitized using the MAMA26 facility in Paris. In other cases, multi-filter data has to be structured in folders in order to create one HiPS per color, as for the DSS27survey.
Finally, the HiPSgen tool parameters are handled and the HiPS tiles and metadata generation process starts. The HiPS generation tool accepts a long list of parameters; usually, values are set for 10 to 15 of them. The only required parameter is the source image directory. Moreover, other optional parameters are used to handle:
• the original images: sky background, margins or metadata;
• the HiPS tiles: .fits extension tiles are created by default, but .png and .jpeg tiles can also be generated for faster access;
• HiPS metadata: the survey associated MOC following the IVOA MOC standard, information about the associated original data to be displayed for the final user in Aladin or other advanced HiPS clients.
The HiPS generation process can take from few minutes to several days, depending on the size of the data. Finally, the associated metadata are updated, the result is checked and together with the team, we validate the final HiPS. Here are two examples of associated metadata documentalists updates:
• the HiPS generic metadata(properties file from Fig. 4): All this generic metadata can be visu-alized either in a short HTML presentation associated to the HiPS ( index.html file from Fig. 4) or in Aladin. Besides adding a short description of the survey, information about the progen-itor data associated with the tiles, bibliography, etc28, calculations and conversions using VO standards metadata conventions are performed, such as for the survey wavelength unit or epoch representation;
• the original images metadata: The information about the original images is included into the JSON format tiles (stored in the HpxFinder directory from Fig. 4) during the HiPS generation. The metadata.xml file ( see Fig. 4) is a VOTable29template. Its content is updated in order to allow the final user to visualize information associated with the original images, such as the one present in the lower part of Fig. 5. In this panel one can see an Aladin all sky view of the sphere. The small squares invite us to select the original images used to build the HiPS and to access the associated meta information displayed in the lower part of the Aladin view. Any changes in the choice of the original images displayed information can be done by simply modifying the metadata.xml file.
4 Challenges for documentalists
The diversification of the astronomical data types and size brings changes in the way documentalists at CDS deal with databases content. Next, we will discuss how documentalists handle issues related
26Machine Automatique a Mesurer pour l’Astronomie 27http://www.cadc-ccda.hia-iha.nrc-cnrc.gc.ca/fr/dss/
28A list with the mandatory and optional keywords describing the associated meta information can be found in the IVOA Proposed Recommendation http://www.ivoa.net/documents/HiPS/20170406/PR-HIPS-1.0-20170406.pdf
29http://www.ivoa.net/documents/VOTable/20091130/REC-VOTable-1.2.html
Figure 5.Aladin all sky view of DSS blue images structured into HiPS
to big volume data, heterogeneity, incomplete or incorrect associated metadata or big astronomical survey complexity.
The time required by the HiPS process can be very long, depending on the size of the original images, not to mention the time needed to transfer the final result to the server. During this time, the documentalist either switches to SIMBAD updating with the bibliography, cross-identifications, basic data and measurements or he/she updates the metadata of other existing HiPS. Working with
large pixel data implies switching between servers, disks or partition, checking the currently running processes, handling new tools and linux console commands (wget, rsync, get, grep, gunzip, HiPSgen, etc). Multitasking skills of documentalists become an important requirement in today’s Big Data era. An astronomical survey may have images with randomly distributed bad pixels, different sky
backgrounds, resolutions and filters. Given this input data heterogeneity, tests using a small number of images need to be performed before launching the calculation of the whole image survey. Further-more, applying the same parameters to heterogeneous data may be a big challenge. Sometimes the HiPS generation process has to be restarted partially or entirely due to the irregularities created by the rich diversity of images or due to the lack of images for a certain location on the sky. The more surveys we handle, the more we learn about the heterogeneity problems which may arise, the faster we handle properly the structuring of images and data cubes into HiPS.
An insufficiency or inaccuracy of the mandatory keywords from the original data FITS format
the cases full metadata is provided for the new HiPS, aspects like the limits of the visualization tools in loading very large images may prevent the display of the HiPS original data.
Handling pixel data coming from various astronomical surveys implies communicating directly or by email with astronomers and IT specialists. HiPS validation, a better understanding of the input data, the choice of the pertinent metadata or information to be displayed in advanced HiPS clients, are just a few issues demanding that astronomers, IT specialists and documentalists have a close collaboration.
5 Conclusions
We presented the way documentalists use the HiPS IVOA standard to structure larger and larger volumes of astronomical data such as images and data cubes. This hierarchical, multi-resolution way of structuring data allows a progressive view of astronomical surveys, by zooming and panning on specific areas of the sky. Documentalists at CDS produce HiPS and update the associated metadata. This allows important information about the original data to be stored in the same directory as the HiPS itself and to be easily displayed by the HiPS client/browser tools.
Therefore, documentalists at CDS handle bibliographies and catalogs but also pixel data such as images and data cubes. The data are structured in HiPS tiles with associated metadata and can be visualized progressively, just like in google maps. Documentalists adapt to the era of large surveys and contribute to an easy and fast visualization and reuse of Big Data in astronomy.
References
[1] P. Fernique, M.G. Allen, T. Boch et al., A&A578, A114 (2015) [2] F. Bonnarel, P. Fernique, O. Bienaymé et al., A&AS143, 33 (2000)
[3] S. Lesteven, C. Bonnin, S. Derrière et al. 2010,DJIN: Detection in Journals of Identifiers and Namesedited by Eva Isaksson, Jill Lagerstrom, András Holl, and Nirupama Bawdekar (2010), Vol. 433 of Astronomical Society of the Pacific Conference Series, p. 317–32
[4] C. Brunet, M.G. Allen, M. Brouty et al.,COSIM: the necessary evolution of a cross-identification tool along with data evolution, These Proceedings (2018)
[5] P. Ocvirk, G. Landais, L. Michel et al.,Associated data: indexation, discovery, challenges and roles, These Proceedings (2018)