An Image-Based Impact Test for the High Strain Rate Tensile Properties of
Brittle Materials
LloydFletcher1,∗and FabricePierron1,∗∗
1Engineering and the Environment, University of Southampton, Highfield campus, University Road, Southampton SO17 1BJ, UK
Abstract.Testing ceramics at high strain rates presents many experimental difficulties due to the brittle nature of the material being tested. When using a split Hopkinson pressure bar (SHPB) for high strain rate testing, adequate time is required for stress wave effects to dampen out. For brittle materials, with small strains to failure, it is difficult to satisfy this constraint. Because of this limitation, there are minimal data (if any) available on the stiffness and tensile strength of ceramics at high strain rates. Recently, a new image-based inertial impact (IBII) test method has shown promise for analysing the high strain rate behaviour of brittle materials. This test method uses a reflected compressive stress wave to generate tensile stress and failure in an impacted specimen. Throughout the propagation of the stress wave, full-field displacement measurements are taken, from which strain and acceleration fields are derived. The acceleration fields are then used to reconstruct stress information and identify the material properties. The aim of this study is to apply the IBII test methodology to analyse the stiffness and strength of ceramics at high strain rates. The results show that it is possible to identify the elastic modulus and tensile strength of tungsten carbide at strain rates on the order of 1000s−1. For a tungsten carbide
with 13% cobalt binder the elastic modulus was identified as 516 GPa and the strength was 1400 MPa. Future applications concern boron carbide and sapphire, for which limited data exist in high rate tension.
1 Introduction
Testing ceramics at high strain rates presents many exper-imental difficulties due to the brittle nature of the mate-rial being tested. When using a split Hopkinson pressure bar (SHPB) for high strain rate testing, adequate time is required for stress wave effects to dampen out. For brit-tle materials, with small strains to failure, it is difficult to satisfy this constraint. Thus, available high strain rate data for ceramics mainly concern compression [1], even though compression failure is always tensile (generally through shear) or structural (buckling). In fact, in [1], compression is applied to a dumbbell specimen but failure is initiated in the transition zone of the dumbbell shape, most likely due to shear. Therefore, there is a strong need for well-founded tensile fracture data at high strain rates for ceramics, so that structural compression failure can be predicted from the tensile strength.
The idea of using wave reflection to produce tension is not new. So-called ’spalling tests’ have been around for a long time, though this terminology encompasses very dif-ferent realities, from shock-based plate impact spalling on metal [2] to lower rate spalling of concrete [3] or compos-ites [4, 5]. Classical data interpretation of the spalling test relies on measurement of the velocity of the free back face of the test specimen. However, new full-field data process-ing techniques have recently emerged as an alternative. In [6], the Virtual Fields Method (VFM) was used for the first
∗e-mail: L.C.Fletcher@soton.ac.uk ∗∗e-mail: f.pierron@soton.ac.uk
time on concrete spall tests using the configuration from [3]. The acceleration field obtained by temporal diff eren-tiation was used to reconstruct transverse stress averages, thus producing stress-strain curves in transverse sections without the need for any external force measurement.
The tests in [6, 7] are uni-axial in nature (cylindrical test specimen) but the idea can easily be extended to planar specimens [8]. Recently, both intra [9, 10] and interlami-nar [9] tensile properties of composites were successfully obtained with this new methodology, named Image-Based Inertial Impact (IBII). The objective of the present paper is to show how this methodology can be extended to very strong materials like ceramics and cermets. This is illus-trated here on Tungsten carbide with a cobalt-binder.
2 Experimental set-up and data
processing
2.1 Experiment
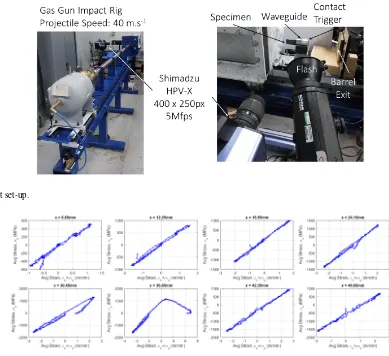
strength steel and mounted into an oil filled nylon (Oilon) sabot (figure 1). The projectile/sabot assembly was ac-celerated in a compressed air gas gun as seen in figure 2. The impact speed, measured by a set of two light gates at the end of the barrel, was 40 m.s−1. During the test,
the specimen was first subjected to a compressive stress wave. When the wave reached the free edge, it reflected as a tensile wave, as in the classical spall configuration. Contrary to [6] where a long pulse was used to obtain a nearly uniform stress state where the specimen fails, the short impactor used here produced a narrow spatial stress wave which enabled higher stresses to be reached to frac-ture this very strong material.
As in [6], the specimen was mounted with a bi-directional grid using the transfer procedure detailed in [11], with a pitch of 0.7 mm. The pitch was selected to obtain a sampling of 5 pixels per period since the cam-era has a spatial resolution of only 400 x 250 pixel2. Some
free pixels were kept in the x-direction to account for some rigid body translation during the test as it is essential to keep the free edge within the field of view. Lighting was provided by a Bowens 1000 flash light. Since the flash rise time is 100µs, it was triggered offthe light gates and the appropriate time delay was directly calculated using an Arduino-based custom-made system. The specimen de-formation was filmed using a Shimadzu HPV-X camera at 5 Mfps. The 128 frames recorded during the test covered a record time of 25.6 µs, which was slightly larger than the time needed for one wave return (wavespeed of about 6 km.s−1). Because of the short record time, the camera
could not be triggered offthe light gates as there would be too much uncertainty in the projectile to wageguide con-tact time. Therefore, two thin copper films were mounted to the wageguide, as seen in figures 1 and 2, and the cir-cuit closure caused by the projectile impact was used to provide the trigger pulse to the camera. A delay was used to account for wave propagation in the waveguide. This ensured stable and reproducible triggering of the camera.
2.2 Data processing
The grid images were processed using the spatial phase shifting algorithm described in [12]. In particular, the it-erative phase calculation was selected, which helps to ac-count for slight grid defects. Instead of subtracting the ref-erence and deformed phase maps directly, the deformed one is modified to take into account the displacement of the related material point. This was helpful to measure the small strain levels recorded here. The two in-plane com-ponents of displacement were then derived from the phase difference maps, and both spatial and temporal diff erenti-ation was implemented to calculate strains and accelera-tion. Because of the presence of noise in the images (and therefore, in the displacement maps), both spatial and tem-poral smoothing of the displacements was employed. Spa-tial smoothing was first applied to the displacements in the form of a local Gaussian filter over a kernel of 17 x 17 data points (about 3 x 3 grid lines). Strains were then obtained by centred finite differences. Temporal smoothing in the
form of a third order Savitsky-Golay filter over a window of 21 data points was first applied to the raw displace-ments before spatial smoothing and temporal diff erenti-ation by centred finite differences to obtain acceleration. These parameters were found to provide adequate com-promise between random and systematic errors. However, a systematic study based on the image deformation proce-dure reported in [13] is currently under way to determine optimal smoothing parameters and estimate identification uncertainties.
Using the same procedure as in [8], the average of the longitudinal stress σxx across the specimen width, σxxy can be obtained from the average of the ax acceleration over the surface between the considered section of coordi-natexand the free edge,axS, as:
σxxy=ρxaxS (1)
whereρ is the material density. If the material behaves elastically, it is then possible to reconstruct stress-strain curves at each section where a data point is available, in the form of averages across the width. Since spatial Gaus-sian smoothing resulted in biased data over one half of the kernel at the free edge, padding of the acceleration was necessary there to obtain good stress reconstruction using Eq. 1 at the stage of wave reflection. This was done using linear extrapolation.
3 Results
The stress-strain curves reconstructed using Eq. 1 and the average strains across the width are shown in figure 3 for eight sections between the free edge and the impact end (0 mm being the free edge). Poisson’s ratio was identified using the Virtual Fields Method using the virtual fields from Eq. 15 in [14]. The identified Poisson’s ratio was 0.23.
The responses are remarkably linear elastic and con-sistent between the different sections. This is exceptional considering the very low levels of strains involved and the very high strain rates, up to 1000 s−1. Young’s
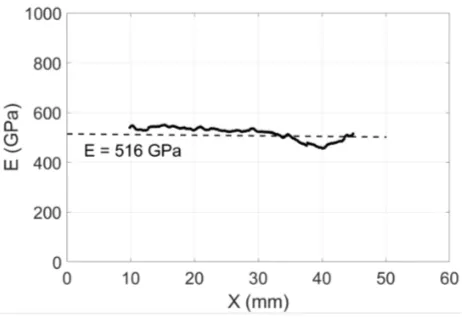
modu-lus was identified from the average of the slope of these curves over the 60% of sections at the specimen centre, to mitigate the effects of edges (low strains towards the free edge, effect of spatial smoothing). The average modulus identified over this set of sections was 516 GPa. The data are represented in figure 4. Over the 251 data points in this figure, the stability of the identified stiffness is quite remarkable. Both E and ν obtained here compare well with quasi-static data published in [15]: E=540 GPa and
ν=0.22 for Kennametal KF312 (12% Co binder, density of 14,300 kg.m−3, grain size less than 1µm), as no strain
rate effect on the stiffness was expected.
strength steel and mounted into an oil filled nylon (Oilon) sabot (figure 1). The projectile/sabot assembly was ac-celerated in a compressed air gas gun as seen in figure 2. The impact speed, measured by a set of two light gates at the end of the barrel, was 40 m.s−1. During the test,
the specimen was first subjected to a compressive stress wave. When the wave reached the free edge, it reflected as a tensile wave, as in the classical spall configuration. Contrary to [6] where a long pulse was used to obtain a nearly uniform stress state where the specimen fails, the short impactor used here produced a narrow spatial stress wave which enabled higher stresses to be reached to frac-ture this very strong material.
As in [6], the specimen was mounted with a bi-directional grid using the transfer procedure detailed in [11], with a pitch of 0.7 mm. The pitch was selected to obtain a sampling of 5 pixels per period since the cam-era has a spatial resolution of only 400 x 250 pixel2. Some
free pixels were kept in the x-direction to account for some rigid body translation during the test as it is essential to keep the free edge within the field of view. Lighting was provided by a Bowens 1000 flash light. Since the flash rise time is 100µs, it was triggered offthe light gates and the appropriate time delay was directly calculated using an Arduino-based custom-made system. The specimen de-formation was filmed using a Shimadzu HPV-X camera at 5 Mfps. The 128 frames recorded during the test covered a record time of 25.6 µs, which was slightly larger than the time needed for one wave return (wavespeed of about 6 km.s−1). Because of the short record time, the camera
could not be triggered offthe light gates as there would be too much uncertainty in the projectile to wageguide con-tact time. Therefore, two thin copper films were mounted to the wageguide, as seen in figures 1 and 2, and the cir-cuit closure caused by the projectile impact was used to provide the trigger pulse to the camera. A delay was used to account for wave propagation in the waveguide. This ensured stable and reproducible triggering of the camera.
2.2 Data processing
The grid images were processed using the spatial phase shifting algorithm described in [12]. In particular, the it-erative phase calculation was selected, which helps to ac-count for slight grid defects. Instead of subtracting the ref-erence and deformed phase maps directly, the deformed one is modified to take into account the displacement of the related material point. This was helpful to measure the small strain levels recorded here. The two in-plane com-ponents of displacement were then derived from the phase difference maps, and both spatial and temporal diff erenti-ation was implemented to calculate strains and accelera-tion. Because of the presence of noise in the images (and therefore, in the displacement maps), both spatial and tem-poral smoothing of the displacements was employed. Spa-tial smoothing was first applied to the displacements in the form of a local Gaussian filter over a kernel of 17 x 17 data points (about 3 x 3 grid lines). Strains were then obtained by centred finite differences. Temporal smoothing in the
form of a third order Savitsky-Golay filter over a window of 21 data points was first applied to the raw displace-ments before spatial smoothing and temporal diff erenti-ation by centred finite differences to obtain acceleration. These parameters were found to provide adequate com-promise between random and systematic errors. However, a systematic study based on the image deformation proce-dure reported in [13] is currently under way to determine optimal smoothing parameters and estimate identification uncertainties.
Using the same procedure as in [8], the average of the longitudinal stress σxx across the specimen width, σxxy can be obtained from the average of the ax acceleration over the surface between the considered section of coordi-natexand the free edge,axS, as:
σxxy=ρxaxS (1)
whereρ is the material density. If the material behaves elastically, it is then possible to reconstruct stress-strain curves at each section where a data point is available, in the form of averages across the width. Since spatial Gaus-sian smoothing resulted in biased data over one half of the kernel at the free edge, padding of the acceleration was necessary there to obtain good stress reconstruction using Eq. 1 at the stage of wave reflection. This was done using linear extrapolation.
3 Results
The stress-strain curves reconstructed using Eq. 1 and the average strains across the width are shown in figure 3 for eight sections between the free edge and the impact end (0 mm being the free edge). Poisson’s ratio was identified using the Virtual Fields Method using the virtual fields from Eq. 15 in [14]. The identified Poisson’s ratio was 0.23.
The responses are remarkably linear elastic and con-sistent between the different sections. This is exceptional considering the very low levels of strains involved and the very high strain rates, up to 1000 s−1. Young’s
modu-lus was identified from the average of the slope of these curves over the 60% of sections at the specimen centre, to mitigate the effects of edges (low strains towards the free edge, effect of spatial smoothing). The average modulus identified over this set of sections was 516 GPa. The data are represented in figure 4. Over the 251 data points in this figure, the stability of the identified stiffness is quite remarkable. Both E and ν obtained here compare well with quasi-static data published in [15]: E=540 GPa and
ν=0.22 for Kennametal KF312 (12% Co binder, density of 14,300 kg.m−3, grain size less than 1µm), as no strain
rate effect on the stiffness was expected.
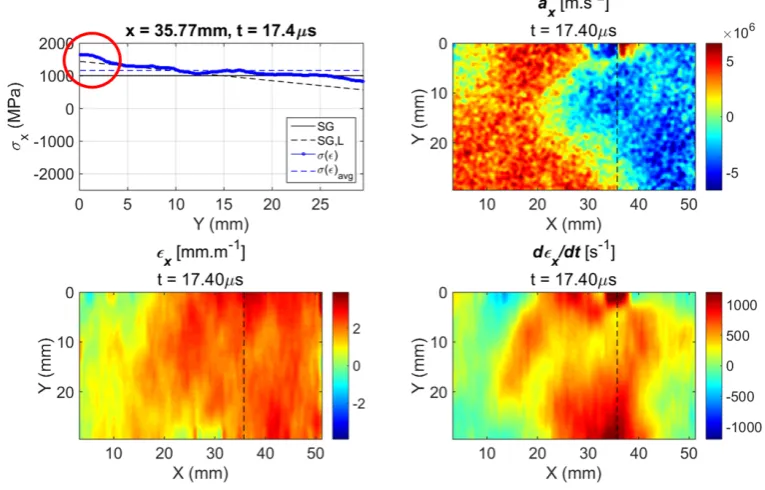
The strength was also identified using Eq. 1. In fact, a more elaborate version of this equation can be established using the three possible solid rigid body virtual fields. This provides a linear estimation of the stress over the width from only acceleration data, denoted SG,L [10]. The stress from SG,L can be compared to the stress obtained from
Fig. 1.Close up view of the specimen attached to waveguide showing the camera contact trigger (left). High strength steel waveguide and projectile assembly (right).
Fig. 2.Test set-up.
Fig. 3.Stress-strain curves at different cross-sections along the specimen length.
the strain and the identified stiffness components. Fracture will cause these two metrics to diverge. Figure 5 shows ac-celeration, strain and strain rate maps at the identified time step of fracture. The top-left plot shows clearly the depar-ture of the strain-based stress from the acceleration-based stress SG,L. This enabled the identification of a tensile fracture stress of approximately 1.41 GPa. The present au-thors failed to find in the literature any relevant quasi-static tensile strengths on similar material systems, let alone at
high rates, as all the publications reported compression or bending strengths. So one cannot comment here on the strain rate dependence of the tensile strength.
re-Fig. 4. Young’s modulus as a function of specimen length (251 stiffness data points)
flections of the stress waves or a result of the specimen smashing into the back of the capture chamber. This could be elucidated in the future by using a lower frame rate to enable longer imaging time.
4 Conclusion and future work
The new IBII test protocol developed in the PhotoDyn project (www.photodyn.org) has been proved to success-fully identify the stiffness and tensile strength of a tungsten carbide material at strain rates up to 1000s−1. To the best knowledge of the authors, such high strain rate tensile re-sults are unprecedented in the literature and provide a new and effective way to study such materials. Future work will address comparative testing of several grades of tung-sten carbide, as well as extending the methodology to ma-terials like boron carbide, which has a much higher wave speed. Uncertainty quantification and optimal smoothing parameters will be determined using synthetic grid defor-mation, as in [13].
The authors want to thank Dr Leslie Lamberson from Drexel University for providing the samples and for useful discussions
about the material. Funding from EPSRC, grant EP/L026910/1, is also gratefully acknowledged.
References
1. J.J. Swab, C.S. Meredith, D.T. Casem, W.R. Gamble, Journal of Materials Science52, 10073 (2017) 2. S. Zhuang, J. Lu, G. Ravichandran, Applied Physics
Letters80, 4522 (2002)
3. B. Erzar, P. Forquin, Experimental Mechanics50, 941 (2010)
4. F. Gálvez Diaz-Rubio, J. Rodriguez Pérez,
V. Sánchez Gálvez, International Journal of Im-pact Engineering27, 161 (2002)
5. R.A. Govender, L.A. Louca, A. Pullen, A.S. Fal-lah, G.N. Nurick, Journal of Composite Materials46, 1219 (2012)
6. F. Pierron, P. Forquin, Strain28, 388 (2012)
7. P. Forquin, B. Luki´c, Journal of Dynamic Behavior of Materials (2017)
8. F. Pierron, H. Zhu, C. Siviour, Phil. Trans. A 372, 20130195 (2014)
9. L. Fletcher, F. Pierron,Inertial impact method for the through-thickness strength of composites, in Confer-ence Proceedings of the Society for Experimental Me-chanics Series, edited by Springer (????), pp. 105–108 10. L. Fletcher, J. Van Blitterswyk, F. Pierron, Compos-ites Part A: Applied Science and Manufacturing Sub-mitted.(2018)
11. J.L. Piro, M. Grediac, Experimental Techniques 28, 23 (2004)
12. M. Grédiac, F. Sur, B. Blaysat, Strain52, 205 (2016) 13. M. Rossi, P. Lava, F. Pierron, D. Debruyne, M. Sasso,
Strain51, 206 (2015)
14. R. Moulart, F. Pierron, S.R. Hallett, M.R. Wisnom, Experimental Mechanics51, 509 (2011)
Fig. 4. Young’s modulus as a function of specimen length (251 stiffness data points)
flections of the stress waves or a result of the specimen smashing into the back of the capture chamber. This could be elucidated in the future by using a lower frame rate to enable longer imaging time.
4 Conclusion and future work
The new IBII test protocol developed in the PhotoDyn project (www.photodyn.org) has been proved to success-fully identify the stiffness and tensile strength of a tungsten carbide material at strain rates up to 1000s−1. To the best knowledge of the authors, such high strain rate tensile re-sults are unprecedented in the literature and provide a new and effective way to study such materials. Future work will address comparative testing of several grades of tung-sten carbide, as well as extending the methodology to ma-terials like boron carbide, which has a much higher wave speed. Uncertainty quantification and optimal smoothing parameters will be determined using synthetic grid defor-mation, as in [13].
The authors want to thank Dr Leslie Lamberson from Drexel University for providing the samples and for useful discussions
about the material. Funding from EPSRC, grant EP/L026910/1, is also gratefully acknowledged.
References
1. J.J. Swab, C.S. Meredith, D.T. Casem, W.R. Gamble, Journal of Materials Science52, 10073 (2017) 2. S. Zhuang, J. Lu, G. Ravichandran, Applied Physics
Letters80, 4522 (2002)
3. B. Erzar, P. Forquin, Experimental Mechanics50, 941 (2010)
4. F. Gálvez Diaz-Rubio, J. Rodriguez Pérez,
V. Sánchez Gálvez, International Journal of Im-pact Engineering27, 161 (2002)
5. R.A. Govender, L.A. Louca, A. Pullen, A.S. Fal-lah, G.N. Nurick, Journal of Composite Materials46, 1219 (2012)
6. F. Pierron, P. Forquin, Strain28, 388 (2012)
7. P. Forquin, B. Luki´c, Journal of Dynamic Behavior of Materials (2017)
8. F. Pierron, H. Zhu, C. Siviour, Phil. Trans. A 372, 20130195 (2014)
9. L. Fletcher, F. Pierron,Inertial impact method for the through-thickness strength of composites, in Confer-ence Proceedings of the Society for Experimental Me-chanics Series, edited by Springer (????), pp. 105–108 10. L. Fletcher, J. Van Blitterswyk, F. Pierron, Compos-ites Part A: Applied Science and Manufacturing Sub-mitted.(2018)
11. J.L. Piro, M. Grediac, Experimental Techniques 28, 23 (2004)
12. M. Grédiac, F. Sur, B. Blaysat, Strain52, 205 (2016) 13. M. Rossi, P. Lava, F. Pierron, D. Debruyne, M. Sasso,
Strain51, 206 (2015)
14. R. Moulart, F. Pierron, S.R. Hallett, M.R. Wisnom, Experimental Mechanics51, 509 (2011)
15. I.C. Getting, G. Chen, J.A. Brown, pure and applied geophysics141, 545 (1993)
Fig. 5.Fracture diagnostics maps: strain, strain rate, acceleration and stress-gauge curves