_____________________________________________________________________________________________________ *Corresponding author: E-mail: [email protected];
www.sciencedomain.org
A Simple Method to Forecast Future Bed
Requirements: A Pragmatic Alternative to Queuing
Theory
Neeraj Beeknoo
1*and Rodney P. Jones
21
King’s College University Hospital, London, UK.
2
Healthcare Analysis & Forecasting, Worcester, UK.
Authors’ contributions
This work was carried out in collaboration between both authors. Author NB designed the study. Author RPJ performed the analysis, wrote the first draft of the manuscript and managed the literature searches. Both authors read and approved the final manuscript.
Article Information
DOI: 10.9734/BJMMR/2016/29518 Editor(s): (1) Rui Yu, Environmental Sciences & Engineering, Gillings School of Global Public Health, The University of North Carolina at Chapel Hill, USA. Reviewers: (1) Kurubaran Ganasegeran, Clinical Research Centre, Seberang Jaya Hospital Penang, Malaysia. (2)Sanjay Kumar Gupta, Peoples University, Bhopal, India. Complete Peer review History:http://www.sciencedomain.org/review-history/16580
Received 15th September 2016 Accepted 11th October 2016 Published 17th October 2016
ABSTRACT
Aims: To review the current state of hospital bed planning, and to develop a simple tool to estimate short-term future bed requirements using historical bed occupancy data.
Study Design: Analysis of daily bed occupancy between January 2008 and October 2015. Synthesis of trends into a method for forecasting bed numbers for each day of the year.
Place and Duration of Study: Daily occupied bed statistics for King’s College University Hospital, a large London Teaching Hospital having 1,600 beds.
Methodology: An eight-year time-series of daily midnight bed occupancy covering elective, emergency and transfer admissions has been used to estimate the number of beds required to deliver a delay-free hospital.
Results: In this large 1,600 bed hospital it is estimated that 100 extra beds (a 6.3% increase) are required to deliver delay free admissions, i.e. no delays to admission from the emergency department or delays due to cancelled elective operations.
Conclusion: The analysis reveals that far higher flexibility is required in staffing levels than is currently available. Potential strategies are discussed to address this issue.
Keywords: Hospital bed modelling; optimum occupancy; trend analysis; health policy; queuing theory; delay to admission; staffing.
1. INTRODUCTION
The Affordable Care Act and slow growth in Medicare prices has given greater impetus to cost containment in the US health care industry, while financial austerity in the UK is having the same impact on the NHS [1]. Issues around bed numbers and occupancy are becoming an increasing part of value for money calculations. Calculating bed requirements in acute hospitals has always been a method caught between a desire to reduce capital and staffing costs, and the operational need to maintain suitable capacity to optimise patient flow. While it is true that bed numbers in the UK (and around the world) have been declining over many years in both absolute and real terms, it is also true that bed occupancy in England is now alarmingly, and almost certainly, dangerously high [2-4]. For example, bed occupancy always reaches a maximum in the 4th quarter of the UK financial year (1st quarter of the calendar year) due to winter pressures [5], and (midnight) occupancy in English acute hospitals (including children’s wards) peaked at an average of 90.7% in the 4th quarter of 2014/15, rising to 91.2% in the 4th quarter of 2015/16 [6].
In 2011 the OECD average acute bed occupancy was 78% with 10 countries above and 15 below the average [7]. Between 2000 and 2011 average bed occupancy in OECD countries increased by a median of +1 percentage point (-1.3% lower quartile, +4.5% upper quartile). The wide range across the OECD leads to the question as to the optimum average occupancy for hospital efficiency. This research paper will start with a review of current knowledge and misconceptions regarding bed numbers and occupancy and then conclude with a pragmatic method for estimating future bed requirements.
1.1 Optimum Occupancy
The poorly understood issue of optimum bed occupancy needs to be addressed. The 85% average occupancy figure (commonly quoted as offering optimum occupancy) appears to have been developed around 1975 as a federal target in the USA in a bid to reduce bed numbers [8]. There was no apparent quantitative analysis
supporting this blanket 85% figure, and due the relationship between average occupancy, size and the ability to provide available beds [3], it transpired that at 85% average occupancy around 40% of obstetric units and 90% of intensive care units had insufficient capacity to provide a bed for the next arriving patient [8]. The 85% figure was further clouded by complete misinterpretation of the study of Bagust et al. [9], which showed that in a medical bed pool comprising 200 beds, the inability to accommodate arriving patients commences at 85% average occupancy, and approached crisis above 90% average occupancy. These figures only apply to a bed pool containing 200 beds, and at an assumed figure of 7.5% maximum seasonal variation [9].
In reality, an infinite range of average occupancies apply in the real world, which depends on the size and complexity of the hospital, the availability of alternative hospitals, and even the effect of latitude on seasonal variation [3-5,10-14]. As implied by queuing theory, there are economy of scale factors relating to smaller hospitals and wards [15-17]. Indeed, the optimum average occupancy is also a function of the balance between capital costs (the cost of an empty bed), and the ‘cost’ of not having a bed available to treat the next arriving patient [18]. Hence, in the USA during the 1980’s there was considerable debate regarding the best method to reimburse hospitals for unavoidable capital costs in smaller hospitals as part of Medicare payments [19].
1.2 Deleterious Effects of High Occupancy
increased length of stay and higher readmission rates [52-54], transmission of multiple antibiotic-resistant organisms [55-61], cancelled elective surgery [62], and delays in the movement of patients through to the critical care department [63]. High bed occupancy in the critical care unit has been associated with poor outcomes for those with sepsis [32], premature discharge, higher readmission and mortality [63].
The mechanism by which high occupancy works appears to be related to the effects of unrelenting high workload on safety and hygiene standards [60], and hence several studies have also implicated high throughput of patients per bed as an additional factor in hospital acquired infections [55,56,64]. Infections such as MRSA and Norovirus can further cripple the bed pool and shift bed pressure to other areas of the hospital leading to both operational inefficiency and financial pressures. Research seems to indicate that the presence of adequate bed numbers facilitates time to make fundamental process changes leading to improved efficiency (lower length of stay) while too few beds simply promotes “bed crisis” [65]. Various hospitals in England (and elsewhere) are further experiencing “bed crisis” both in terms of high bed occupancy and reduced available bed numbers as a result of a single sex ward policy which was recently introduced in the UK [66]. Hospitals with good infrastructure and high bed pool are accommodating this new target compliance by reconfiguring the flow of patients and revisiting patient pathways, whilst smaller hospitals are struggling to comply with detrimental financial impact. Interestingly high occupancy is often a sign of wider resource constraints which act in combination to create poor outcomes and higher mortality [24,34,60,64,67] – hence is a sign of a financially distressed organisation.
An average (midnight) occupancy of 90.7% for an entire quarter, implies that 100% daytime occupancy prevailed across the whole of England on almost every weekday of that quarter [3-6] – midnight occupancy being the minimum point in the 24-hour occupancy cycle. Clearly, something is desperately wrong with bed modelling both in England and potentially elsewhere in the world.
1.3 Declining Numbers of Available Beds
Fig. 1 illustrates several issues regarding the rate of decline in acute bed numbers in England.
Firstly, the rate of decline has diminished over time (see trend line), and appears to have reached somewhere near to zero in 2015/16. Secondly the trend is characterised by a regular series of peaks and troughs, and that the major loss of beds in 2006/07, a year of unusually low demand [5], was counterbalanced by a net gain in beds in 2008/09. The years of higher bed demand appear to coincide with periods of unexplained higher all-cause mortality in the population, in which deaths, medical admissions and staff sickness absence demonstrate spatial patterns consistent with an infectious event [68-71]. Clearly forecasting bed requirements is more complex - and volatile, than first appears [72-75].
1.4 Simplistic Assumptions in Bed Modelling
As has been pointed out, part of the problem lies in the simplistic notions which have been applied to bed modelling for many years [76,77], namely, that bed requirement equals future activity (always underestimated) times average length of stay (likewise underestimated) times optimum/required average occupancy - also overestimated [11]. In the UK, such simplistic notions have been encouraged by the processes forced upon the NHS by recourse to prohibitively expensive Private Finance Initiative (PFI) funding for new hospital estate [78-82]. In England, the actual number of occupied beds (as opposed to available beds) has not declined over the past 15 years [83,84], hence the operationally crippling high occupancy levels seen in recent years (as discussed above) – although the problem is not limited to the UK [7,85,86]. Some of the more serious abuses in bed forecasting will now be discussed.
1.4.1 Length of stay
From a bed planning perspective average length of stay (LOS) is one of the most abused and poorly understood components of bed calculations. Average LOS is always assumed to be a constant - which only reduces over time. As with any calculated average, LOS is subject to the usual limitations of the standard error of the mean, namely, uncertainty in average LOS increases as sample size reduces. Hence, variation around the mean will increase as hospital size reduces.
Fig. 1. Change in available acute bed numbers from one year to the next (England) Source: The base data on Bed Availability and Occupancy was obtained from the NHS England website. https://www.england.nhs.uk/statistics/statistical-work-areas/bed-availability-and-occupancy/bed-data-overnight/
[6]. Bed numbers include overnight plus day beds and are for acute care only, i.e. excludes mental health and maternity
1990’s, the rate of decline since 2000 has been minimal in Australia, the UK and USA [87]. The increasing average age of hospital admissions has even led to a trend to increasing average LOS in recent years [84]. The apparent reduction in average LOS in England over the past decade has been far lower than appreciated. This is due to some 1.6 million same-day-stay emergency ‘admissions’ (possibly called emergency department attendances in other countries) acting to dilute the real average LOS (see section 1.4.2 below) [88,89].
In addition, LOS is highly sensitive to environmental factors (weather, pollution, infectious outbreaks, etc) and fluctuates over time [87,90]. One study involving admissions across a large health authority demonstrated that the variation associated with calculated average LOS (conducted on a quarterly basis) for a wide range of diagnoses decreased in a log-log manner with the number of admissions – as expected from the square root relationship
defining the standard error of the mean. For an average LOS calculated from 10 admissions the standard deviation was equivalent to 40% of the average LOS, and at 100 admissions was around 18% of the average, etc [87]. In addition to this fundamental relationship with size, particular diagnoses were shown to have up to 4-times higher variation due to high environmental sensitivity [87]. This same study demonstrated large variation in average LOS over many years for diagnosis groups in Australia, and for Cardiology admissions in Alberta (Canada). Another study of medical group average LOS in Belfast demonstrated that LOS rose during periods of unexplained higher deaths (all-cause mortality) [91]. Clearly average LOS is not a constant, and can be subject to unexpected trends.
1.4.2 Same-day-stay admissions
As mentioned above, same-day-stay admissions arise when the person is admitted but discharged before midnight of the same day. Such admissions, must be factored into the overall bed count. Hence the 1.6 million same-day-stay ‘emergency’ admissions in England, which have mainly arisen since the introduction of the 4-hour target for a stay in the emergency department introduced in 2002 [88], probably account for somewhere between 1,600 to 3,200 occupied beds which would imply that some 2,000 to 4,000 additional available beds will be required to service these arrivals. Analysis of this stream of patients indicates that their bed occupancy tends to peak around 2 pm (unpublished analysis). It is these patients that tend to push the actual bed occupancy close to 100% in the majority of English hospitals during working hours, and their contribution to overall bed requirements is usually ignored.
1.4.3 Demographic-based forecasting of future admissions
Demographic growth has been used for many years, and is still widely used in many models [92,93], despite being contradicted by the actual trends [68-74,91,94,95], and by the evidence indicating that the marginal changes in bed demand may be driven by nearness to death rather than due to demography per se [96,97].
Demographic forecasting, or age standardisation, was introduced into the field of Public Health as a means of comparing disease rates among populations of disparate age structure. Additional adjustments can be applied for race, gender, deprivation, proximity to pollutants, etc. However, while this is an entirely valid application, it does not automatically follow that today’s rate carries forward into the future.
Demographic-based forecasting is therefore subject to the constant risk fallacy [98], namely, the rate of admissions per age band is not constant but changes over time. This constantly changing rate is driven by changes in disease prevalence due to lifestyle and drug developments, however, it is constrained by the fact that all persons will die due to one cause or another, hence as one disease is reduced (say cardiovascular conditions) another condition will arise to take its place.
In the UK, open discussion regarding unprecedented growth in medical admissions,
which is part of a repeating cycle of unexplained high medical admissions which only ever coincide with periods of unexplained high deaths, and staff sickness absence [68-71,95,99], has been largely avoided by politicians and policy makers alike – made possible by a high degree of central control over the NHS. It has been suggested that these ‘events’ behave in exactly the same way as expected from an infectious outbreak, however, whatever the cause they leave in their wake a series of single-year-of-age specific changes in admission rates which defies all notions of a textbook demographic-basis for future admission rates [100].
Not every condition is affected and both surgical and trauma admissions do indeed appear to roughly follow demographic trends (with additional long-term weather-induced cycles in trauma admissions) [71]. Orthopaedic (elective) admissions follow a trend higher than expected from demography simply because the technology behind orthopaedic procedures is expanding over time. Transplantation technology has shown the same technical developments, however, the number of procedures is limited by the availability of suitable donor organs.
In conclusion, demographic-based forecasting does not have a strong theoretical basis for its application into bed planning, and significantly underestimates future beds in the medical specialties.
1.5 Insights from Queuing Theory
to such sophisticated approaches beyond the reach of most hospitals. In the UK. This represents a somewhat unfortunate by-product of
attempting to run the NHS as a collection of ‘independent’ organizations rather than
leveraging the benefits of centrally provided core planning skills. In the US the range of provider organisations somewhat replicates this situation.
1.6 A Suggested Solution
What is therefore needed is a simple method which encapsulates the reality of both queuing theory, and uncertainty in both demand and average LOS due to the dynamic nature of the effects of environmental agents. This paper will demonstrate how a simple daily count of occupied beds taken over an eight-year period can be used to estimate the likely daily bed requirements for the following year. This is based on the fact that daily occupancy gives a far better picture of hospital surge capacity than annual average occupancy, and that the seasonal nature of bed demand is often overlooked especially in general and elderly medicine, paediatrics and orthopaedics [111]. Such a method must also enable the removal of bed days which may arise from the reduction in admissions arising from national vaccination programs against particular infectious agents [112], or via other more local efficiency endeavours [113].
2. METHODOLOGY
Daily counts of midnight occupied beds were calculated for the eight years between January 2008 and October 2015 for the Kings College Hospital NHS Foundation Trust located in the Denmark Hill area of central London. This hospital currently has around 1,600 beds split across 38 specialty/ward configurations (from 1 bed in nuclear medicine through to 244 beds in general acute medicine, 144 beds in an acute medical assessment unit, etc).
Occupied beds were calculated on the basis of Admissions – Discharges = Change in occupied beds. The admission and discharge date for all
discharges occurring between January 2008 and
October 2015 were available. A pivot table was used to extract counts of admissions and discharges on every day. On each day the difference between admissions and discharges was then calculated. These were then consecutively summed beginning at the day of the first admission, and this sum gives the
number of midnight occupied beds for every day. While this method (based on discharges occurring in a time period) accurately calculates from January 2008 forward it begins to underestimate occupied beds toward the end of the time series and the final three months were therefore discarded from the analysis.
Daily beds were aligned by same day of the week in each calendar year. Hence because 1st January 2008 fell on a Thursday, all years were lined up to commence on the Thursday closest to the 1st of January. The total bed days consumed in each year was then calculated and an adjusting factor was applied to each year to approximate the estimated bed demand in 2016. For simplicity, the highest bed demand in the time series was used as the estimate for 2016, except for Transferred Patients which was showing a downward trend. Obviously more sophisticated methods could be employed to estimate the bed demand in the next year, however, the aim here is to demonstrate the concept. Statistical measures (mean, median, upper quartile and lower quartile) were then calculated for the adjusted bed occupancy for every day in the hypothetical following year.
3. RESULTS AND DISCUSSION
3.1 Results
3.1.1 Age and bed occupancy
The interplay between number of admissions and average LOS acts to determine which age groups occupy the highest proportion of beds. The Kings College Hospital generally services a population which is younger than the national average, however as Fig. 2 demonstrates, those aged 70+ years occupy the most beds. This is due to the inescapable fact that healing and recovery from illness takes longer as a person ages, and length of stay is therefore longer [84], and that admissions increase closest to death. While young children generally recover the fastest, the number of occupied beds for those aged 17 to 29 years represents the smallest contribution to occupied beds due to very low numbers of admissions.
3.1.2 Environment-induced volatility
variation in the arrival rate, the effect of size should show strong Poisson behavior (Jones 2011j). By definition, the standard deviation of a Poisson distribution is equal to the square root of the average (the average being a measure of size). Hence in the absence of additional environment-induced volatility the observed volatility should lie along a straight line in a log-plot as defined by this square root relationship.
Fig. 3 shows the average moving range difference versus average occupied beds. The
moving range (which is related to the standard deviation) is a measure which is also used in Statistical Process Control (SPC) methodologies [114], has been chosen since it is less sensitive to change in the average over time than the more traditional standard deviation.
Fig. 3 shows that certain conditions/specialties which do not have high sensitivity to the environment do indeed show almost textbook Poisson behavior, i.e. data points lying close to the dotted line. However, there are also other
Fig. 2. Distribution of occupied beds by age for emergency admissions at the Kings College Hospital, London
Fig. 3. Average day to day volatility in bed occupancy as a function of average occupied beds for various ICD-10 diagnostic groups and specialty groups
0 100 200 300 400 500 600 700
70+ Total 50-69 Total 30-49 Total 0-16 Total 17-29 Total
A
v
e
ra
g
e
o
cc
u
p
ie
d
b
e
d
s
1% 10% 100%
1 10 100 1,000 10,000
A
v
e
ra
g
e
v
o
la
ti
li
ty
Average occupied beds
Observed
conditions/specialties which display a high proportion of non-Poisson behavior, i.e. environment or process sensitivity, and these lie further away from the dotted line. These tend to be certain types of emergency admission or elective services where activity reduces over the weekend, public holidays, and during the summer, Easter and Christmas/New Year holiday periods. Elective activity is also made more volatile due to loss of beds during periods of high medical bed pressure (usually during the winter) [40].
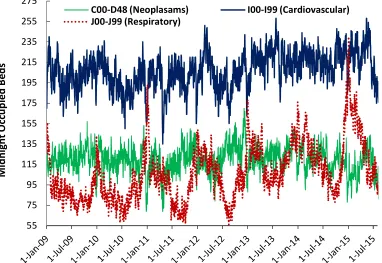
In addition, some medical conditions show higher sensitivity to the environment, and this is illustrated by the trend in daily occupied beds for three ICD Chapters shown in Fig. 4. As can be seen respiratory conditions (Chapter J) show the highest sensitivity, cardiovascular (Chapter I) is intermediate, while neoplasms (Chapter C & part of D) are the least sensitive. While respiratory admissions show a clear winter peak, cardiovascular shows both summer and winter peaks.
These concur with literature observations that many conditions show a degree of seasonal variation [115,116], with some 33 out of the 52
most common diagnoses being moderately to strongly seasonal [117], and that there are seasonal patterns in infectious diseases - mostly respiratory [118,119]. Both respiratory and cardiovascular admissions, in particular, are known to be sensitive to air pollution, cold, humidity, and other metrological parameters [120-122]. These seasonal differences in human immunity and physiology are also related to seasonal patterns of gene expression [123]. Hence, while there is a strong Poisson basis to hospital bed occupancy there is also a strong environmental basis which remains unpredictable apart from complex computational models and advanced weather and infectious forecasting. Changes in population demographics (and deaths), and migration would also have a profound, but more long-term, impact on predictability of type of speciality beds needed in the future. Clearly anticipating this short-term volatility is beyond the scope of the average hospital. Also note from Fig. 4 that peaks and troughs sometimes coincide, which suggests that the boundaries between the sub-specialties of medicine may need to be flexible, and that staff may need to be trained to implement multiple patient pathways [124].
Fig. 4. Daily midnight occupancy for three ICD Chapters showing differing sensitivity to the external environment
55 75 95 115 135 155 175 195 215 235 255 275
M
id
n
ig
h
t
O
cc
u
p
ie
d
B
e
d
s
C00-D48 (Neoplasams) I00-I99 (Cardiovascular)
Having determined that unpredictable seasonal factors may limit the ability to apply queuing-theory based solutions, a potential pragmatic alternative will now be explored. This pragmatic alternative will be illustrated using elective, emergency and transfer admissions using whole hospital total figures. Transfers are more important in the context of a large Teaching hospital and involve patients admitted to surrounding general hospitals being transferred to the Teaching hospital for specialist treatment, and then transferred back for any recuperation. The method can be applied in different ways and using different specialties or bed groups. The idea behind the process is to evaluate how many beds are needed to aid efficient patient flow rather than attempting a sub-optimal solution based on how few beds can ‘we get away with’.
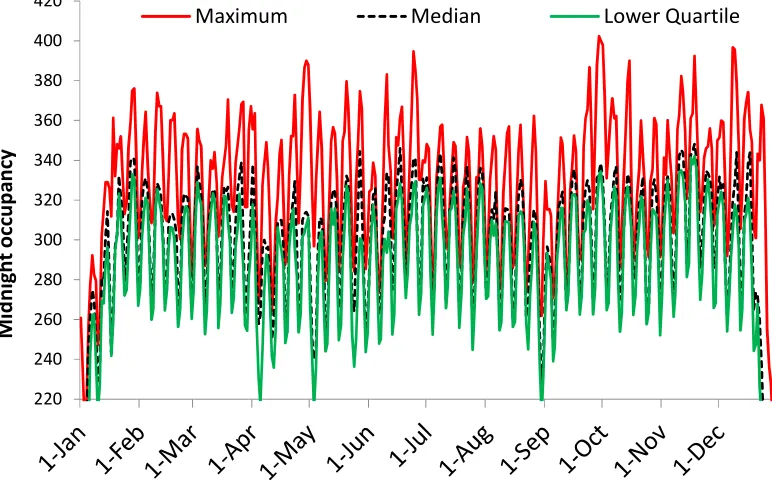
The first step is to take daily midnight occupancy over a number of years, and this is shown in Fig. 5 for elective admissions. As can be seen the nature of the real problem is immediately revealed, namely, elective bed demand fluctuates by day of the week, public holidays and the Christmas break. In addition, elective capacity will be squeezed during times of high emergency demand leading to cancelled operations and even to a lengthening of the waiting list [40]. Since 2011, the KCH elective
waiting list has grown considerably indicating that elective capacity is insufficient.
Total bed days utilized each year since 2009 are as follows: 100,113; 94,611; 97,426; 99,202; 99,743; 107,087; and 99,461 (extrapolated for 2015). For the purpose of this scenario the high point in 2014 was taken to represent the ideal capacity and so each year was adjusted to give 107,087 bed days in total. To preserve the day of-week cycle each year was then lined up to start on the same weekday as 2009 (Thursday). Daily maximum bed occupancy, median and the lower quartile occupancy were then calculated and are shown in Fig. 5.
A simple glance at Fig. 5 reveals that somewhere between 360 to 400 elective beds are probably needed, and the final decision rests with hospital management as to how or if this will be delivered. However, as is plainly obvious, the real issue is how do we flex staff on a daily basis to match the pattern of demand? Hence, assuming that the hospital has provided the ‘correct’ number of beds to optimize theatre utilization and to minimize cancelled operations (assuming the same is done for emergency beds), then the onus is now on the various hospital divisions to deliver the flexible staffing to minimize costs. At present, flexing staff has been achieved by
Fig. 5. Estimated daily occupied beds (maximum, median and lower quartile) for elective admissions
220 240 260 280 300 320 340 360 380 400 420
M
id
n
ig
h
t
o
cc
u
p
a
n
cy
having a proportion of the staff establishment to be covered by bank and agency. Bank and Agency staffing comes with a premium
which is normally 50% higher than substantive staff pay cost. The implications of the median and lower quartile to staffing will be discussed later.
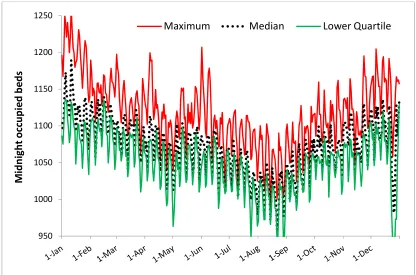
Fig. 6 reveals the same output for emergency admissions, with an estimated 1,220 to 1,270 beds to prevent any interruption of elective activity and eliminate hidden queues in the emergency department.
On this occasion the lower quartile has been added to give an indication of the likely minimum staffing level which could be planned, with the difference between lower quartile and actual met with on-call or
hours-only staffing. However, this comes at a huge price of having sufficient staff for the
worst possible day in January and fewer during the minimum position in August, plus high flexibility on every day of the year. Hence
while staff may justifiably complain of the workload pressure of running at 100% occupancy, the alternative may be even less palatable.
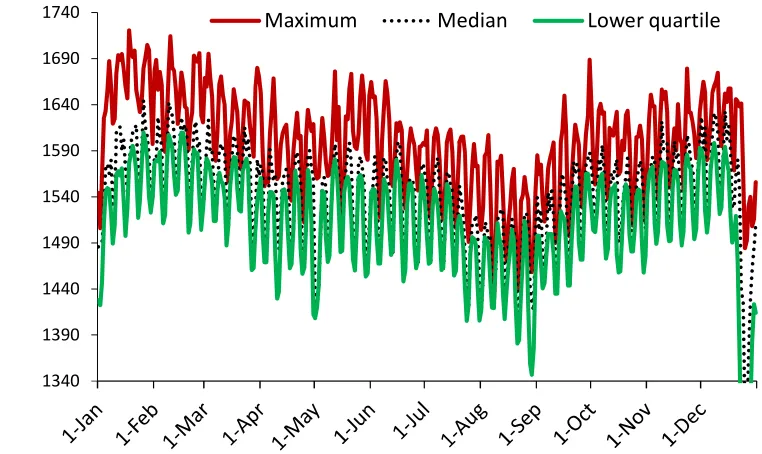
Finally, elective, emergency and transfer can be added together to give Fig. 7.
Total required beds are 1,720 (January peak demand) compared to 1,600 at present. Interestingly the hospital had estimated that an additional 100 beds will be required in the medium terms to deal with capacity constraints. The alternative methodology was based on an in-house Capacity and Demand modelling tool designed to estimate future, rather than present needs. This Capacity and Demand tool took into account demographic growth, intension of local commissioners, local initiatives from local councils, seasonality changes and service reconfiguration amongst surrounding partner hospitals. It is clear that the hospital will need an additional bed pool in excess of 100 as a result of system changes which undoubtedly would come at a cost – assuming that staff cannot be flexed as demanded by Figs. 5 to 7. The key point here is that the present study has identified that additional beds are needed now rather than later. The dilemma would be, is the hospital able to fund an additional 100 beds in terms of capital investment and on-going revenue spend? The current NHS tariff payment model would be insufficient to service the additional 100 beds.
Fig. 6. Estimated daily maximum, median and lower quartile required beds for emergency admissions
950 1000 1050 1100 1150 1200 1250
M
id
n
ig
h
t
o
cc
u
p
ie
d
b
e
d
s
Fig. 7. Estimated total bed requirement (maximum, median and lower quartile) by day of the year commencing on the first Thursday of the year)
3.2 DISCUSSION
The important role of environmental volatility (Fig. 1) was introduced via up and down movements in available beds across the whole of England, observed to occur over many years. This volatility was then seen to be reflected within the hospital for various conditions, specialties, and for different admission types (Fig. 3). Three condition specific profiles were then presented (Fig. 4) to illustrate the seasonal sensitivity for particular conditions, and how this may impact on total bed requirements.
Figs. 5 and 6 illustrated how daily midnight occupancy over an 8-year period could be manipulated to estimate bed requirements for elective, emergency and transfer admissions. Finally, Fig. 7 combined all three admission types to estimate the total bed requirement.
In each chart the maximum, median and lower quartile were displayed. The maximum effectively represents a 1 in 8 chance for that level of bed occupancy on any day of the year. Studies elsewhere have shown that the daily bed occupancy bounces between the maximum and minimum throughout the year depending on the mix of environmental factors encountered throughout each year [5]. Hence it is possible to have both low and high bed demand as the
collective outcome of all environmental conditions within each year.
The point of interest from a staffing perspective is that the lower quartile (occurring on 25% of occasions) is very close to the median. Hence as a first approximation, staffing levels for permanent staff can be set somewhere close to either the lower quartile or the median – depending on the local availability of staff willing to assume flexible working. The difference between median and maximum can then be flexibly staffed with agency staff or staff on a hospital on-call register. Since the median/lower quartile is known with some accuracy a day of week staffing profile is theoretically possible – within the constraints of staff specialisation and multi-skilling. Management therefore have a set of hard numbers on which they can perform financial calculations and conduct staff negotiation.
From the review presented in the Introduction it is clearly evident that a vast array of benefits arises from being able to operate with the required number of beds, i.e. the maximum line. Once again this is also known with some certainty. Hence, a new type of working can be envisaged where the overall benefits to the organisation (no cancelled operations, no queues in the emergency department, elective patients
1340 1390 1440 1490 1540 1590 1640 1690 1740
M
id
n
ig
h
t
O
cc
u
p
a
n
cy
admitted on the weekend just to ensure a bed on Monday, the absence of operational chaos and stress, etc) are delivered within a defined arrangement of permanent and on-call staffing.
Based on readily available metrological, pollution and infectious data (available from the MET office, the DEFRA, and Public Health England respectively), the hospital should be able to construct fairly simple correlations to enable an estimate for the next weeks bed demand. The agencies involved will vary in other countries.
Hence the method is both pragmatic and suitably low-tech to enable hospitals to run at minimum cost while at the same time reaping the benefits of patient flow within an adequate supply of beds. Control of the available beds can be exercised via the Bed Bureau which would declare anticipated free beds as ‘closed’ and therefore not staffed.
The principle has been demonstrated using admission type but can easily be extended to specialty groups. Bed types with particular requirements such as pediatrics, maternity, critical care, and trauma can be modelled using the same principles. Additional forecasts can be prepared for daytime bed occupancy which usually peaks around 2 p.m. The limitation of the method is the availability of at least 8 years of data. Despite IT system upgrades most hospitals have this amount of years available, howbeit if some of the years need to be extracted from archived data.
A key component to the running of a lowest cost hospital has been revealed by this study, namely, a core component of full-time staff and a flexible pool of on-call staff. A modest investment in forecasting based on the environment should enable forecasts for the next week.
It is interesting to speculate if the policy of building the smallest possible hospitals pursued by the Department of Health in England has actually trapped hospitals into a no-win situation with insufficient beds to reap the benefits of an adequate bed supply. Somewhat appositely a recent publication by the NHS Regulator ‘Monitor’ [125] regarding the emergency department crisis experienced in the winter of 2014/15 identified that the major problem was insufficient inpatient beds. Curiously a previous report by NHS England into urgent care had deftly avoided the issue of hospital beds as a source of emergency department pressures
[126], despite supposedly conducting a thorough literature review. Seemingly a case of policy-based evidence avoiding a politically embarrassing problem.
While the provision of adequate beds to run an efficient hospital has remained a thorny issue for many years it would appear that calculating the number of beds is the simple issue. Indeed, using actual daily data, the calculated bed requirement reveals an underlying problem regarding the need to flexibly allocate staff to meet an ever changing bed requirement. Sadly, the central funding of bed forecasting via the MET office health forecasting unit was declined by the Department of Health some years ago, leaving all with the task of reinventing a much needed supporting tool.
3.2.1 Calculating the core number of full-time staff
The analysis presented this paper has implied that a high level of staff flexibility is required to run a minimum cost acute hospital. This of course does not imply that all staff need to be employed on a flexible basis, only that proportion of staff to meet the marginal changes in daily occupancy.
To illustrate the calculation, we can assume a ratio of five patients per nurse (as an example). Taking the worst day in January where both median and lower quartile are around 1,575 occupied beds would give 315 full-time staff (x 3 to give three shifts, plus usual allowance for holidays, sickness and training), and somewhere up to 29 on-call staff (although a much larger pool of people would be required to achieve appropriate skill matching and availability). This calculation can be performed on a weekly, monthly or quarterly basis to reach an acceptable compromise between full-time and on-call staff. Indeed, nurse managers and divisional managers can sometimes fill the gap during periods of very high demand.
3.2.2 Implications to smaller hospitals
For example, the state of Texas is 5.3-times larger than England, while England is double the population of Texas. Even in the relatively rural south-west of England (Cornwall and Devon) some 95% of the population live within a 32-minute car journey to a large acute hospital [129].
In addition, the range in hospital sizes is far greater in the US, mainly due to the large number of smaller rural hospitals. In the US factors such as length of stay can vary by size and associated socio-economic factors [127]. As was demonstrated in Fig. 3 the inherent volatility increases rapidly as size diminishes, and this has profound implications to the average occupancy in smaller hospitals [3].
In the UK hospitals (which are generally larger) are attempting to address financial austerity by running at close to 100% occupancy. While this minimizes staff costs it creates all the deleterious side-effects listed in the review section, and will create a host of hidden costs, plus hidden queues to access hospital services. This may be politically acceptable in the UK but probably not elsewhere.
While the method discussed above will work for smaller hospitals, the issues are the higher capital costs [19] which are inherent with the unavoidable lower average occupancy as size reduces. Issues of size and occupancy for generally smaller psychiatric hospitals have been discussed elsewhere [4]. It is at this point that enhanced staff flexibility (both in terms of day of week and hour of the day, and range of duties) will become a far more important route to cost containment in the US.
3.2.3 Methods for calculating occupied beds
There are a variety of methods for calculating the count of daily occupied beds (midnight). Many hospitals will have bed management software which performs the calculation automatically. Those with SQL Server should be able to develop a suitable subroutine to make the calculation. Alternately a list of admission and discharge dates can be analyzed in Microsoft Excel using a Visual Basic subroutine, or using the method employed in this study. For those wishing to calculate the daily occupied beds manually please note that the data must be extracted based on discharge date and not admission date. This allows the calculation to prime itself to give an accurate total of occupied
beds at the starting discharge date. However, extraction of data by discharge date has the disadvantage that it omits a cohort of patients who have been admitted but not yet discharged. The admission date for these patients will need to be separately extracted and assigned today’s date as a dummy discharge date. Alas, those with non-computerized hospital records will have to manually input admission and discharge dates (plus any other relevant information such as admission type and specialty) into a spreadsheet in order to do the calculations. Also note that it is vitally important to line each year up to start on the same day of the week. This is due to the fact that both elective and emergency bed occupancy has strong day-of-week patterns.
3.2.4 Longer-term forecasts
The construction of new hospitals will usually rely on a 10- to 20-year forecast. It has been repeatedly emphasized that long-term forecasts based on population demography are prone to massive underestimation of future activity, especially for admissions in many high volume medical conditions [5,14,68,70,83,84,89,94,99]. Trends in deaths are also an important component of future bed demand [96,97], as are trends in disease prevalence and other societal and technological factors influencing future rates. In the UK, and probably elsewhere, the temptation has been to ignore current trends, and create an entirely illusionary view of the future in order to build a hospital with the fewest possible beds. Hopefully this article has amply demonstrated the foolishness of such an approach. Too few beds will simply engender chaos and inefficiency.
3.2.5 Limitations of the study
As in any forecasting method the past may not always reflect the future. There will doubtless be debate as to the best method to translate past daily bed occupancy into next year’s likely value. However, a previous study at the Royal Berkshire Hospital in Reading demonstrated that data covering 21 years seemed to behave relatively consistently despite large adjustment factors for the earlier years [5]. Planned adjustments to account for process changes may require thought regarding how they apply across the year, and planners should avoid the temptation to over-estimate benefits.
hospital, due to varied sensitivity to the environment across different ages, social groups, and due to local climatic conditions [130-135]. Hospitals in tourist locations may well experience both a summer peak in bed demand and weekend spikes.
Widespread adoption of this method will be subject to the usual limitations regarding the diffusion of innovation, and capital constraints. The ability to create a flexible workforce will probably require long-term policy and training initiatives.
4. CONCLUSION
Beds are a valued resource, and sufficient beds are required to achieve optimum patient flow from the emergency department, into the inpatient bed pool and into critical care. Too few beds will generate hidden queues, inefficiency and patient harm. The aim in health service policy should be to reduce occupied bed days, but not necessarily bed numbers.
The method presented to calculate the bed requirement is very simple and requires a minimum amount of time and expertise. Convincing staff of the need to change is probably far more difficult – however hard numbers can be generated with which to commence such negotiations. A unique feature of the study is that it makes no assumptions regarding ‘optimum’ occupancy, rather allows occupancy to fluctuate within an adequate bed pool where it is assumed that 100% occupancy will only occur on a few days of the year, at a frequency of 1 in 8 years or less (as per the eight-year series used to prime the bed calculation).
We are left to conclude that beds may not in fact be the real problem in delivering a minimum cost solution, and that the far more challenging issue of staff flexibility and multi-skilling needs to be addressed – within the context of a bed pool sufficient to deliver an efficient and effective service.
CONSENT
It is not applicable.
ETHICAL APPROVAL
It is not applicable.
COMPETING INTERESTS
Authors have declared that no competing interests exist.
REFERENCES
1. White C, Wu V. How do hospitals cope with sustained slow growth in Medicare prices? Health Services Research. 2014;49(1):11-31.
2. Boyle J, Zeitz K, Hoffman R, Khanna S, Beltrame J. Probability of severe adverse events as a function of hospital occupancy. IEEE Journal of Biomedicine and Health Informatics. 2013;18(1):15-20.
3. Jones R. Hospital bed occupancy demystified and why hospitals of different size and complexity must operate at different average occupancy. British Journal of Healthcare Management. 2011;17(6):242-8.
4. Jones R. Optimum bed occupancy in psychiatric hospitals. Psychiatry On-Line; 2013.
Available:http://www.priory.com/psychiatry/ psychiatric_beds.htm
(Accessed December 2015)
5. Jones R. Emergency admissions and hospital beds. British Journal of Healthcare Management. 2009;15(6):289-96.
6. NHS England. Bed availability and occupancy data; 2016.
Available:https://www.england.nhs.uk/stati stics/statistical-work-areas/bed-availability-and-occupancy/bed-data-overnight/ (Accessed September 2015)
7. OECD iLibrary. Health at a glance: Hospital beds; 2015.
Available:http://www.oecd- ilibrary.org/sites/health_glance-2013-en/04/03/index.html?itemId=/content/chapt er/health_glance-2013-34-en
(Accessed December 2015)
8. Green L. How many hospital beds? Inquiry. 2003;39(4):400-12.
9. Bagust A, Place M, Posnett J. Dynamics of bed use in accommodating emergency admissions: Stochastic simulation model. British Medical Journal 1999;319(7203): 155-8.
Zealand Academy of Management (ANZAM) Conference; 2012.
11. Bain C, Taylor P, McDonnell G, Georgiou A. Myths of ideal hospital occupancy. Medical Journal of Australia. 2010;192(1): 42-3.
12. Philip J, Mullner R, Andes S. Toward a better understanding of hospital occupancy rates. Health Care Financing Review. 1984;5(4):53-61.
13. Jones R. Bed occupancy: Don’t take it lying down. Health Service Journal. 2001;111(5752):28-31.
14. Jones R. New approaches to bed utilisation – making queuing theory practical. ‘New Techniques for Health and Social Care’. Harrogate Management Centre Conference 27th Sep; 2001. Available:http://www.hcaf.biz/Hospital%20 Beds/New_Approaches_Bed_Utilisation.pd f
(Accessed December 2015)
15. Audit Commission. Ward staffing: Review of national findings. Acute Hospital Portfolio No 3; 2001.
16. Kristensen T, Olsen K, Kilsmark J, Pedersen K. Economies of scale and optimal size of hospitals: Empirical results for Dutch public hospitals. University of Southern Denmark; 2008.
Available:Static.sdu.dk/mediafiles/Files 17. Jones R. A guide to maternity costs – why
smaller units have higher costs. British Journal of Midwifery. 2013;21(1):54-9. 18. Gorunescu F, McLean S, Millard P. Using
a queuing model to help plan bed allocation in a department of geriatric medicine. Health Care Management Science. 2002;5:307-12.
19. Hemesath M, Pope G. Linking Medicare capital payments to hospital occupancy rates. Health Affairs. 1989;8(3):104-16. 20. Ng B, Kumar S, Ranclaud M, Robinson E.
Ward crowding and incidents of violence on an acute psychiatric inpatient unit. Psychiatric Services. 2001;52(4):521-5. 21. Virtanen M, Vahtera J, Batty D, Tuisku K,
Penlti J, Oksanen T, et al. Overcrowding in psychiatric wards and physical assaults on staff: data-linked longitudinal study. British Journal of Psychiatry. 2011;198:149-55. 22. Teitelbaum A, Lahad A, Calfon N,
Gun-Usishkin M, Lubin G, Tsur A. Overcrowding in psychiatric wards is associated with increased risk of adverse incidents. Medical Care. 2016;54(3):296-302.
23. Virtanen M, Pentti J, Vahtera J, Ferries J, Stansfield S, et al. Overcrowding in hospital wards as a predictor of antidepressant treatment among hospital staff. American Journal of Psychiatry. 2008;165:1482-6.
24. Forster A, Tugwell P, Van Walraven C. An hypothesis paper on practice environment and the provision of health care: Could hospital occupancy rates effect quality. Journal of Quality in Clinical Practice 2000;20:69-74.
25. Rafferty A, Clarke S, Coles J, Bell J, James P, McKee M, Aiken L. Outcomes of variation in hospital nurse staffing in English hospitals: Cross-sectional analysis of survey data and discharge records. International Journal of Nursing Studies. 2007;44(2):175-82.
26. Hartz A, Krakauer H, Kuhn E, Young M, Jacobsen S, Gay G, et al. Hospital characteristics and mortality rates. New England Journal of Medicine. 1989;321: 1720-5.
27. Tarnow-Mordi W, Hau C, Warden A, Shearer A. Hospital mortality in relation to staff workload: a 4-year study in an adult intensive-care unit. Lancet. 2000;356(9225):185-9.
28. Richardson D. Increase in patient mortality at 10 days associated with emergency department overcrowding. Medical Journal of Australia. 2006;184:213-6.
29. Sprivulis P, Da Silva J, Jacobs I, et al. The association between hospital overcrowding and mortality among patients admitted via Western Australian emergency departments. Medical Journal of Australia. 2006;184(5):208-12.
30. Chrusch C, Olafson K, McMillan P, Roberts D, Gray P. High occupancy increases the risk of early death or readmission after transfer from intensive care. Critical Care Medicine. 2009;37(10): 2753-8.
31. Schilling P, Campbell D, Englesbe M, et al. A comparison of in-hospital mortality risk conferred by high occupancy, differences in nurse staffing levels, weekend admission, and seasonal influenza. Medical Care. 2010;48(3):224-32.
33. Madsen F, Ladelund S, Linneberg A. High levels of bed occupancy associated with increased inpatient and thirty-day hospital mortality in Denmark. Health Affairs (Millwood). 2014;33(7):1236-44.
34. Symons N, Moorthy K, Almoudaris A, Bottle A, Aylin P, et al. Mortality in high-risk emergency general surgical admissions. British Journal Surgery. 2013;100:1318-25. 35. Jones R. Bed occupancy and hospital mortality. British Journal Healthcare Management. 2016;22(7):380-1.
36. Hillier D, Parry G, Shannon M, Stack A. The effect of hospital bed occupancy on throughput in the pediatric emergency department. Annals of Emergency Medicine. 2009;53(6):767-776.
37. Krall S, O’Connor R, Maercks L. Higher inpatient medical and surgical bed occupancy extends admitted patients stay. West Journal of Emergency Medicine. 2009;10(2):93-6.
38. Rabin E, Kocher K, McClelland M, et al. Solutions to emergency department boarding and crowding are under used and may need to be legislated. Health Affairs. 2012;31(8):1757-66.
39. Jones R. A&E performance and inpatient bed occupancy. British Journal of Healthcare Management. 2011;17(6):256-7.
40. Jones R. Medical bed occupancy and cancelled operations. British Journal of Healthcare Management. 2014;20(12): 594-5.
41. Jones R. A&E tipping points. British Journal of Healthcare Management. 2015;21(5):248-9.
42. Schull MJ, Vermeulen M, Slaughter G, et al. Emergency department crowding and thrombolysis delays in acute myocardial infarction. Annals of Emergency Medicine. 2004;44:577-85.
43. Pines J, Hollander J, Localio A, et al. The association between emergency
department crowding and hospital performance on antibiotic timing for pneumonia and percutaneous intervention for myocardial infarction. Academy of Emergency Medicine. 2006;13:873-8. 44. Pines J, Hollander J. Emergency
department crowding is associated with poor care for patients with severe pain. Annals of Emergency Medicine. 2008;51:1-5.
45. Fee C, Weber EJ, Maak CA, et al. Effect of emergency department crowding on time to antibiotics in patients admitted with community-acquired pneumonia. Annals of Emergency Medicine. 2007;50:501-9. 46. Braitberg G. Emergency department
overcrowding: Dying to get in? Medical Journal of Australia. 2007;187(11/12):624-5.
47. Carr B, Kaye A, Wiebe D, et al. Emergency department length of stay: A major risk factor for pneumonia in intubated blunt trauma patients. Journal of Trauma Injury and Infection Critical Care. 2007;63:9-12. 48. Chalfin D, Trzeciak S, Likourezos A, et al.
Impact of delayed transfer of critically ill patients from the emergency department to the intensive care unit. Critical Care Medicine. 2007;35:1477-83.
49. Bernstein S, Aronsky D, Duseja R, et al. The effect of emergency department crowding on clinically oriented outcomes. Academy of Emergency Medicine. 2008;16:1-10.
50. Liu S, Thomas S, Gordon J, et al. A pilot study examining undesirable events among emergency department-boarded patients awaiting inpatient beds. Annals of Emergency Medicine. 2009;54:381-5. 51. Liu S, Chang Y, Weissman J, et al. An
empirical assessment of boarding and quality of care: Delays in care among chest pain, pneumonia and cellulitis patients. Academy of Emergency Medicine. 2011;18:1339-48.
52. White B, Biddinger P, Chang Y, et al. Boarding inpatients in the emergency department increases discharge patient length of stay. J Emer Med. 2013;44:230-235.
53. Xu G, Whitaker E, Hubbard I. Inpatient elderly care: Reducing re-admission rates. British Journal of Healthcare Management. 2011;17(12):599–602.
54. Ye L, Zhou G, He X, et al. Prolonged length of stay in the emergency department in high acuity patients at a Chinese tertiary hospital. EMA. 2012;24: 634-640.
55. Cunningham J, Kernohan W, Rush T. Bed occupancy, turnover intervals and MRSA rates in English hospitals. British Journal of Nursing. 2006;15(12):656-60.
acute settings in Northern Ireland. Journal of Hospital Infection. 2005;61(3):189-93. 57. Gidney G. Infection control: A tool for
sustainable hospital design. University of Cambridge, UK. IDBE 12 Thesis; 2008. 58. Kaier K, Meyer E, Dettenkofer M, Frank U.
Epidemiology meets econometrics: Using time-series analysis to observe the impact of bed occupancy rates on the spread of multi-drug resistant bacteria. Journal of Hospital Infection. 2010;76:108-13.
59. Kaier K, Luft D, Dettenkoffer M, Kist M, Frank U. Correlations between bed occupancy rates and Clostridium difficile infections: A time-series analysis. Epidemiology and Infection. 2011;139:482-5.
60. Kaier K, Mutters N, Frank U. Bed occupancy rates and hospital-acquired infections – should beds be kept empty? Clinical Microbiology Infection. 2012;18: 941-5.
61. Waterhouse M, Morton A, Mengersen K, Cook D, Playford G. Role of overcrowding in methicillin-resistant Staphylococcus aureus transmission: Bayesian network
analysis for a single public hospital. Journal of Hospital Infection. 2011;78(2):92-96.
62. Howell E, Bessman Marshall R, Wright S. Hospitalist bed management effecting throughput from the emergency department to the intensive care unit. Journal Critical Care. 2010;25(2):184-9. 63. Utzolino S, Kaffarnik M, Keck T, Berlket M,
Hopt U. Unplanned discharges from a surgical intensive care unit: Readmissions and mortality. Journal Critical Care. 2010;25(3):375-81.
64. Vella V, Aylin P, Moore L, King A, Naylor N, et al. Bed utilisation and increased risk of Clostridium difficile infections in acute hospitals in England in 2013/14. BMJ Qual Saf; 2016.
DOI: 10.1136/bmjqs-2016-005250
65. Rae B, Busby W, Millard P. Fast-tracking acute hospital care – from bed crisis to bed crisis. Australian Health Review. 2007;31(1):50-62.
66. Jones R. Factors determining the need for single room accommodation in hospital. British Journal of Healthcare Management 2011;17(7):316-7.
67. Griffiths P, Ball J, Murrells T, Jones S, Rafferty A. Registered nurse, healthcare support worker, medical staffing levels and mortality in English hospital trusts: A
cross-sectional study. BMJ Open. 2016;6: e008751.
68. Jones R. Recurring outbreaks of an infection apparently targeting immune function, and consequent unprecedented growth in medical admission and costs in the United Kingdom: A review. Brit J Med and Medical Res. 2015;6(8):735-70. DOI: 10.9734/BJMMR/2015/14845
69. Jones R. Small area spread and step-like changes in emergency medical admissions in response to an apparently new type of infectious event. Fractal Geometry and Nonlinear Analysis in Medicine and Biology. 2015;1(2):42-54.
DOI: 10.15761/FGNAMB.1000110
70. Jones R. Is cytomegalovirus involved in recurring periods of higher than expected death and medical admissions, occurring as clustered outbreaks in the northern and southern hemispheres? British Journal of Medicine and Medical Research. 2016;11(2):1-31.
DOI: 10.9734/BJMMR/2016/20062
71. Jones R. The unprecedented growth in medical admissions in the UK: The ageing population or a possible infectious/immune aetiology? Epidemiology (Sunnyvale). 2016;6(1):1000219.
72. Jones R. Bed occupancy – the impact on hospital planning. British Journal of Healthcare Management. 2011;17(7):307-13.
73. Jones R. Volatility in bed occupancy for emergency admissions. British Journal of Healthcare Management. 2011;17(9):424-30.
74. Jones R. Bed occupancy, efficiency and infectious outbreaks. British Journal of Healthcare Management. 2015;21(8):396-7.
75. Jones R. Links between bed occupancy, deaths and costs. British Journal of Healthcare Management. 2015;21(11): 544-5.
76. Jones R. Bed management - Tools to aid the correct allocation of hospital beds. Presented at ‘Re-thinking bed management – Opportunities and challenges’. Harrogate Management Centre Conference, 27th January; 2003. Available:http://www.hcaf.biz/Hospital%20
Beds/Microsoft%20Word%20-%20Bed%20planning%20HMC.pdf (Accessed December 2015)
the 2004 Crystal Ball User Conference, June 16-18th, 2004. Denver, Colarado, USA.
Available:https://www.researchgate.net/pu blication/235950413_FINANCIAL_RISK_I N_HEALTHCARE_PROVISION_AND_CO NTRACTS
(Accessed December 2015)
78. Dunnigan M, Pollock A. Downsizing of acute inpatient beds associated with private finance initiative: Scotland’s case study. British Medical Journal 2003; 326(7395):905-10.
79. Hellowell M, Pollock A. Private finance, public deficits. A report on the cost of PFI and its impact on health services in England. Centre for International Health Policy, University of Edinburgh; 2007. 80. Hellowell M, Pollock A. Do PPPs in social
infrastructure enhance the public interest? Evidence from England’s National Health Service. Australian Journal of Public Administration. 2010;69(S1):S23-S34. 81. Palmer K, Groom C, Hopkins R, Novcic N.
Analysis of the causes of the Queen Elizabeth NHS Hospital Trust deficit. Cambridge Economic Policy Associates Ltd; 2006.
82. Pollock A, Shaoul J, Vickers N. Private finance and ‘value for money’ in NHS hospitals: A policy in search of a rationale? British Medical Journal. 2002;324(7347):1205-9.
83. Jones R. Building smaller hospitals. British Journal of Healthcare Management. 2009;15(10):511-2.
84. Jones R. Declining length of stay and future bed numbers. British Journal of Healthcare Management. 2015;21(9):440-1.
85. DeLia D. Annual bed statistics give a misleading picture of hospital surge capacity. Annals of Emergency Medicine. 2006;48(4):384-8.
86. DeLia D, Wood E. The dwindling supply of empty beds: Implications for hospital surge capacity. Health Affairs. 2008;27(6):1688-94.
87. Jones R. Benchmarking length of stay. British Journal of Healthcare Management. 2010;16(5):248-50.
88. Jones R. Length of stay efficiency. British Journal of Healthcare Management. 2009;15(11):563-4.
89. Jones R. Where next for overnight stay admissions, length of stay and bed days?
British Journal of Healthcare Management. 2016;22(9):475-7.
90. Jones R. Crafting efficient bed pools. Brit J Healthc Manage. 2009;15(12):614-6. 91. Jones R. Is length of stay a reliable
efficiency measure? Brit J Healthc Manage. 2015;21(7):344-5.
92. Charton J. The robustness of the London health planning consortium model. British Medical Journal. 1981;282:920-1
93. Seematter-Bagnoud L, Fustinomi S, Dung D, Santos-Eggimann B, Koehn V, Bize R, et al. Comparison of different methods to forecast hospital bed needs. European Geriatric Medicine. 2015;6(3):262-6. 94. Jones R. Myths of ideal hospital size.
Medical Journal of Australia. 2010;193(5): 298-300.
95. Jones R. Rising emergency admissions in the UK and the elephant in the room. Epidemiology (Sunnyvale): Open Access. 2016;6(4):1000261.
DOI: 10.4172/2161-1165.1000261
96. Jones R. Does hospital bed demand depend more on death than demography? British Journal of Healthcare Management. 2011;17(5):190-7.
97. Jones R. Factors influencing demand for hospital beds in English primary care organisations. British Journal of Healthcare Management. 2011;17(8):360-7.
98. Nicholl J. Case-mix adjustment in non-randomised observational evaluations: The constant risk fallacy. J Epidemiol Community Health. 2007;61(11):1010-3. 99. Jones R. Are emergency admissions
contagious? British Journal Healthcare Management. 2015;21(5):227-35.
100. Jones R. Unexpected single-year-of-age changes in the elderly mortality rate in 2012 in England and Wales. British Journal of Medicine and Medical Research. 2014;4(16):3196-207.
DOI: 10.9734/BJMMR/2014/9072
101. Marjot D. Estimating hospital bed numbers. Bulletin of the Royal College of Psychiatrists. 1987;11:432-4.
102. Harper P, Shahani A. Modelling for the planning and management of bed capacities in hospitals. Journal of Operational Research. 2002;53:11-8. 103. De Bruin A, Bekker R, van Zanten L, Koole
G. Dimensioning hospital wards using the Erlang loss model. Annals of Operational Research. 2010;178:23-43.
review. Operational Research in Healthcare. 2013;2:25-39.
105. Dexter F, Macario A. Optimal number of beds and occupancy to minimise staffing costs in an obstetrical unit? Canadian Journal of Anaesthesia. 2001;48(3):295-301.
106. Lamiell J. Modelling intensive care unit census. Military Medicine. 1995;160(5): 227-32.
107. Jones R. A simple guide to a complex problem – maternity bed occupancy. British Journal of Midwifery. 2012;20(5): 351-7.
108. Jones R. Financial risk in healthcare provision and contracts. Proc. Crystal Ball User Conference, Denver, USA; 2004. Available:http://www.hcaf.biz/Financial%20 Risk/CBUC_FR.pdf
(Accessed September 2016)
109. Baker L, Phibbs C, Supina D, Reynolds J. Uncertain demand and economics of scale in hospitals. Abstract: Book Association Health Services Research Meeting. 1999;16:44.
Available:Gateway.nlm.nih.gov/MeetingAb stracts/102194535.html
(Accessed December 2015)
110. Davis G, Lowell W. Using artificial neural networks and the Gutenberg-Richter power law to “Rightsize” a behavioural health care system. American Journal of Medical Quality. 1999;14(5):13-24.
111. Fullerton K, Crawford V. The winter bed crisis – quantifying seasonal effects on hospital bed usage. Q J Medicine. 1999;92:199-206.
112. Hartwig S, Uhari M, Renko M, Bertet P, Hemming M, Vesikari T. Hospital bed occupancy for rotavirus and all cause acute gastroenteritis in two Finnish hospitals before and after the implementation of the national rotavirus vaccination program with RotaTeq. BMC Health Services Research. 2014;14:632. 113. Allder S, Silvester K, Walley P.
Understanding the current state of patient flow in a hospital. Clinical Medicine. 2010;10(5):441-4.
114. Wheeler D, Chambers D. Understanding statistical process control, 2nd edition. SPC Press, Knoxville, Tennessee; 1992. 115. Allan T. Seasonal variation in health and
disease: A bibliography. London: Mansell Publishers Ltd; 1994.
116. Fleming DM, Norbury CA, Crombie DL. Annual and seasonal variation in the
incidence of common diseases. London: Occasional Papers Royal College General Practice. 1991;53:1-24.
117. Upshur R, Moineddin R, Crighton E, Kiefer L, Mamdani M. Simplicity within complexity: Seasonality and predictability of hospital admissions in the province of Ontario 1988-2001, a population-based analysis. BMC Health Services Research 2005;5:13.
118. Pascual M, Dobson A. Seasonal patterns of infectious disease. PLOS Medicine. 2005;2(1):e5.
119. Damiani M, Dixon J. Managing the pressure: Emergency hospital admissions in London, 1997-2001. London: King’s Fund; 2001.
120. Kelly-Hayes M, Wolf P, Kase C, Brand F, McGuirk J, D’Agostino R. Temporal patterns of stroke onset: The Framingham study. Stroke. 1995;26:1343-7.
121. Schwartz J, Samet J, Patz J. Hospital admissions for heart disease: The effects of temperature and humidity. Epidemiology. 2004;15(6):755-61.
122. Dominici F, Peng R, Bell M, Pham L, McDermott A, Zeger S, Samet J. Fine particulate air pollution and hospital admission for cardiovascular and respiratory diseases. Journal of the American Medical Association. 2006; 295(10):1127-34.
123. Dopico X, Evangelou M, Ferreira R, Guo H, Pekalski M, Smyth D, Cooper N, et al. Widespread seasonal gene expression reveals annual differences in human immunity and physiology. Nature Communications. 2015;6:7000.
124. Jones R. A paradigm shift for bed occupancy. British Journal of Healthcare Management. 2011;17(8):376-7.
125. NHS Monitor. A&E delays: Why did patients wait longer last winter? 2015. Available:https://www.gov.uk/government/ uploads/system/uploads/attachment_data/f ile/458764/AE_delay_main_report_final.pd f
(Accessed December 2015)
126. Jones R. The NHS England review of urgent and emergency care. Brit J Healthc Manage. 2013;19(8):406-7.
127. Jones R. Average length of stay in hospitals in the USA. Brit J Healthc Manage. 2012;19(4):186-91.
![Fig. 1. Change in available acute bed numbers from one year to the next (England) https://www.england.nhs.uk/statistics/statistical-work-areas/bed-availability-and-occupancy/bed-data-overnight/ [6]](https://thumb-us.123doks.com/thumbv2/123dok_us/1722827.1219635/4.612.100.515.92.376/available-numbers-england-statistics-statistical-availability-occupancy-overnight.webp)