R E S E A R C H
Open Access
5.9 GHz inter-vehicle communication at
intersections: a validated non-line-of-sight
path-loss and fading model
Thomas Mangel
1*, Oliver Klemp
1and Hannes Hartenstein
2Abstract
Inter-vehicle communication promises to prevent accidents by enabling applications such as cross-traffic assistance. This application requires information from vehicles in non-line-of-sight (NLOS) areas due to building at intersection corners. The periodic cooperative awareness messages are foreseen to be sent via 5.9 GHz IEEE 802.11p. While it is known that existing micro-cell models might not apply well, validated propagation models for vehicular 5.9 GHz NLOS conditions are still missing. In this article, we develop a 5.9 GHz NLOS path-loss and fading model based on real-world measurements at a representative selection of intersections in the city of Munich. We show that (a) the measurement data can very well be fitted to an analytical model, (b) the model incorporates specific geometric aspects in closed-form as well as normally distributed fading in NLOS conditions, and (c) the model is of low complexity, thus, could be used in large-scale packet-level simulations. A comparison to existing micro-cell models shows that our model significantly differs.
1 Introduction
Vehicular communication is envisioned to increase range and coverage of location and behavior awareness of vehicles, thus enabling highly developed pro-active safety systems.
The idea is that all vehicles communicate information like position, speed, and heading periodically to other vehicles in cooperative awareness messages to enable the derivation of an environment picture, used as basis
for movement prediction. An ad hoccommunication
technology working on 10 MHz wide frequency bands centered around 5.9 GHz in the U.S./Europe is in devel-opment. Medium and physical access is standardized as IEEE 802.11p [1].
For this radio technology, cross-traffic assistance at inner city intersections is one of the most challenging use cases. It needs to monitor two spatial dimensions and is very sensitive to heading estimation inaccuracies [2], thus implying the need for high information update rates. At the same time, the corners at inner city inter-sections will often be occupied by buildings. They can
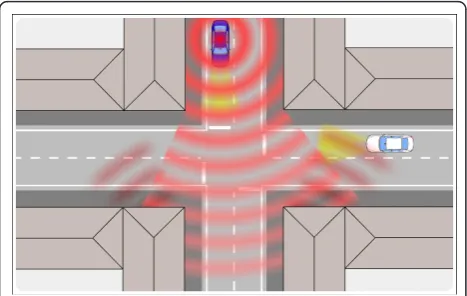
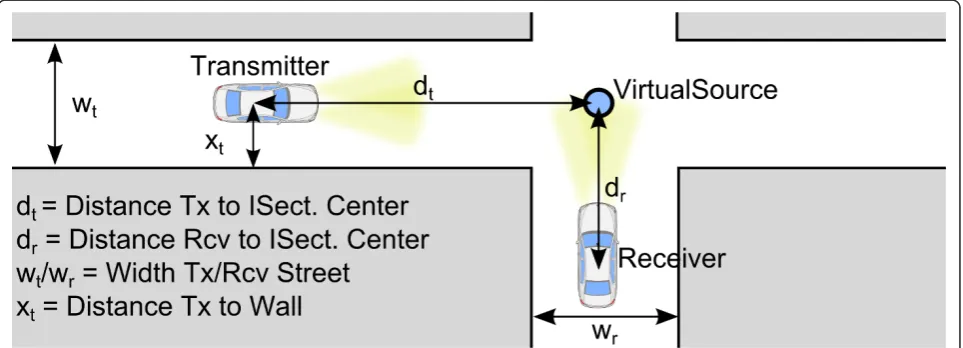
block the radio line-of-sight (LOS). If the LOS is blocked, diffraction, reflection, and refraction of radio waves can enable non-line-of-sight (NLOS) reception (Figure 1). But, the relatively high frequency of 5.9 GHz and a difficult radio fading environment might compli-cate the NLOS reception of packets.
Our analysis of building locations at intersections in the city of Munich [3] showed a need for NLOS recep-tion: If two cars are approaching an intersection with 50 km/h, only 30% of all intersection corners provide LOS at a desired warning point of 3 s [4,5] to a potential impact (≈ intersection center). While road side units (RSU) might re-broadcast messages and reduce the need for NLOS reception, urban street crossings with sparse traffic are likely not to be equipped with a dedicated RSU. Such scenarios require robust signal transmission between vehicles approaching a crossing. These situa-tions predominantly exhibit NLOS radio link condisitua-tions between vehicles, motivating to investigate NLOS reception.
First measurements on 5.9 GHz NLOS reception were done with channel sounders in [6] and with off-the-shelf radios in [7-10]. While showing that NLOS reception is generally feasible, they did not investigate the influence of factors like building placement on reception quality.
* Correspondence: [email protected] 1
BMW Group Research and Technology, Hanauer Straße 46, 80992 München, Germany
Full list of author information is available at the end of the article
Also, all of them lack a systematic and representative test site selection, questioning the generalizability of results. NLOS path-loss models were–albeit simplistic– deduced in [9,10].
While NLOS models related to vehicle-to-vehicle (V2V) communication exist in cellular research–for below roof-top base stations [11-16], those were only validated at lower frequencies (0.9-2.1 GHz) and higher transmitter heights (3-4 m). Therefore, a validated 5.9 GHz NLOS model for V2V communication is still missing.
To gain more insight about 802.11p NLOS reception properties, we performed an extensive field test, specifi-cally targeted to measure the quality of NLOS reception and to characterize propagation [17]. Special attention was paid to a well-founded selection of representative test cases and to find a test setup that allows for the derivation of predominant influence factors such as inter-building distance. A comparison of the data to the existing cellular models showed that they cannot be properly applied in the intended scenario.
In consequence, we developed–based on the measure-ment data–a specific 5.9 GHz NLOS propagation model for inter-vehicle communication. The proposed path-loss and fading model is intended to be used in packet level load simulations.
The article is organized as follows: our measurements will be presented in Section 2. Subsequently, we will deduce the NLOS path-loss model, called VirtualSour-ce11p, and characterize NLOS small-scale fading in Sec-tion 3. Afterwards, we will compare our model to existing models in Section 4.
2 NLOS reception measurement campaign
Proper measurements are inevitable to judge existing models and deduce our new specific one. Therefore, a summarization of our measurements as published in [17] is provided here.
2.1 Test design
We used off-the-shelf radios to measure the channel in terms of per packet reception power values. While radios cannot provide detailed insight into the impulse response of the channel such as channel sounders do, the collected data provide the same per packet generali-zation as packet level simulators assume. With respect to limitations in reproducibility and traffic synchroniza-tion, we opted against a setup with two vehicles inde-pendently moving against each other. Our solution is a discretization of the transmitter (tx) position, with the receiver (rcv) driving on the crossing street. Conse-quently, we split the dimensiontx↔rcvinto tx↔center (of intersection) and center↔rcv. The measurement design is visualized in Figure 2, showing the fixed trans-mitter and moving receiver vehicle. By default, we tested twotx↔center distances on each side street, 30 and 60 m to the center, corresponding to 2 and 4 s to center at 50 km/h. An additional position near the intersection center (0 m) was tested for LOS comparison.
2.2 Used hardware
The receiver was integrated into a BMW 5 Series GT. GPS information was taken from the CAN bus, provid-ing a high accuracy position (GPS data are enhanced by vehicle sensor data and map matching). A tripod with 35 × 35 cm metal plate at a height of 1.45 m was used as the transmitter mount as it is well placeable. Also, a vehicle would have blocked other traffic.
We used a LinkBird-MX V3 [18] 802.11p communica-tion box by NEC containing two DCMA-82-N1 Mini-PCI cards with Atheros 802.11 radio chips. To resemble a close-to-production system, we used small low-profile puck antennas from Nippon Antenna. They provide a gain of 0 dB at 0° (= horizon) and +5 dB at 15°. Each antenna cable inherits a loss of 2.4 dB. These values are according to the corresponding data sheets.
2.3 Systematic intersection selection
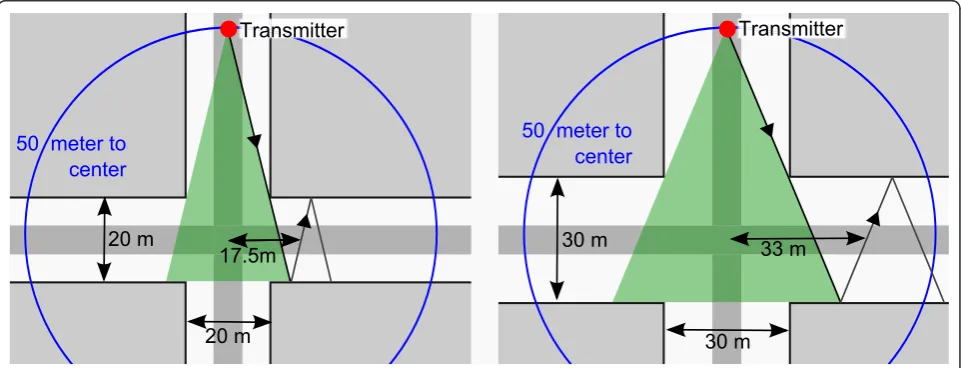
The urban canyon micro-cellular NLOS models predict the influence of geometrical aspects, probably most important of the inter-building distance in a side street (≡ side street width). The general assumption is: the smaller this distance, the less power in NLOS in the crossing street. An intuitive explanation of this observa-tion–a better view into the side street–is visualized in Figure 3. We intended to verify this observation by selecting intersections with the same as well as with dif-fering width.
To achieve generalizable results, a prototype intersec-tion ("Main Case”) was defined as found by clustering in [3], whose geometry is representative for ≈50% of all traffic intersections in Munich. Those intersections exhi-bit an inter-building distance between 20 and 25 m in
each side street. Intersections with 90° angles were selected for comparability. Since the classification is based on nearest building vertex, and front gardens (with bushes and trees) can further limit the field of view, we suspected suburban intersections to provide worse reception conditions at similar distances into the crossing street compared to urban ones. To be able to check the influence, we selected three suburban and one urban ones with the“Main Case” dimensions, identified by ID 1, 2, 3 and 10 in Table 1.
To check the influence of street width, we selected one urban intersection with 30 m width (ID 20), and another in-between (ID 11). A really wide one (ID 21) and one with only two occupied corners (ID 9) com-plete the selection.
2.4 Parameters, evaluation and results
We tested, in general, with 3 Mbps and 20 dBm trans-mission power. The transtrans-mission frequency was 100 Hz and payload 200 Bytes. With headers, packets had a size of 258 Bytes.
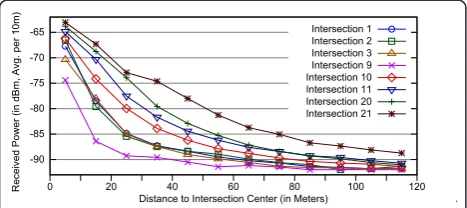
The transmitter positioning and test of 4-leg intersec-tions leads to 20 runs for a typical tested intersection (see Figure 2). In total, we tested 71 tx-positions and performed ≈170 runs. Table 2 shows an overview of the resulting setup. We generated reception power/rate ver-sus rcv↔center distance plots and a map-based result visualization for each run, available at [19]. One of those plots is shown in Figure 4. Averaged results over back/ forth run showed that for one tx↔centerdistance, the results from all four side streets are mostly very similar,
Figure 2Test design. Transmitter positioned at discrete distance to center. Receiver driving on crossing street. Example shows transmitter positions in one street-leg. We tested with transmitter placed in all four legs.
as can be seen in Figure 5. Therefore, we also produced intersection wide averages per tx↔centerdistance. For 60 mtx↔centerdistance, they are visualized in Figure 6. Figure 6 shows that intersections with same street width and setting (suburban intersections 1, 2, 3) exhibit the same performance, and that path-loss decreases with increased street width (compare urban intersections 10, 11, 20, and 21 with increasing width). Suburban inter-sections have an estimated 3-4 dB less rcv-power com-pared to urbans with same width (urban intersection 10 against suburban 1, 2, 3). In general, NLOS reception is well feasible, with 50% or more reception rate at 50 m to center for transmitter and receiver.
3 NLOS propagation model development
Subsequent, we deduce a specific vehicular 5.9 GHz
NLOS path-loss model–VirtualSource11p–from the
measurements and characterize small-scale fading in NLOS areas.
3.1 Data quality and system loss
To deduce path-loss and fading from an of-the-shelf radio, it needs to provide reliable reception power values. We got per packet reception power values with 1 dBm resolution via the level value in theiw_statistics.
iw_quality struct from a SIOCGIWSTATSsocket call. Measured values equal to the reported values in iwcon-fig and the Linkbird wlan11p tool. Observed values range between -5 and -92 dBm. This corresponds well to the reception sensitivity of -92 as reported in data sheets such as [20]. Figure 7 shows the good quality of the reported power values over time for two exemplary 20 m street stretches. Differences in small-scale fading between NLOS and LOS are clearly visible. The result-ing power histograms (compare Figure twelve in later Section 3.3) show very reasonable results too. More of these detailed plots are available at the website [19] cov-ering this work.
There was only one issue: power histograms revealed that there are no packets reported with -69, -68 and -67 dBm. A figure illustrating this can be seen on the web-site [19]. The same gap can be seen in [21]. We believe that the chipset changes its sensitivity in this power range, and reports values above -69 dBm by 3 dB too strong. We corrected this by subtracting 3 dB from all reported values >-69 dBm. The reported reception sensi-tivity was not changed by the correction.
Table 1 Tested intersections
ID Streets Center lat/lon Street width Description
1 Pommer/Konstanzer 48.184, 11.560 23 m, 21 m Suburban (main case) 2 Himmelschlüssel/Josef-Seifried 48.195, 11.532 23 m, 19 m Suburban (main case) 3 Tizian/Kratzer 48.162, 11.525 ≈21 m Suburban (main case)
10 Agnes/Teng 48.158, 11.569 24 m, 21 m Urban (main case)
11 Perlach/Untersberger 48.110, 11.586 27 m, 22 m Urban increased width 20 Klug/Waisenh. 48.164, 11.529 ≈30 m Urban high street width
21 Hanauer/Gneisenau 48.179, 11.529 55 m, 30 m Urban very wide, non-regular shape 9 Gotebold/Driesch 48.179, 11.442 18 m Suburban, buildings at only two corners 100 Free Space, Country Road 48.247, 11.348 One street, no buildings, no trees, etc.
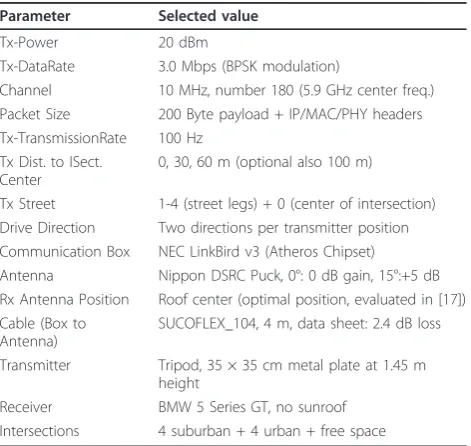
Table 2 NLOS reception testing configuration
Parameter Selected value
Tx-Power 20 dBm
Tx-DataRate 3.0 Mbps (BPSK modulation)
Channel 10 MHz, number 180 (5.9 GHz center freq.) Packet Size 200 Byte payload + IP/MAC/PHY headers Tx-TransmissionRate 100 Hz
Tx Dist. to ISect. Center
0, 30, 60 m (optional also 100 m)
Tx Street 1-4 (street legs) + 0 (center of intersection) Drive Direction Two directions per transmitter position Communication Box NEC LinkBird v3 (Atheros Chipset) Antenna Nippon DSRC Puck, 0°: 0 dB gain, 15°:+5 dB Rx Antenna Position Roof center (optimal position, evaluated in [17]) Cable (Box to
Antenna)
SUCOFLEX_104, 4 m, data sheet: 2.4 dB loss
Transmitter Tripod, 35 × 35 cm metal plate at 1.45 m height
Receiver BMW 5 Series GT, no sunroof Intersections 4 suburban + 4 urban + free space
We measured received power, where in dBm space: RxPower = Txpower - SystemLoss - PathLoss. To deter-mine path-loss, we need to know system loss. The
cables lead to a combined loss of ≈ 4.8dB and the
antennas to a gain of two times some value between 0 (0°) and 5 dB (15°).
To determine the average loss, we took the LOS mea-surements from most intersections (excluding free space, special case 9, and 1) and determined the devia-tion between average power curve and the theoretical limit. The fit equation used is
LogDist(x) =Ptx−LS−PLref−10∗EL∗log10 FitDimensions :LS = SystemLoss,EL = LossExponent.
It comprises the common Log Distance model and free space path loss (FSPL) for determination of refer-ence loss. Unfortunately, curve attenuation interferes with slope variation. Therefore, three fits were per-formed (Variable, SL = 0, LE = 2). Figure 8 visualizes fit input and results. We limited the fit input to 20 <x < 150 m, as packet loss occurred at x< 150 m and small distances are inaccurate as the transmitter was not exactly positioned in intersection centers.
The fit reveals a loss of 2.75 dB with LE = 2. With SL = 0, it shows a loss exponent of 2.1, being higher as in FSPL. Subsequently, we will assume 1.75 dB system loss,
as revealed by fitting both variables. The resulting aver-age gain of 1.5 dB per antenna seems realistic, given its characteristic. Note that such loss determination absorbs the problem that real transmitted power might slightly differ from the configured value.
3.2 NLOS path-loss model development
To determine path-loss with respect to variable street-width and suburban/urban differences, we fit the inter-section wide average power distance curves of multiple intersections (such as in Figure 6) to a unified path-loss equation. The basis for our fit equation is the cellular model proposed in [14]. The original VirtualSource equation (as given in [14], but indices modified to Fig-ure 9 and as positive path-loss in dB) is
PathLoss =
The model takes the distance of transmitter and recei-ver to intersection center (dtand dr), receiver street width (wr), and distance of transmitter to wall (xt) as input. Last two values reflect building position influence. Adaption to differing streets is enabled by a street para-meter (a). A higher loss is present at high rcv-distances (due to a diffraction, rather than reflection predomi-nance), determined by a break even distance (db).
The geometric input parameters dt, dr, wr, hr, ht, and
xt are given by the measured data. Therefore, we first fitted the path-loss exponent and a. As both are fitted globally, arepresents a relative shift of the fitting curve.
Figure 5Three step evaluation–part 2. Back-forth run averaged. Transmitter street comparison, intersection 10, 60 mtx↔center
distance.
Figure 6Three step evaluation–part 3. Intersection comparison, intersection wide average pertx↔centerdistance (here 60 m).
These first fits showed that especially the influence of street width wris not properly reflected by the existing equation. Therefore, we replaced the fixed factor2π/. forxtwr by a fittable exponent. Asdtalso influences the “view”and therefore energy into a crossing street, it was also made fittable. A suburban loss factor was added to incorporate the observation of less power in suburban scenarios from Section 2.4. The following fit equation (in dBm) was found:
RxPower =Ptx−SystemLoss−PathLoss PathLoss := VirtualSource11p(dr,dt,wr,xt,is) =
C+isLSU+ 10 log10 ⎛ ⎝
dET
t
(xtwr)ES
4πdr
λ
EL⎞ ⎠
Fit Dimensions :C= CurveShift,LSU= SubUrbanLoss,
EL= LossExponent,ES= StreetExp.,ET= TxDistExp.
Valueisis specifying suburban (is = 1) or urban (is=
0). As db ≈ 180 m for our setup, which exceeds the
Figure 8Determination of system loss by theory comparison.
highest distancedrwith reception, thedr>dbequation is of no use for the fitting.
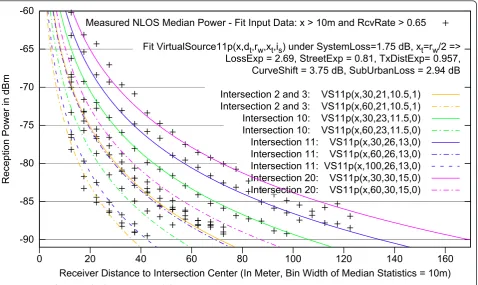
The final fit to determine the five variable parameters is visualized in Figure 10. We fitted the intersection wide average median reception power per tx-distance curve. Each of these curves abstracts (averages) eight measurements, thus providing a stable input to the fit and keeping the complexity on a moderate level. We showed in [17] that this averaging is viable, as the per-formance is very similar despite the transmitter being in the different side streets.
The fit input values are form the regular shaped (≈90° and wt≈wr) intersections with buildings at each corner: intersection 2, 3, 10, 11, and 20, withwr being 21, 21, 23, 26 and 30 m, respectively, and intersection 2 and 3 havingis= 1. The fitted measurements havedtvalues of 30 and 60 m (plus 100 m for intersection 11).
Each input value (visualized as a cross in Figure 10) is complemented by the reception rate in the bin and the intersection widewr andisvalues as input to the equa-tion and for pre-selecequa-tion.wris set towt+wr
2 aswtandwr were selected similar per intersection and we fit inter-section wide average values. System loss is set to 1.75 dB andxt = w2r(as this dimension was not tested).
We did not fit intersection 1, 9, and 21 due to differ-ing reasons: intersection 1 was the very first tested
inter-section. Here, we measured with alternating
transmission power (20 dB, 10 dB) and rate (3 Mbps, 6 Mbps) in each second. In consequence, there are spatial gaps in the data for each of the four configurations, leading to empty bins at the 5 m bin width in the fit. Anyhow, the performance is very close to intersection 2 and 3, as shown in [17]. Intersection 9 has missing reflection facades. This dimension was not incorporated in the fit, as it would have complicated the fit by another dimension. Furthermore, we only tested one intersection of such type (as it is rare), leading to insuffi-cient data to provide a reliable fit in this additional dimension. Intersection 21 was excluded due to two rea-sons: First, one of the street legs has a non 90° angle. Second, the inter-building distance in the two streets differs a lot (55 m against 30 m). It is questionable whether the averaging over the four side street simplifi-cation is applicable for this particular intersection. Despite the exclusion of these three intersections, the fit covers 11 data rows from five intersections, stemming from 88 test-runs.
We fitted the median reception power curve, as it is more stable at lower reception rates. The average recep-tion power curve suffers (bin values are too high) from incomplete data as soon as the reception rate sinks below 1.0. The median is technically accurate as long as reception rate is greater than 0.5. However, due to small-scale fading leading to variations and potential
!"#$%!&'( !)*+,&!-)./001
-2)3&) /"""/"()&4+'1"/'5'0 +6/'1"&6/'1"7/6/'1" )&$%'81"&)9:9+'1
8.2& /"8""1"( 8.2& /"""1"( .2& /"8"8"1"( .2& /""8"1"( .2& /"8""8"( .2& /"""8"( " " " " ( .2& /"""8"( .2& /"8"8""( .2& /""8""(
measurement inaccuracies around the reception thresh-old of the radio, median values also turn out to be slightly too high at reception rates close to 0.5. This is visible in plots. To prevent a negative influence on the fit, an exclusion criterion of reception-rate >0.65 was selected.
We also excluded small distances to center, as they are in LOS. The root mean square (RMS) error of the fit showed thatx > 10 m is a good exclusion criterion: RMS error decreases from 2.4 withx> 0 to 0.8 withx> 10, but not much further with higherx. The very low RMS error of 0.8 corresponds to the good fit quality (compare input values to resulting model curves in Fig-ure 10). The resulting VirtualSource11p path-loss equa-tion, as determined by the fit, is
VirtualSource11p(dr,dt,wr,xt,is) = 3.75 +is2.94
Despite the no available measurement data for highdr
distances, an increased loss at high distances (dr >db) due to diffraction rather than reflection being dominant is incorporated (as in [11,12,14,15]).
Note that close to intersection center, loss is really low (similar to FSPL having a heavy slope close to 0). Figure 11 depicts a representative example for intersection 10. In consequence, the VirtualSource11p path-loss equa-tion only applies to NLOS condiequa-tions and not to the complete crossing street. At LOS on the crossing street, either the normal LOS path-loss should be used with distance asdt+dror a percental value between LOS at intersection center and NLOS value at the first point of NLOS. The latter is potentially more accurate.
3.3 NLOS small-scale fading classification
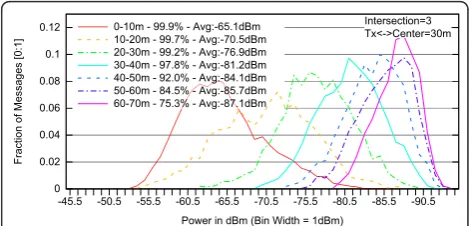
Small-scale fading leads to a distribution of power values around an average value. Figure 12 shows the dif-ferent power probability distributions of received
packets for different distances to the center in suburban intersection 3. It reveals e.g. a high variation in the 10-20 m bin as it includes LOS and NLOS conditions, or a variance limitation due to failed receptions (measure-ment limitation) for larger distances.
To determine fading in NLOS conditions, we centered the power probability distribution curves to their aver-age and compared curves from different intersections for a certain street stretch in NLOS. Figure 13 shows the curves for dt= 30 m and bin 40-50 m. This stretch exhibits NLOS conditions for all intersections and is in most cases (except probably intersection 2) not influ-enced by the radio reception limit. The curves from dif-ferent intersections show a very similar shape. While they fit well to both, Nakagami-m and the Normal Dis-tribution, the RMS error is slightly smaller for the Nor-mal Distribution. Using visual judgment, they clearly match the Normal Distribution better. Therefore, we propose to model fading in NLOS as a normal distribu-tion withs= 4.1 dB.
For LOS conditions, we were able to verify that a 5.9 GHz vehicular channel is properly modeled by the often assumed Nakagami-m = 1 distribution. The correspond-ing fit is given in Figure 14. It reveals a good visible match to the Nakagami curve with fittedm= 1.05.
Figure 11Power over distance–measurements and model.
Figure 12Power distribution in different distances to center in NLOS.
4 Path-loss model comparison
In this section, we compare our model to previously proposed NLOS models. One was measured under Car2X conditions at 790 MHz, the rest are micro-cellu-lar models for urban street canyons where base stations are typically located inside street canyons, for example at signal lights. Note that we do not compare with the models in [9,10], as they do not take important influ-ence factors such as street-width into account.
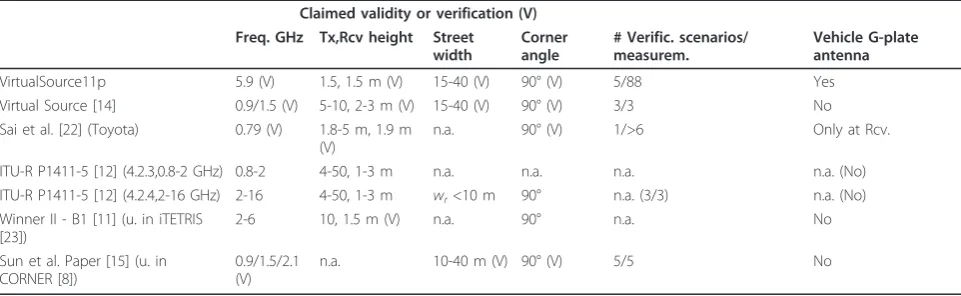
The models and their claimed validity (or verification setup) are given in Table 3. A model based on car to infrastructure measurements at 790 MHz was proposed in [22] by Toyota staff. Two different micro-cellular models are provided in the ITU-R P1411-5 recommen-dation for planning of short range communication sys-tems [12]; one in section 4.2.3 for 0.8-2 GHz, the other in 4.2.4 for claimed 2-16 GHz and low height terminals, but receive street width wr limited to <10 m. The sec-ond model seems to be based on [13]. Another urban micro-cell model stems from the WINNER II propaga-tion measurement project [11]. It has been selected in the iTETRIS EU-project [23] to model urban 5.9 GHz V2V communication by adapting the frequency and transmitter height. At last, [15] is an analytical model based on propagation theory as used in ray-tracing. It
was used in a re-parameterized way in the CORNER 5.9 GHz V2V simulation implementation proposed in [8].
All models except the second ITU-R model are only specified for up to 2 GHz and ht > 4 m. Also, those models are not based on measurements with vehicular ground plate antennas as in our measurements, except the receiver side in [22]. In iTETRIS, the model was not verified with the new environment parameters; in COR-NER only very briefly. Our model was derived from measurements in 5 intersections and 11 loss-curves, based upon 88 test runs.
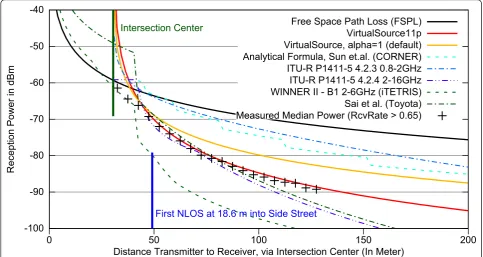
We implemented all path-loss equations in gnuplot to compare them against our inter-vehicle measurements and the proposed VirtualSource11p model. Figure 15 shows the resulting received power when configured same as our measurements in intersection 10 with
tx↔center distancedt= 30 m. All models are configured with their proposed default configuration. It can be seen that the models selected in CORNER and iTETRIS dif-fer to our measurements by 10 dB and more in critical NLOS areas. Only the P1411-5 2-16 GHz and the Toyota model come close to the measurements in this scenario. Note that the very low path-loss of the Toyota model in LOS is a strange behavior of their formula when parameterized to 5.9 GHz; at specified 0.79 GHz, the curve is just below FSPL.
Obviously, the VirtualSource11p model shows a very good accordance to measurements due to its fitting based development. Comparisons to the other tested scenarios reveal similar results and show that our model especially follows changes in the street width better than the P1411-5 2-16GHz and the Toyota model.
5 Conclusion
With VirtualSource11p, we present a well validated, low complexity NLOS path-loss model for 5.9 GHz V2V communications at intersections. It was deduced from data collected in an extensive measurement campaign, specifically targeted to measure NLOS reception quality.
Figure 14LOS fading determination. Power distribution around average for receptions in 40-50 m to intersection center.
Table 3 Street canyon NLOS model comparison
Claimed validity or verification (V) Freq. GHz Tx,Rcv height Street
width
A founded selection of test intersections enabled to quantify the influence of inter-building distance and suburban/urban differences in a single path-loss equa-tion with only a few simple geometric input-values.
Due to its fitting-based generation, the equation cor-responds well to measurement data in different scenar-ios, especially with changing inter-building distances. In contrast, existing street canyon NLOS path-loss models for micro-cellular environments at lower fre-quencies differ mostly substantially from the
measure-ments when parameterized to 5.9 GHz V2V
communication. Of course, our model is also limited in its validity to the measurement environment it is based on. While we certainly did not cover every spe-cial case, we selected the test intersections as represen-tative as possible, building upon an own building positioning investigation [3]. To the best of our knowl-edge, this is a novel approach and has not been done before.
In addition to path-loss, we investigated NLOS fad-ing, finding a normal distributed power variation around average. In conclusion, this article provides a well-founded general framework to include NLOS propagation conditions into packet level simulations of 5.9 GHz inter-vehicle communication, thus enabling large-scale load simulations in intersection environments.
Acknowledgements
The authors wish to thank Matthias Michl, who worked with us at the underlying measurements during his Bachelor Thesis.
Author details
1BMW Group Research and Technology, Hanauer Straße 46, 80992 München, Germany2Decentralized Systems and Network Services Research Group, Karlsruhe Institute of Technology, 76128 Karlsruhe, Germany
Competing interests
The authors declare that they have no competing interests.
Received: 14 July 2011 Accepted: 23 November 2011 Published: 23 November 2011
References
1. IEEE Standards Association, IEEE P802.11p/D11.0, Draft Part 11: WLAN MAC and PHY Specifications: Wireless Access in Vehicular Environments (WAVE). 2. G Nitz, F Klanner, Evaluation of Advanced Driver Assistance Systems For
Supportive Brake Application. inProceedings of FISITA 2008 World Automotive Congress, Munich 2008
3. T Mangel, F Schweizer, T Kosch, H Hartenstein, Vehicular Safety Communication at Intersections: Buildings, Non-Line-Of-Sight and Representative Scenarios. in8th International Conference on Wireless On-Demand Network Systems and Services(WONS), Bardonecchia (2011) 4. INTERSAFE-2 - An FP7 Project Funded By The EUROPEAN COMMISSION,
User Needs and Operational Requirements for a Cooperative Intersection Safety System - Deliverable D3.1. (2009)
5. TRL Limited on behalf of the EU Commission, Automated Emergency Brake Systems: Technical requirements, costs and benefits. (2008)
6. J Karedal, F Tufvesson, T Abbas, O Klemp, A Paier, L Bernado, AF Molisch, Radio Channel Measurements at Street Intersections for Vehicle-to-Vehicle Safety Applications. in2010 IEEE 71st Vehicular Technology Conference(2010) 7. R Miucic, T Schaffnit, Communication in Future Vehicle Cooperative Safety
Systems: 5.9 GHz DSRC Non-Line-of-Sight Field Testing. SAE International Journal of Passenger Cars-Electronic and Electrical Systems.2, 56 (2009)
!" #$
! %&'("%&($)*+&*
)*+&*+',"-*+$ .+/+%*+&*0+0"!123$ 4 0050678 4 00 678 9 223 678"3 &$ &+0"/$ #*#":0$
%2(1&0&&
8. E Giordano, R Frank, G Pau, M Gerla, CORNER: a Realistic Urban Propagation Model for VANET. inWireless On-demand Network Systems and Services1–4 (2010)
9. C Sommer, D Eckhoff, R German, F Dressler, A Computationally Inexpensive Empirical Model of IEEE 802.11p Radio Shadowing in Urban Environments. in8th International Conference on Wireless On-Demand Network Systems and Services,WONS, Bardonecchia (2011)
10. M Schack, J Nuckelt, R Geise, L Thiele, T Kurner, Comparison of path loss measurements and predictions at urban crossroads for C2C
communications. in5th European Conference on Antennas and Propagation (EUCAP), 2896–2900 (IEEE, Rome, 2011)
11. WINNER, D1.1.2 V1.1 - WINNER II Communication Models. (2007) 12. ITU-R, Recommendation ITU-R P.1411-5: Propagation data and prediction
methods for the planning of short-range outdoor radio communication systems and radio local area networks in the frequency range 300MHz to 100 GHz. ITU-R Rec (2009)
13. V Erceg, S Ghassemzadeh, M Taylor, L Dong, DL Schilling, Urban/Suburban Out-of-Sight Propagation Modeling. IEEE Communications Magazine.30(6), 56–61 (1992). doi:10.1109/35.141584
14. HM El-Sallabi, Fast path loss prediction by using virtual source technique for urban microcells. inIEEE 51th Vehicular Technology Conference - VTC 2000-Spring2183–2187 (2000)
15. Q Sun, S Tan, K Teh, Analytical formulae for path loss prediction in urban street grid microcellular environments. IEEE Transactions on Vehicular Technology 1251–1258 (2005)
16. L Denegri, L Bixio, F Lavagetto, A Iscra, C Braccini, An Analytical Model of Microcellular Propagation in Urban Canyons. inIEEE 65th Vehicular Technology Conference - VTC2007-Spring(2007)
17. T Mangel, M Michl, O Klemp, H Hartenstein, Real-World Measurements of Non-Line-Of-Sight Reception Quality for 5.9GHz IEEE 802.11p at
Intersections. in3rd International Workshop on Communication Technologies for Vehicles (Nets4Cars), Oberpfaffenhofen, Munich, Germany (2011) 18. NEC, NEC LinkBird-MX V3 Version 3 - Datasheet.
19. T Mangel, Website to this article: Complete measurement evaluation (all plots and map based) and interactive model. http://dsn.tm.kit.edu/ download/bmw/nlos_model/
20. dd-wrt.com: Mini-PCI WiFi Module: DCMA-82 http://www.dd-wrt.com/shop/ catalog/pdf/dcma82.pdf
21. R Miucic, Z Popovic, SM Mahmud, Experimental characterization of DSRC signal strength drops. in12th International IEEE Conference on Intelligent Transportation Systems, ITSC, St. Louis (2009)
22. S Sai, E Niwa, K Mase, M Nishibori, J Inoue, M Obuchi, T Harada, H Ito, K Mizutani, M Kizu, Field evaluation of UHF radio propagation for an ITS safety system in an urban environment. IEEE Communications Magazine.
47(11), 120–127 (2009)
23. iTETRIS - An Integrated Wireless and Traffic Platform for Real-Time Road Traffic Management Solutions, D4.1 V2V Wireless Communications Modeling. (2009)
doi:10.1186/1687-1499-2011-182
Cite this article as:Mangelet al.:5.9 GHz inter-vehicle communication at intersections: a validated non-line-of-sight path-loss and fading model.EURASIP Journal on Wireless Communications and Networking2011 2011:182.
Submit your manuscript to a
journal and benefi t from:
7Convenient online submission 7Rigorous peer review
7Immediate publication on acceptance 7Open access: articles freely available online 7High visibility within the fi eld
7Retaining the copyright to your article