Substorm and pseudo-substorm Pi2 pulsations observed during the interval of
quasi-periodic magnetotail flow bursts: A case study
K.-H. Kim1, K. Takahashi2, S. Ohtani2, K. Yumoto3, D.-H. Lee1, H. Jin1, J. Seon1, and S.-K. Sung1
1School of Space Research, Kyung Hee University, Yongin, Korea 2Applied Physics Laboratory, Johns Hopkins University, Laurel, Maryland, USA
3Space Environment Research Center, Kyushu University, Fukuoka, Japan
(Received July 6, 2009; Revised December 10, 2009; Accepted December 10, 2009; Online published June 17, 2010)
We studied the relationship between midtail flow bursts observed by the Geotail spacecraft and eight Pi2 pulsations near midnight observed at low-latitude Kakioka (KAK, L = 1.26) and high-latitude Tixie (TIX, L = 5.9) stations on 26 October (day 299) 1997, 1100–1600 UT. The Pi2 pulsations at KAK have a great similarity with those at TIX with an out of phase signature. Three of the Pi2 bursts were associated with substorm onsets/intensifications and other five events were associated with pseudo-substorm onsets. The pseudo-substorm Pi2 pulsations exhibited longitudinal phase variations similar to substorm-related Pi2 pulsations. From this observation we suggest that pseudo-substorm associated current system is morphologically the same as substorm current wedge. The substorm Pi2s are enhanced at higher frequency band (∼15–20 mHz) than the frequency band (∼6–15 mHz) of pseudo-substorm Pi2s. We do not attribute these frequency variations to the change of the plasmapause distance, which is favored in the plasmaspheric resonance model. During the five-hour interval, Geotail observed quasi-periodic high-speed flow bursts (perpendicular flow velocityV⊥x >300 km/s) preceding
the low-latitude Pi2 pulsations by∼35–150 s. It is found that there is no obvious relationship between the speed of the earthward flow burst events and the power of the Pi2 events. This means that enhanced flow speed is not a main factor in controlling a Pi2 power. The waveform and period of the Pi2 pulsations are different from those of the flow bursts except for one event, which was previously reported as BBF-driven Pi2.
Key words: Pi2, bursty bulk flow, magnetotail, substorm, pseudo-substorm, BBF-driven Pi2, plasmaspheric resonance, high-speed flow burst.
1.
Introduction
Pi2 magnetic pulsations are low-frequency (period=40– 150 s) oscillations of the geomagnetic field (e.g., Saito, 1969). They are usually excited at the onset of a geo-magnetic substorm and last for a few cycles. Currently, plasmaspheric cavity mode resonance is the most popu-lar source mechanism for Pi2 pulsations observed at low to mid latitudes. A number of statistical and case studies using ground-based observations or simultaneous ground and satellite observations have reported that low-latitude Pi2 pulsations are consistent with plasmaspheric resonances (e.g., Takahashiet al., 1995, 2001, 2003; Kimet al., 2001, 2005a; Nos´eet al., 2003; Hanet al., 2004).
The plasmaspheric resonance is not the only explana-tion given for low-latitude Pi2 pulsaexplana-tions. Recently, it has been proposed that low-latitude Pi2 pulsation can be gen-erated by time-modulated plasma bulk flows in the near-Earth magnetotail. Kepko and Kivelson (1999) and Kepko et al.(2001) showed several examples of low-latitude Pi2 waves and midtail flow oscillations that have nearly identi-cal waveforms. The authors suggested that the intermittent compressional waves generated by flow-braking (Shiokawa
Copyright cThe Society of Geomagnetism and Earth, Planetary and Space Sci-ences (SGEPSS); The Seismological Society of Japan; The Volcanological Society of Japan; The Geodetic Society of Japan; The Japanese Society for Planetary Sci-ences; TERRAPUB.
doi:10.5047/eps.2009.12.003
et al., 1998) directly drive low-latitude Pi2 pulsations. That is, midtail flow bursts are directly and causally linked with low-latitude Pi2 pulsations. Several case studies suggested that the flow-driven mechanism plays a role in determining the spatial and spectral properties of Pi2 pulsations (Osaki et al., 1998; Kimet al., 2005b; Caoet al., 2008).
Other studies that compared midtail plasma flows and Pi2 pulsations, however, found little evidence of the latter being driven cycle-by-cycle by the former. Yamaguchiet al.(2002) surveyed coordinated observations of a Pi2 onset on the ground, at geosynchronous altitude, and in the near-Earth plasma sheet with a strict requirement for the spatial alignment of observation points. The authors found that the waveforms of the low-latitude Pi2 pulsations are quite sim-ilar to the magnetic pulsations at geosynchronous orbit, but that the earthward flow variations in the plasma sheet are not similar to the Pi2 pulsations. Murphyet al.(2006) com-pared enhanced earthward flows and ground Pi2 pulsations from high to low latitudes. They found no direct link be-tween the period in the flow bursts and the period of Pi2 waves. These observations suggest that flow bursts are not the cause of Pi2 pulsations.
Recently, we have statistically examined the relation-ship between earthward flow bursts observed at the Geotail spacecraft in the magnetotail and Pi2 pulsations observed at low-latitude Kakioka station in another paper (Kim et
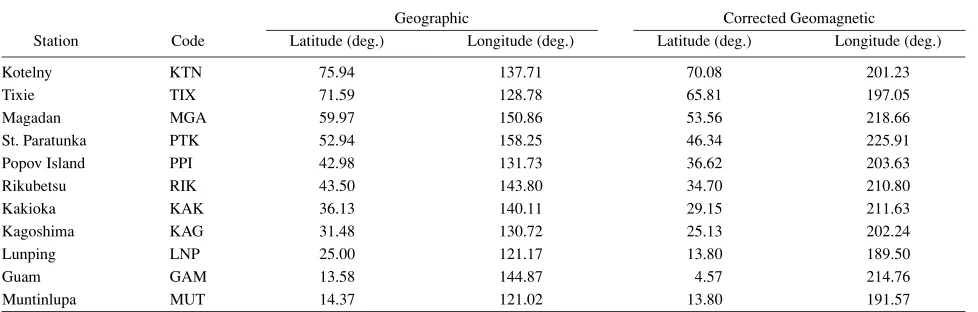
Table 1. List of ground magnetometer stations.
Geographic Corrected Geomagnetic
Station Code Latitude (deg.) Longitude (deg.) Latitude (deg.) Longitude (deg.)
Kotelny KTN 75.94 137.71 70.08 201.23
Tixie TIX 71.59 128.78 65.81 197.05
Magadan MGA 59.97 150.86 53.56 218.66
St. Paratunka PTK 52.94 158.25 46.34 225.91
Popov Island PPI 42.98 131.73 36.62 203.63
Rikubetsu RIK 43.50 143.80 34.70 210.80
Kakioka KAK 36.13 140.11 29.15 211.63
Kagoshima KAG 31.48 130.72 25.13 202.24
Lunping LNP 25.00 121.17 13.80 189.50
Guam GAM 13.58 144.87 4.57 214.76
Muntinlupa MUT 14.37 121.02 13.80 191.57
al., 2007). In that study, we found that a small fraction of midtailflow bursts at Geotail were associated with the oc-currence of low-latitude Pi2 pulsations and that the degree of association suddenly increased when the spacecraft was close to the central plasma sheet. Thus, it was suggested that there is a great chance of detecting aflow burst near the time of a ground Pi2 if a spacecraft is very close to the midplane of the plasma sheet. The statistical study did not address about the relationship between the Pi2 waveform and bursty bulkflow (BBF) variations but the occurrence of Pi2 and BBF.
Since Pi2 pulsations are commonly observed at the onset of a magnetospheric substorm, Pi2 pulsations have been considered as one of substorm indicators. However, it has been reported that Pi2 pulsations sometimes occur under extremely quiet solar wind condition and magnetospheric condition (e.g., Sutcliffe, 1998; Lyonset al., 1999; Sutcliffe and Lyons, 2002; Kimet al., 2005b). That is, Pi2s can occur during the absence of substorm. The question thus arises as to the origin of such Pi2s and whether they have spatial variations similar to substorm-associated Pi2s.
In this study we show eight well-defined low-latitude Pi2 pulsations. Three of the Pi2 bursts were associated with substorm onsets/intensifications and otherfive events were observed without a significant substorm signature on the ground and in space. They occurred during an interval of quasi-periodic or bursty midtailflows detected by Geotail. Since theflow bursts preceded the Pi2s by∼35–150 s, we examine if the low-latitude Pi2 pulsations have a causal relationship with theflow bursts.
2.
Data Sets
We studied Pi2 pulsations using high-latitude Kotelny (KTN) and Tixie (TIX) and low-latitude Kakioka (KAK) magnetometer data. The low-latitude magnetometer data from the 210 MM magnetic network are also used to exam-ine the spectral analysis (Yumotoet al., 1996). The geo-graphic and corrected geomagnetic coordinates (CGM) for the ground stations are listed in Table 1. Magnetic field measurements at KTN, TIX, and KAK are made at 1-s in-tervals, but we reduced the time resolution to 6 s by running an average to discuss the properties of Pi2 pulsations. The auroral electrojet indices AL and AU, provided in 1-min resolution, are used to illustrate geomagnetic activity and to
find the onset of substorms.
The geosynchronous energetic particle flux data (10-s time resolution) from the Los Alamos National Laboratory (LANL) geosynchronous spacecraft 1994-084 are used to examine substorm-associated particle injections. Geotail data used in this study are magneticfield vector (Kokubun et al., 1994) and ion moments (Mukai et al., 1994), both provided in 12-s time resolution. A key spacecraft parame-ter to be used in this study isV⊥x, which is defined as
V⊥x ≡
V−
B
|B| •V
B
|B|
•exGSM (1)
where V is the ion bulk velocity vector, B is the ambi-ent magnetic field vector, and exGSM is the unit vector along the Earth-Sun line, taken positive sunward. The V⊥x variations are compared with the low-latitude Pi2
pulsations. To monitor the solar wind condition during the Pi2 pulsations on the ground and flow bursts in the magnetotail, the solar wind and interplanetary magnetic field data from the Wind spacecraft were used. The data were time shifted to the bow shock nose at the Space Physics Data Facility of NASA Goddard Space Flight Center (http://omniweb.gsfc.nasa.gov). The data have been provided in 1-min time resolution.
3.
Observations
The Pi2 events reported in this study occurred during a 5-hour interval, 1100–1600 UT on 26 October 1997. We identified eight nightside Pi2 events at KAK. Five of the Pi2 events were accompanied by quasi-periodicflow bursts observed by Geotail in the magnetotail. We examine in de-tail the relationship between theflow bursts and the ground Pi2 pulsations.
3.1 Solar wind observations
Figure 1 shows the upstream solar wind conditions ob-served by the Wind spacecraft from 1000 to 1600 UT, on 26 October 1997. Thefive panels illustrate the solar wind velocity, solar wind density, and the interplanetary magnetic field (IMF) in GSM coordinates. During the time interval Wind moved from GSE (x,y,z)∼(34.0,−62.9,−2.3)to (37.2,−63.6,−1.8)RE. From 1000 to 1320 UT, the IMF
pointed radially toward the Earth (Bx < 0) and weakly
4
10:00 11:00 12:00 13:00 14:00 15:00 16:00
Universal time
Fig. 1. Wind solar wind observations (propagated to the bow shock nose). From top to bottom, the figure shows the solar wind velocity, density, and the IMF data in GSM coordinates. The solid circles in the IMFBz panel indicate the onset times of the Pi2 events identified at KAK.
interval, 1220–1230 UT. The IMF direction was pre-dominantly southward during 1320–1400 UT and 1420– 1600 UT. The solar wind density was∼2 cm−3 at the be-ginning of the interval and gradually increased to∼4 cm−3 at 1520 UT. The solar wind speed was around 510 km/s for the interval from 1000 to 1320 UT, and then suddenly in-creased to∼600 km/s at∼1320 UT. The solar wind speed highly fluctuated around 550 km/s from 1320 to 1600 UT. Using the observed solar wind velocity and the location of Wind∼34–37 RE upstream of the Earth, we estimate that
each feature in the solar wind reached a subsolar point of the magnetopause at 10REwithin 10 min. The solid circles
in the panel of IMF Bzindicate the Pi2 events identified at KAK (see below). The first four events occurred when the IMFBzwas northward, and other four events were observed during the southward IMF.
3.2 Overview of the low-latitude Pi2 events
Figures 2(a)–2(d) show the auroral electrojet indicesAL and AU, the horizontal H (northward) and D (eastward) components at KAK, Pi2 power in the Pi2 frequency band (6–25 mHz) of the differentiated KAKH, and filtered (5– 30 mHz) KAKH during the 5-hour interval from 1100 to 1600 UT on 26 October 1997. In Figs. 2(c) and 2(d) we can identify eight Pi2 pulsations, and the solid circles at eight power maxima, labeled A through H, indicate Pi2 events
-900 -600 -300 0 300
12:00 13:00 14:00 15:00 16:00 10-5
Fig. 2. (a) The auroral electrojet indicesAUandALon 26 October 1997, 1100–1600 UT. (b) Kakioka (KAK) magnetometer data. (c) Pi2 power in the Pi2 frequency band (6–25 mHz) of the differenced KAKH. (d) Filtered (5–30 mHz) KAKH. A through H indicate events selected for analysis. KLT indicates the KAK local time.
identified from the time profile analysis of the Pi2 power (Takahashiet al., 1995). The Pi2 power maxima are marked by the vertical dashed lines. We note that event A was previ-ously reported by Kepkoet al.(2001). The authors showed that the ground Pi2 pulsation oscillates with a nearly iden-tical period of earthward flow bursts in magnetotail.
During the interval 1100–1400 UT, the magnitude ofAU was less than 50 nT. In the 3-hour interval 1100–1400 UT during which Pi2 events A–E occurred, the AL in-dex maintained a small magnitude (<50 nT) and there is no sudden decrease of AL. These low geomagnetic activ-ities are associated with the northward IMF interval. At KAK positive Hbay was absent for events A–E, implying that a substorm current wedge was not formed (Clauer and McPherron, 1974). Pi2 pulsations without substorm signa-tures have been reported by previous studies (Takahashiet al., 1997; Sutcliffe and Lyons, 2002; Kimet al., 2005b).
KAK (0.5 nT/di
v)
12:50 12:55 13:00 13:05 13:10 13:15 KAK H
14:50 14:55 15:00 15:05
(a)
(b) 21.83 21.92 22.00 22.08 22.17 22.25 UT
KLT
23.83 23:92 00.00 00.08
UT KLT
Event C
Event G
Fig. 3. KAK magnetic field data for (a) event C and (b) event G. The local time of Kakioka (KLT) is shown at the bottom of each plot.
of events F and G, KAK was near midnight and observed a large positive increase inHand a small positive increase inD. This implies that KAK was located near the center of the substorm current wedge (Clauer and McPherron, 1974). The power of the Pi2 events differs from one event to another. The substorm-associated Pi2s (events F and G) have large power. By contrast, the intensity of events A– E during the interval of quiet geomagnetic conditions is clearly lower. This would be related to the source inten-sity. Takahashiet al.(2002) reported that large (small) Pi2 amplitude is associated with strong (weak) auroral power. Thus, the modulated Pi2 power in our study may be due to the event-to-event variation of auroral activity.
Figures 3(a) and 3(b) show theHand Dcomponents at KAK for event C and event G, respectively. The local time of Kakioka (KLT) is shown at the bottom of each plot. Dur-ing event C, KAK was in the pre-midnight sector, and the H and Dcomponents oscillate in phase with nearly iden-tical periods. The amplitude of His comparable to that of D. During event G, KAK was near midnight and observed a well-defined Pi2 pulsation in H. There is oscillation in KAK D, but its waveform is more irregular and its ampli-tude much smaller than the oscillation inH. The observed phase relationship betweenH andDat KAK is consistent with the longitudinal variation of Pi2 polarization with re-spect to the center of the substorm current wedge reported by Lesteret al.(1983).
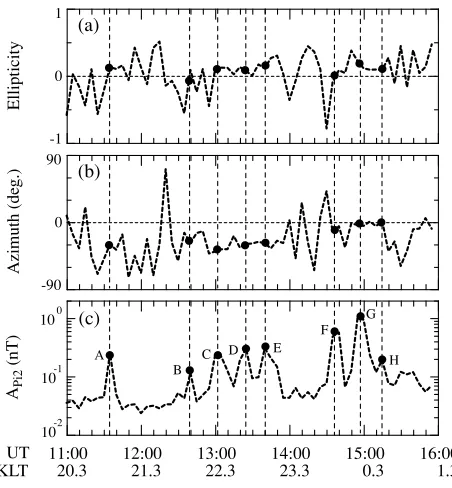
Figures 4(a)–4(c) show the Pi2 parameters (ellipticity, azimuth, and band-integrated amplitude APi2) from the KAK magnetometer data for the interval shown in Fig. 2 with solid circles corresponding to the amplitude peaks for events A through H. To extract the parameters from the magnetic field variations, we used a moving time window analysis of the magnetometer time series of the H andD components developed by Takahashiet al.(2002). The pos-itive (negative) azimuth indicates that the polarization axis lies in the northwest (northeast) quadrant. Small ellipticity indicates linear polarization of magnetic pulsations.
Dur-11:00 12:00 13:00 14:00 15:00 16:00 10-2
Fig. 4. Pi2 parameters obtained by the moving-time-window calculation of KAK magnetic field data. (a) Ellipticity, defined positive for clock-wise sense of rotation. (b) Azimuth of the major axis of polarization. The angle is measured from the positiveHaxis, positive counterclock-wise. (c) Band-integrated Pi2 amplitude.
ing events A through E, for which there was no positive bay and no large negative disturbance in AL, the azimuth at KAK is negative. The ellipticity for the events is small. As mentioned above, these longitudinal wave characteris-tics are similar to those of substorm-related Pi2 pulsations. For events F–H, which are associated with substorm, the az-imuth at KAK near midnight was near zero, corresponding to the dominance ofHoverD(see Fig. 3(b)).
3.3 Observations of particle flux at geosynchronous
or-bit
Figure 5 shows the LANL geosynchronous proton flux data from the 1994-084 spacecraft and bandpass-filtered KAK H component for the same 5-hour interval as in Fig. 2. The local time (LT) of 1994-080 (LANLLT) and KAK (KLT) is presented at the bottom of the figure. The satellite and ground station were both located on the night-side with a small local time separation (∼2.4 hours). The proton fluxes are 10-s averages presented on a log scale for four energy intervals, 50–75, 75–113, 113–170, and 170– 250 keV.
11:00 12:00 13:00 14:00 15:00 16:00
Filtered (5-30 mHz) KAK H
1.3 1994-084 (LT = UT+6.9)
22.9
Filtered KAK H (3 nT/di
v)
Dif
ferential proton flux (#/cm 2/s/sr/k
Fig. 5. LANL geosynchronous proton flux data from the 1994-084 space-craft and bandpass-filtered KAKHcomponent for the same 5-hour in-terval as in Fig. 2.
al., 1993; Takahashiet al., 1997).
Events F and G were accompanied by proton injections that appear in all four energy channels. The proton injec-tions were associated with substorm onsets as shown with an ALdecrease and a positive bay at KAK. There was a proton injection at∼1540 UT when the ALindex showed a sudden decrease. These phenomena are commonly ob-served at the onset of a substorm. However, there was no low-latitude Pi2 pulsation at∼1540 UT. This indicates that low-latitude Pi2 pulsations are not always accompanied by
ALdecrease and particle injection.
3.4 Observations at high-latitude ground stations
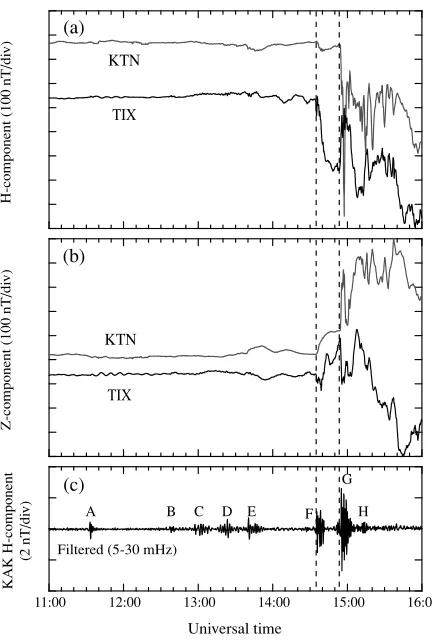
Figures 6(a) and 6(b) show magnetic field variations in the H and Z components at auroral zone stations, TIX and KTN. TIX, KTN, and KAK were located nearly on the same local time meridian. As expected from the small
ALvariations for events A–E, there were no great changes in the high-latitude magnetic fields until∼1435 UT (indi-cated by a vertical dashed line), when a negative perturba-tion started in the H component at TIX and KTN. This high-latitude negative perturbation was accompanied by a positive H bay and Pi2 pulsation (event F) at KAK. The amplitude of the negative H perturbation at TIX is much larger than that at KTN. At the onset of event F, theZ com-ponent showed a negative perturbation at TIX and a positive perturbation at KTN. TheseHandZvariations at the onset of event F indicate that the westward electrojet was located between the two stations and that the electrojet was close to TIX.
A clear onset of a negative H perturbation with a dra-matic change (H ∼ −700 nT in less than 5 min) was ob-served at KTN at∼1454 UT, indicated by the second ver-tical dashed line, when event G and positive H bay were observed at KAK. At this onset time, the perturbation in theZ component was positive at KTN and negative at TIX. TheseZ variations clearly indicate that the westward elec-trojet current was formed between TIX and KTN. At the onset of∼1454 UT, theH component at TIX exhibited a positive perturbation. This positive perturbation could be explained by the field-aligned current or distorted electro-jet (Kisabeth and Rostoker, 1973). During event G, the H
component at TIX decreased∼ −100 nT compared to the
11:00 12:00 13:00 14:00 15:00 16:00 KTN
Fig. 6. High-latitude magnetic field (a)Hand (b)Zcomponents at Tixie (TIX) and Kotelny (KTN). (c) bandpass-filtered KAKH.
baseline before 1435 UT. This amplitude is smaller than that at KTN. This result indicates that the westward elec-trojet intensified near KTN, poleward of TIX.
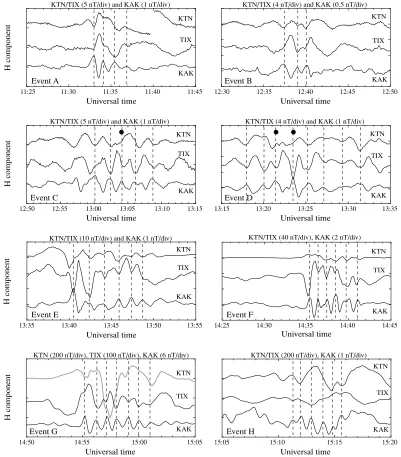
We examine the latitudinal localization of the Pi2 event A–H using the magnetic field H component data from the three ground stations, KTN, TIX, and KAK. Figure 7 shows the H component that was high-pass filtered by removing 300-s running averages from the 6-s time series. The verti-cal dashed lines in each panel are drawn through the peaks of the Pi2 oscillations at KAK for easy identification of the phase delay.
In event A, KAK data exhibits approximately three cy-cles of oscillation, but TIX and KTN data show different variations. We note that a sinusoidal perturbation with a pe-riod much longer than the Pi2 pepe-riod, starting at the onset of event A, was observed at TIX and KTN (see Figs. 6(a) and 6(b)). The Pi2 oscillation looks like to be superposed on the slow field variations. In fact, we can find that there are field perturbations at TIX, which correspond to the KAK Pi2 peaks, following the vertical dashed lines. TIXH os-cillates out of phase with KAK H. The perturbations at KTNH are similar to those at TIX during event A. Their amplitudes are comparable to each other.
11:25 11:30 11:35 11:40 11:45 12:30 12:35 12:40 12:45 12:50
12:50 12:55 13:00 13:05 13:10 13:15 13:15 13:20 13:25 13:30 13:35 KTN
KAK KTN/TIX (5 nT/div) and KAK (1 nT/div)
KAK KTN
KAK TIX KTN
13:35 13:40 13:45 13:50 13:55
Event A Event B
Event D Event C
Event E
Universal time Universal time
Universal time Universal time
Universal time
TIX KTN/TIX (5 nT/div) and KAK (1 nT/div) KTN/TIX (4 nT/div) and KAK (0.5 nT/div)
KTN/TIX (10 nT/div) and KAK (1 nT/div)
KTN/TIX (4 nT/div) and KAK (1 nT/div) KTN
TIX TIX
KAK
H component
H component
H component
14:25 14:30 14:35 14:40 14:45 Universal time
KTN/TIX (40 nT/div), KAK (2 nT/div)
Event F
14:50 14:55 15:00 15:05
Universal time
KTN (200 nT/div), TIX (100 nT/div), KAK (6 nT/div)
H component
Event G
KTN
KAK TIX
15:05 15:10 15:15 15:20
Universal time
KTN/TIX (200 nT/div), KAK (1 nT/div)
Event H KTN
TIX
KAK
KTN TIX
KAK
KTN
TIX
KAK
Fig. 7. TheHcomponent of the ground magnetic field at KTN, TIX, and KAK for events A to H.
F, but the oscillations at KTN are more irregular and smaller in amplitude than at TIX. Unlike at TIX, KTN had no magnetic field perturbations corresponding to the KAK Pi2
peaks (marked by solid circles on the KTN H trace) for
events C and D.
There were pulsation activities at KTN and TIX for event H, but they had no clear cycle-by-cycle correspondence to Pi2 pulsation at KAK. This may be due to the large and slow magnetic field disturbances at TIX and KTN. At au-roral zone highly irregular magnetic field disturbances are commonly observed. They are associated with the devel-opment of the auroral electrojet. These perturbations are much slower than Pi2 oscillation and much larger in am-plitude. Pi2s could be easily masked by such background disturbances.
3.5 Geotail observations in the magnetotail
Figure 8 shows the Geotail orbit projected onto the GSM
x-y plane for the interval of 1100 to 1600 UT on 26
Oc-tober 1997. The solid circles indicate the hourly location of the satellite. During this 5-hour interval, Geotail was in the near-Earth magnetotail close to the midnight sector as
moving from GSM(x,y,z) = (−13.21,0.95,−1.43)to
(−15.71,−4.56,0.20)RE.
Figures 9(a)–9(d) show the three magnetic field
compo-nents in GSM and theXGSMcomponent of the ion bulk flow
speed perpendicular to the ambient magnetic field (V⊥x, see
Eq. (1)). The velocity is calculated from the ion bulk ve-locity vector and magnetic field vector. Geotail observed fast and intermittent flow bursts. By comparing the flow bursts and the KAK Pi2 events shown in Fig. 9(e), we iden-tified that four Pi2s (events A, D, E, and G) are accompanied by high-speed earthward flow bursts larger than 300 km/s,
which is a conventional criterion forV⊥x high-speed flows
(e.g., Ohtaniet al., 2004). Whenever the Pi2s were detected
0 -5 -10 -15 -20
Fig. 8. Location of the Geotail spacecraft in the GSMx-yplane for the time interval from 1100 to 1600 UT on 26 October 1997.
A
11:00 12:00 13:00 14:00 15:00
Universal time
Filtered (5-30 mHz) KAK H (1.5 nT/di
v)
Fig. 9. (a)–(d) Three magnetic field components in GSM and theXGSM component of the ion bulk flow perpendicular to the ambient magnetic field, respectively. (e) Filtered (5–30 mHz) KAKHand Pi2 power in the Pi2 frequency band (6–25 mHz) of the differentiated KAKH.
flow variations at Geotail in Fig. 16. During event C, Geo-tail observed quasi-periodic flow bursts. There is no obvi-ous relationship between the speed of the flow burst events and the power of the Pi2 events. The maximum values of the flow speed during events D, E, and G are comparable, V⊥x = ∼1100 km/s. However, the Pi2 power of event G is greater than events D and E by a factor of 10. Events A and
E show comparable Pi2 power, but the maximum value of V⊥xassociated with event E is greater than that associated with event A by a factor of 2. This means that enhanced flow speed is not a main factor in controlling a Pi2 power. 3.6 A comparison of Pi2 waveform and quasi-periodic
earthward BBFs
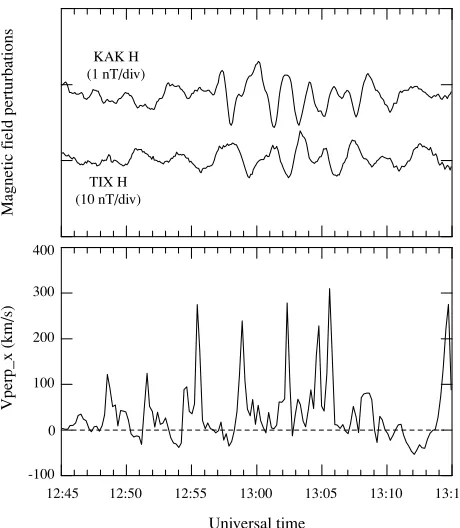
Figure 10 shows a comparison of V⊥x at Geotail and the H component at KAK and TIX for event C. From
∼1248 to∼1310 UT, quasi-periodic earthward flow bursts are seen inV⊥x. The peak flow speeds are in the rage of
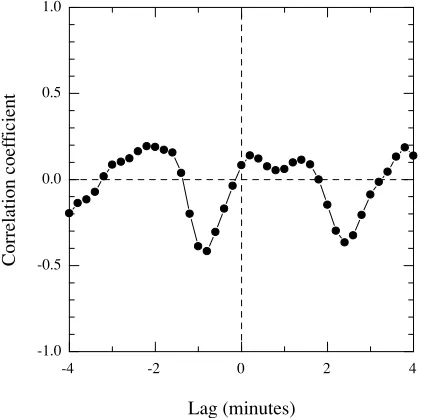
∼100–300 km/s, which is less than a typical high-speed flow velocity (V⊥x > 300 km/s). On the ground the H components at KAK and TIX exhibit several cycles of a quasi-periodic oscillation. As mentioned above, KAK H oscillates out of phase with TIX H. Figure 11 shows the cross-correlation function between the KAKHandV⊥xfor the interval, 1245–1315 UT, shown in Fig. 10. The positive lag time means that theV⊥xflows lead the KAK H peaks. The function does not show a high value with a single peak, but shows the values less than 2 in positive time lags. This indicates that the time delay between the flow bursts and KAK field perturbations is random.
In order to investigate whether there is a high degree of similarity in the waveform between Pi2 and flow oscilla-tions, we conduct the spectral analysis between Pi2 and flow. Figure 12 compares the waveforms and spectral prop-erties of V⊥x and H. Note that the amplitude ofV⊥x is reduced to 1% of the original and the whole V⊥x data is shifted to the right by 90 s in order to get its best visual match withH at the beginning of the event. AlthoughV⊥x andH have nearly identical periods for the several cycles, as marked by the vertical dashed lines in Fig. 12(a), the pe-riod ofV⊥xoscillation does not match with that of Pi2 wave after 1300 UT. As a consequence the location of spectral
12:45 12:50 12:55 13:00 13:05 13:10 13:15
-4 -2 0 2 4 -1.0
-0.5 0.0 0.5 1.0
Correlation coef
ficient
Lag (minutes)
Fig. 11. Cross correlation between KAK HandV⊥x for the interval,
1245–1315 UT.
peak ofV⊥x andH are not consistent (Fig. 12(b)), and
co-herence is low (Fig. 12(c)).
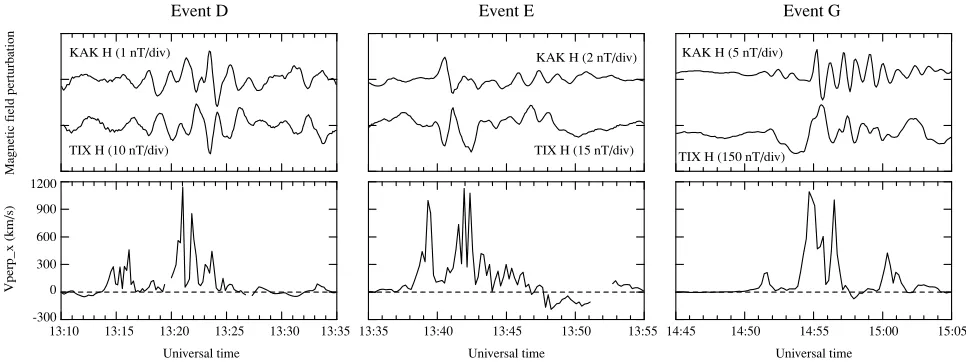
Figure 13 compares the H-component waveforms and
V⊥x variations for events D, E, and G, accompanied by
high-speed earthward flow bursts larger than 300 km/s. Looking first at event G, there appears to be a weak Pi2 oscillation lasting three cycles at KAK, several minutes be-fore event G starting at 14:54:45 UT. The first Pi2 peak occurred at 14:51:27 UT. Geotail did not detect oscillatory earthward flow bursts corresponding to the weak Pi2 oscil-lation except for a single flow burst ofV⊥x = 212 km/s at
14:51:37 UT, which is∼10 s later than the first Pi2 peak. This indicates that the three-cycle Pi2 perturbations were not directly driven by the flow burst observed at Geotail even though the Pi2 would be associated with the occur-rence of flow burst.
Geotail observed high-speedV⊥xbursty flows for the
in-terval of event G when the satellite was at GSM(x,y) =
(−15.39,−3.45)RE. Their peaks occurred at 14:54:40, 14:55:41, 14:56:30, and 15:00:21 UT, respectively. If the bursty flows are shifted to the right by 35 s, this time shift produces a nearly perfect match of the first three and sev-enth KAKHpeaks. However, there are no flow bursts cor-responding to the fourth, fifth and sixth peaks of the Pi2 pulsation at KAK.
During event E, the KAK H peak at 13:40:34 UT matches the earthwardV⊥x peak at 13:39:19 UT if time is
shifted 75 s. From 1341 to 1348 UT,V⊥x oscillated with a
period much shorter than event E. Such a short-period os-cillation cannot be identified in theH component at KAK. For event D, although there are flow bursts that match the Pi2 peaks with 148-s time shift, we cannot find matching for the entire Pi2 wave packet.
4.
Discussion
It has been recently suggested that low-latitude Pi2 pulsa-tion can be directly driven by periodic earthward flow bursts in the middle magnetotail. Kepko and Kivelson (1999)
12:45 12:50 12:55 13:00 13:05 13:10 13:15 -4 -2 0 2 4
Universal time Vperp_x/100 (time shift: +90 s)
10-1 100 101 102
10-1 100 101
Vperp_x po
wer ((km/s)
2 /Hz)
0 5 10 15 20
0.0 0.2 0.4 0.6 0.8 1.0
Coherence
Frequency (mHz)
KAK-H po
wer (nT
2
/Hz)
KAK H (1 nT/di
v) Vperp_x (km/s)
Vperp_x
KAK H KAK H
(b) (a)
(c)
Vperp_x
Fig. 12. (a) Comparison ofV⊥xand KAKHtime series for event C.V⊥x
is 1% of the original and shifted to the right by 90 s. (b) Autopower and (c) coherence spectra forV⊥xand KAKH.
and Kepkoet al.(2001) reported several examples of low-latitude Pi2 pulsations and midtail earthward flow bursts that have nearly identical waveforms. The midtail bursts started 60–180 s earlier than the low-latitude Pi2 pulsations. Thus, the authors suggested that the flow bursts directly drive the Pi2 pulsations and that the Pi2s have a causal rela-tionship with flow burst events.
KAK H (1 nT/div)
TIX H (10 nT/div)
Magnetic f
ield perturbation
13:10 13:15 13:20 13:25 13:30 13:35
-300
0 300 600 900 1200
Vperp_x (km/s)
Universal time
KAK H (2 nT/div)
TIX H (15 nT/div)
13:35 13:40 13:45 13:50 13:55
Universal time
KAK H (5 nT/div)
TIX H (150 nT/div)
14:45 14:50 14:55 15:00 15:05
Universal time
Event G Event E
Event D
Fig. 13. KAKH, TIXH, andV⊥xfor events D, E, and G.
As shown in Fig. 4, the longitudinal polarization pattern of the pseudo-substorm Pi2s is the same as that of substorm-associated Pi2. This implies that the Pi2-substorm-associated cur-rent system for the pseudo-substorm onset is morphologi-cally the same as substorm current wedge. We suggest that the oscillations of field-aligned current on the Pi2 current wedge produce ground perturbations on the east-west com-ponent at KAK (see Fig. 3), which explain the longitudinal variation of polarization axis (Lesteret al., 1983).
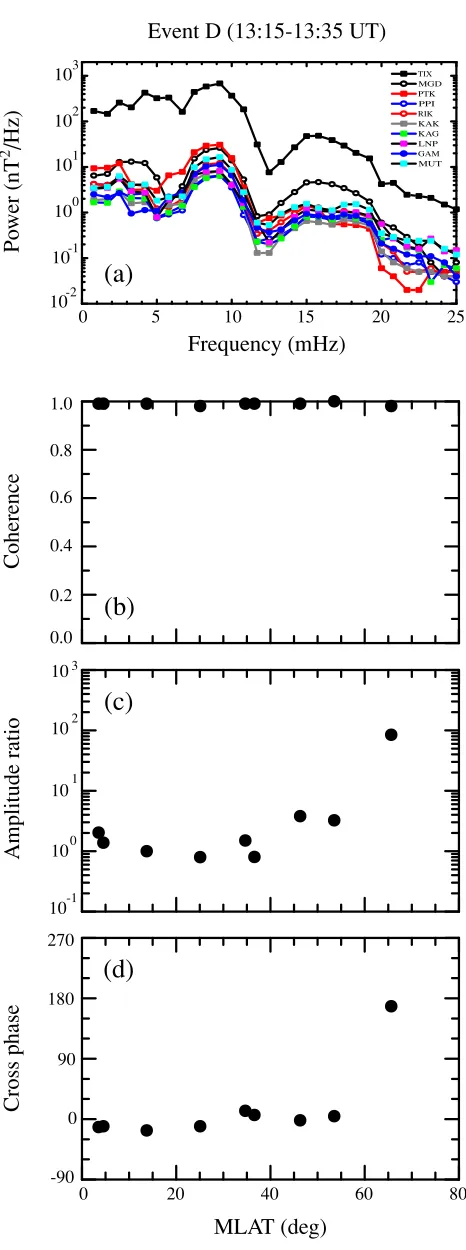
It has been generally accepted that low-latitude and high-latitude Pi2 pulsations have different spectral contents (e.g., Yumotoet al., 1994; Liet al., 1998), which suggest differ-ent source mechanisms for differdiffer-ent latitudes (Olson, 1999). We observed that the low-latitude Pi2 pulsations have a high degree of similarity with those observed at high latitude with an out of phase signature. This indicates that the low-latitude and high-low-latitude Pi2 pulsations in our study are ex-cited by a common source mechanism. Figure 14(a) shows the H-component power spectra of the 210 MM magnetic observation network for event D. All stations have an iden-tical spectral peak at ∼9 mHz. The coherence, power ra-tio, and cross phase between KAK and other 210 MM sta-tions at the common spectral peak around 9 mHz are plotted in Figs. 14(b)–14(d). The coherence is almost perfect, and the amplitude is increasing with increasing latitude. Other events also show similar results for spectral analysis (data not shown). The maximum amplitude would indicate that the field line is connected to the source region. There is a phase switching at MLAT = ∼66◦. This phase signa-ture may be due to the westward electrojet current for high-latitude TIX Pi2s and field-aligned current for low-high-latitude Pi2s when the low-latitude station is located within the Pi2 current wedge (see Fig. 3 in Lesteret al., 1983). The out of phase signature between KAK H and TIX H shown in Fig. 7 would be explained by field-aligned current oscilla-tions.
The H-component phase switching could be interpreted as the nodal structure of radial (latitudinal) mode of plas-maspheric cavity resonance (e.g., Yeoman and Orr, 1989; Takahashiet al., 1995). If the Pi2 events in our study are associated with plasmaspheric resonances, their
frequen-cies depend on the size of the plasmasphere (Takahashi et al., 2003). Figure 15 shows the IMF Bz shifted by 7 min and dynamic spectrum of the magnetic H compo-nent from KAK. In the KAKHspectrum, intermittent Pi2-band (∼6–25 mHz) oscillations are evident. Their power is strongly time-modulated as mentioned above. Event A was enhanced in the frequency band of 10–15 mHz, whereas the frequency band of event C, D, and E was somewhat lower, ∼6–12 mHz. It is well known that the plasma-pause distance becomes smaller when the Kp index
in-creases (e.g., Gallagher et al., 1995). The Kp index was
0+for 0900–1200 UT and 2+for 1200–1500 UT on Oc-tober 26, 1997, respectively. Thus, frequency variations of pseudo-substorm Pi2s (events A–E) may not be interpreted by the location of the plasmapause estimated fromKp.
Fur-thermore, we do not consider that the magnetic field line of TIX is in the plasmasphere because the TIX magnetic field line is mapped to around −13RE from the T96 magnetic
field model (Tsyganenko and Stern, 1996).
The substorm-associated Pi2s (events F–H) are enhanced at higher frequency band (∼15–20 mHz) than the frequency band (∼6–15 mHz) of pseudo-substorm Pi2s (events A– E). If such frequency increase from∼6–15 mHz to∼15– 20 mHz is caused by the plasmapause distance decrease, it is expected that the plasmapause moves inward to L
≈ 3.5 from L ≈ 4.5 (Gallagher et al., 1995; Takahashi et al., 2003). According to recent studies (Goldstein and Sandel, 2005, and references therein), inward motion of the nightside plasmapause occurs∼20–30 min after the arrival of southward IMF at the dayside magnetopause. We ex-pect that the inward motion of the plasmapause begins at
∼1400 UT. Then, the plasmapause erosion rate is 2.0 L per hour of UT. This erosion rate is much larger than dur-ing the interval reported by Spasojevi´cet al.(2003), which has similar geomagnetic and IMF conditions to the interval in our study. Therefore, the Pi2 frequencies in our study are not controlled by the plasmapause distance. We suggest that the Pi2s in our study may be associated with transient responses to the variations in the magnetotail.
0 20 40 60 80 -90
0 90 180 270
MLAT (deg)
Cross phase
10-1 100 101 102 103
Amplitude ratio
0.0 0.2 0.4 0.6 0.8 1.0
Coherence
(b)
(c)
(d)
0 5 10 15 20 25
10-2 10-1 100 101 102 103
Event D (13:15-13:35 UT)
Frequency (mHz)
TIX MGD PTK PPI RIK KAK KAG LNP GAM MUT
Po
wer (nT
2
/Hz)
(a)
Fig. 14. (a) The power spectrum of theHcomponent from KAK and the stations of 210 MM network for event D, (b) interstation coherence, (c) amplitude ratio, which is defined as the square root of other stationHto KAKHpower ratio, and (d) cross phase for theHcomponent of event D.
∼35–150 s. Kepko et al.(2001) suggested that the high-latitude Pi2 pulsations can be generated by time-modulated BBFs. According to the BBF-associated Pi2 model, dawn-ward directed current perpendicular to the magnetic field is generated by the inertia effect as the time-modulated earth-ward BBFs are decelerated or braked in the tail/dipolar tran-sition region. The perpendicular current is diverted into the field-aligned currents that flow on a wedge-shaped cir-cuit connected to the ionosphere. The current system de-cays as the flow disappears but it intensifies again when the next flow burst arrives. As mentioned above, pseudo-substorm Pi2s occurred without background field change, i.e., without the substorm current wedge (see Figs. 2 and 6). Thus, the pseudo-substorm Pi2s could be explained by the varying braking inertial current. However, the time-modulated BBF model cannot provide a complete expla-nation of our observation because we do not find any sys-tematic correlation between Pi2 power and the flow-burst intensity.
In the BBF-driven Pi2 events presented by Kepko et al. (2001, 2004), the earthward flow bursts preceded the low/mid-latitude Pi2 events by 60–180 s. This time de-lay is comparable to that in our study except for event G, which had a 35-s time delay. Note that Geotail was at GSM (x,y,z)≈ (−15.4,−3.4,0.1)RE for event G. If flow de-celeration or braking at geocentric distance of∼10–15 RE (Shiokawaet al., 1998) plays a major role in exciting the Pi2 pulsations, the 35-s time delay is too short for the travel time of an Alfv´en wave from the braking region to the iono-sphere. Furthermore, we observed a small Pi2 events just before event G (see Fig. 13) preceding a single earthward flow burst by∼10 s. If event G and the small Pi2 event are associated with the earthward flow bursts, the Pi2 current system may be formed before the flow bursts are observed at Geotail. This leads us to suggest that field-aligned current producing the Pi2 perturbations occurs at a radial distance greater than the flow braking region (see figure 19 in Birnet al., 2004). To confirm this suggestion, we need to examine the spatial characteristics of the earthward flow burst from the tail reconnection region and the flow braking region us-ing multipoint measurements.
We showed that the pseudo-substorm Pi2 power is much smaller than the substorm-associated Pi2 power by a fac-tor of∼10–100. This can be explained if the substorm-associated current is larger than the inertial current by a factor of 10–100 (Birn et al., 1999). It should be noted that the peak speed and duration of the flow burst corre-sponding to pseudo-substorm events (events D and E) are comparable to those of substorm-associated Pi2 (event G). This implies that the BBFs observed at Geotail may not be a main parameter to directly control substorm and/or pseudo-substorm activities.
The temporal variations of the flow bursts observed at Geotail are compared with Pi2 pulsations. It is found that the waveform and/or period of the low-latitude Pi2s are significantly different from those of the flow bursts. From these observations we cannot conclude that the KAK Pi2s in our study are directly driven by the midtail earthward flow bursts observed at Geotail.
associa-Universal Time
1100 1200 1300 1400 1500 1600 -3.0
Fig. 15. (a) IMFBzshifted by 7 min. (b) Dynamic spectrum of the magneticHcomponent from KAK.
102
13:10 13:15 13:20 13:25 13:30 -300
13:35 13:40 13:45 13:50 -300
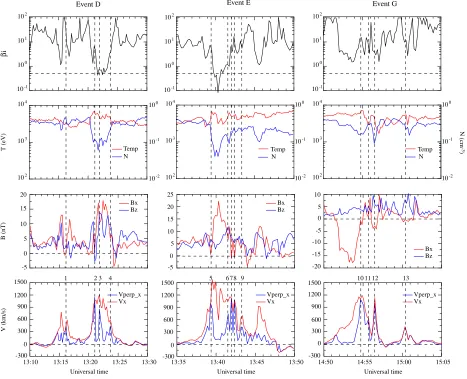
14:50 14:55 15:00 15:05 -300 lines indicate the high-speed flow burst events larger thanV⊥x=300 km/s, as labeled “1” through “13” above the flow panels.
tion between flow bursts and low-latitude Pi2s increases when the spacecraft was close to the central plasma sheet. We examine whether Geotail was near the central plasma
sheet whenV⊥xwas detected. Figure 16 shows the ion beta
(βi), the ion temperature and density, the magnetic fieldX
and Z components, and Vx andV⊥x for events D, E, and
G. The horizontal dashed line in theβi plot indicates the
Table 2. List of theflow burst events withV⊥x>300 km/s.
Event UT V⊥x Bx By Bz Bx ya Bz/Bx y βi
number hh:mm:ss km/s nT nT nT nT
1 13:16:09 458 −0.2 −1.5 2.7 1.5 1.8 60.8
2 13:21:02 1143 1.3 −6.5 −2.7 6.6 0.4 6.6
3 13:21:51 854 10.4 3.4 13.8 10.9 1.3 0.7
4 13:23:40 445 5.1 −1.5 9.7 5.3 1.8 3.4
5 13:39:19 998 0.5 −3.8 6.6 3.8 1.7 7.4
6 13:41:33 736 6.6 −4.5 11.8 8.0 1.5 1.2
7 13:41:57 1127 −1.0 −1.9 7.5 2.1 3.5 6.5
8 13:42:21 1077 −0.6 0.8 5.3 1.0 5.3 16.7
9 13:43:10 418 3.0 −1.7 4.9 3.4 1.4 11.2
10 14:54:40 1090 −0.6 3.7 3.7 3.7 1.0 13.8
11 14:55:41 606 0.7 3.1 5.2 3.2 1.6 10.1
12 14:56:30 1003 −2.8 1.4 5.9 3.1 1.9 4.0
13 15:00:21 423 −0.3 1.5 7.9 1.5 5.2 9.9
aB
x y=(B2x+B2y)1/2.
in Fig. 15, ion beta values are high (βi >0.5), and Bz is
comparable to or larger than|Bx|, indicating that the
satel-lite stayed near the plasma sheet region. The X-directed (|Bx| Bz) magnetic fields were observed with low ion
beta (βi<0.5) around 1340 UT and with high ion beta (βi
>0.5) for the interval from∼1452 to∼1454 UT. Looking at the ion temperature and the ion energy-time spectrogram (http://www.darts.isas.ac.jp/spdb/), the former and latter re-gions are regarded as the plasma sheet boundary layer and the outer region of the plasma sheet, respectively. The ver-tical dashed lines indicate theflow bursts ofV⊥xexceeding
300 km/s. Following the vertical dashed lines, wefind that most of theflow burst events were observed in the region of |Bx|<5 nT with northward magneticfield.
Table 2 summarizes the characteristics of the Geotail data for thirteenflow burst events, identified in Fig. 16. Bx y,
in-dicating (Bx2+By2)1/2, is less than 15 nT for all of theflow
burst events, and for twelve events out of thirteen events Bz/Bx y is larger than 0.5. A total of thirteen events were
found in the region ofβi>0.5. From these characteristics
of theflow bursts, we suggest that the spacecraft was lo-cated in the central plasma sheet whenever the high-speed flow bursts were detected (Baumjohannet al., 1990; Nagai et al., 1998). In the central plasma sheet, the flow bursts events (V⊥x) are responsible for the earthward transport of
plasmas and magneticflux. The ion distribution function of the plasmaflow with respect to the ambient magneticfield in the plasma sheet or plasma sheet boundary layer can be found in the study of Nagaiet al.(1998).
From the magneticfieldBx andBzvariations in Fig. 16,
we can identify that Geotail transiently entered the central plasma sheet region because of plasma sheet oscillations. Such plasma sheet oscillations have been observed near substorm onset (e.g., Baueret al., 1995). If theflow bursts in the central plasma sheet play a dominant role in excit-ing low-latitude Pi2s, it is not easy tofind a good one-to-one correspondence between theflow bursts and Pi2s with a single-point observation in the magnetotail because the magnetotail is highlyfluctuating.
5.
Conclusions
We have studied the Pi2 pulsations observed at high and low latitudes during the interval of quasi-periodic earthward flow bursts on October 26, 1997. We showed that some of the Pi2 events occurred without high-latitude negative bay and geosynchronous proton injection. This indicates that Pi2 pulsations are not always associated with substorm. The pseudo-substorm Pi2s exhibited longitudinal phase varia-tions similar to substorm-related Pi2 pulsavaria-tions. From these observations, we suggest that the Pi2 current system for the pseudo-substorm Pi2s has the same morphology as the sub-storm current wedge. Unlike in previous studies, our low-latitude Pi2 events have a high degree of similarity with the high-latitude Pi2s. This indicates that the Pi2 pulsations are generated by a common source mechanism. In our study, we favor thefield-aligned current oscillation for the source of the Pi2 oscillation rather than the plasmaspheric reso-nance. According to the BBF-driven Pi2 model, the field-aligned current can be generated by braking of fastflows in the region of strong dipolefield. Then, one would ex-pect that the period offlow oscillation should match Pi2’s period. However, the time series examination for theflow burst events at Geotail and Pi2 pulsations at Kakioka did not provide clear evidence for the BBF-driven Pi2 model because Pi2s andflow oscillations do not have nearly identi-cal waveforms. Thefield-aligned current can also be gener-ated by twisted or sheared magneticfield (Birnet al., 2004), which is caused by earthwardflow burst. This indicates that thefield-aligned current can be generated by various sources in the magnetotail. Therefore, we need a larger suite of satellites to reveal the full spatial structure of the earthwardflow bursts. In the near future, we will attempt to examine the relationship between earthwardflow bursts and Pi2 pulsations with multipoint observations, THEMIS and Cluster missions, in the tail.
Reeves for the energetic particleflux data from the Los Alamos National Laboratory geosynchronous spacecraft. This work was supported by WCU program through NRF funded by MEST of Korea (R31-10016). Work at JHU/APL was supported by NASA grants NAG5-13024 and NAG5-13119.
References
Bauer, T. M., W. Baumjohann, and R. A. Treumann, Neutral sheet oscilla-tions at substorm onset,J. Geophys. Res.,100, 23,737, 1995. Baumjohann, W., G. Paschmann, and H. L¨uhr, Characteristics of
high-speed ionflows in the plasma sheet,J. Geophys. Res.,95, 3801, 1990. Birn, J., M. Hesse, G. Haerendel, W. Baumjohann, and K. Shiokawa, Flow
braking and substorm current wedge,J. Geophys. Res.,104, 19,895, 1999.
Birn, J., J. Raeder, Y. L. Wang, R. A. Wolf, and M. Hesse, On the prop-agation of bubbles in the geomagnetic tail,Ann. Geophys.,22, 1773, 2004.
Cao, J., et al., Characteristics of middle- to low-latitude Pi2 ex-cited by bursty bulkflows,J. Geophys. Res., 113, A07S15, doi:10. 1029/2007JA012629, 2008.
Clauer, C. R. and R. L. McPherron, Mapping the local time-universal time development of magnetospheric substorms using mid-latitude magnetic observatories,J. Geophys. Res.,79, 2811, 1974.
Gallagher, D. L., P. D. Craven, R. H. Comfort, and T. E. Moore, On the azimuthal variation of core plasma in the equatorial magnetosphere,J. Geophys. Res.,100, 23,597, 1995.
Goldstein, J. and B. R. Sandel, The global pattern of evolution of plas-maspheric drainage plumes, inInner Magnetosphere Interactions: New Perspectives from Imaging, Geophys. Monogr. Ser., vol. 159, edited by J. L. Burch, M. Schulz, and H. Spence, page 1, American Geophysical Union, Washington, D. C., doi:10.1029/2004BK000104, 2005. Han, D.-S., T. Iyemori, M. Nos´e, H. McCreadie, Y. Gao, F. Yang, S.
Yamashita, and P. Stauning, A comparative analysis of low-latitude Pi2 pulsations observed byØrsted and ground stations,J. Geophys. Res.,
109, A10209, doi:10.1029/2004JA010576, 2004.
Kepko, L. and M. G. Kivelson, Generation of Pi2 pulsations by bursty bulk flows,J. Geophys. Res.,104, 25,021, 1999.
Kepko, L., M. G. Kivelson, and K. Yumoto, Flow bursts, braking, and Pi2 pulsations,J. Geophys. Res.,106, 1903, 2001.
Kepko, L., M. G. Kivelson, R. L. McPherron, and H. E. Spence, Relative timing of substorm onset phenomena,J. Geophys. Res.,110, A04203, doi:10.1029/2003JA010285, 2004.
Kim, K.-H., K. Takahashi, D.-H. Lee, N. Lin, and C. A. Cattell, A com-parison of Pi2 pulsations in the inner magnetosphere and magnetic pul-sations at geosynchronous orbit,J. Geophys. Res.,106, 18,865, 2001. Kim, K.-H., D.-H. Lee, K. Takahashi, C. T. Russell, Y.-J. Moon, and
K. Yumoto, Pi2 pulsations observed from the Polar satellite outside the plasmapause,Geophys. Res. Lett.,32, doi:10.1029/2005GL023872, 2005a.
Kim, K.-H., K. Takahashi, D.-H. Lee, P. R. Sutcliffe, and K. Yumoto, Pi2 pulsations associated with poleward boundary intensifications during the absence of substorms, J. Geophys. Res., 110, A01217, doi:10.1029/2004JA010780, 2005b.
Kim, K.-H., K. Takahashi, S. Ohtani, and S.-K. Sung, Statistical analy-sis of the relationship between earthwardflow bursts in the magne-totail and low-latitude Pi2 pulsations,J. Geophys. Res.,112, A10211, doi:10.1029/2007JA012521, 2007.
Kisabeth, J. L. and G. Rostoker, Currentflow in auroral loops and surges inferred from ground-based magnetic observations,J. Geophys. Res.,
78, 5573, 1973.
Kokubun, S., T. Yamamoto, M. H. Acuna, K. Hayashi, K. Shiokawa, and H. Kawano, The GEOTAIL magneticfield experiment,J. Geomag. Geoelectr.,46, 7, 1994.
Koskinen, H. E., R. E. Lopez, R. J. Pellinen, T. I. Pulkkinen, D. N. Baker, and T. Bosinger, Pseudobreakup and substorm growth phase in the ionosphere and magnetosphere,J. Geophys. Res.,98, 5801, 1993. Lester, M., W. J. Hughes, and H. J. Singer, Polarization patterns of Pi2
magnetic pulsations and the substorm current wedge,J. Geophys. Res.,
88, 7958, 1983.
Li, Y., B. J. Fraser, F. W. Menk, D. J. Webster, and K. Yumoto, Properties and sources of low and very low latitude Pi2 pulsations,J. Geophys. Res.,103, 2343, 1998.
Lyons, L. R., T. Nagai, G. T. Blanchard, J. C. Samson, T. Yamamoto, T. Mukai, A. Nishida, and S. Kokubun, Association between Geotail plasmaflows and auroral poleward boundary intensifications observed by CANOPUS photometers,J. Geophys. Res.,104, 4485, 1999. Mukai, T., S. Machida, Y. Saito, M. Hirahara, T. Terasawa, N. Kaya,
T. Obara, M. Ejiri, and A. Nishida, The low energy particle (LEP) experiment onboard the GEOTAIL satellite,J. Geomag. Geoelectr.,46, 669, 1994.
Murphy, K. R., A. Kale, I. J. Rae, I. R. Mann, and Z. C. Dent, Pi2 pulsation periodicity and variations in magnetotailflows, inProc. of Int. Conf. Substorms-8, pp. 1–6, 2006.
Nagai, T.et al., Structure and dynamics of magnetic reconnection for substorm onsets with Geotail observations,J. Geophys. Res.,103, 4419, 1998.
Nos´e, M. et al., Multipoint observations of a Pi2 pulsation on morn-ingside: The 20 September 1995 event, J. Geophys. Res., 108, doi:10.1029/2002JA009747, 2003.
Ohtani, S.et al., A multisatellite study of a pseudo-substorm onset in the near-Earth magnetotail,J. Geophys. Res.,98, 19,355, 1993.
Ohtani, S., M. A. Shay, and T. Mukai, Temporal structure of the fast convectionflow in the plasma sheet: Comparison between ob-servations and two-fluid simulations, J. Geophys. Res.,109, doi:10. 1029/2003JA010002, 2004.
Olson, J., Pi2 pulsations and substorm onsets: A review,J. Geophys. Res.,
104, 17,499, 1999.
Osaki, H., K. Takahashi, H. Fukunishi, T. Nagatsuma, H. Oya, A. Matsuoka, and D. K. Milling, Pi 2 pulsations observed from the Ake-bono satellite in the plasmasphere,J. Geophys. Res.,103, 17,605, 1998. Saito, T., Geomagnetic pulsations,Space Sci. Rev.,10, 319, 1969. Shiokawa, K.et al., High-speed ionflow, substorm current wedge, and
multiple Pi2 pulsations,J. Geophys. Res.,103, 4491, 1998.
Spasojevi´c, M., J. Goldstein, D. L. Carpenter, U. S. Inan, B. R. Sandel, M. B. Moldwin, and B. W. Reinisch, Global response of the plasmasphere to a geomagnetic disturbance,J. Geophys. Res., 108, doi:10.1029/2003JA009987, 2003.
Sutcliffe, P. R., Observations of Pi2 pulsations in a near ground state magnetosphere,Geophys. Res. Lett.,25, 4067, 1998.
Sutcliffe, P. R. and L. R. Lyons, Association between quiet-time Pi2 pul-sations, poleward boundary intensifications, and plasma sheet particle fluxes,Geophys. Res. Lett.,29, doi:10.1029/2001GL014430, 2002. Takahashi, K., S. Ohtani, and B. J. Anderson, Statistical analysis of Pi 2
pulsations observed by the AMPTE CCE spacecraft in the inner magne-tosphere,J. Geophys. Res.,100, 21,929, 1995.
Takahashi, K., B. J. Anderson, S. Ohtani, G. D. Reeves, S. Takahashi, T. E. Sarris, and K. Mursula, Drift-shell splitting of energetic ions injected at pseudo-substorm onsets,J. Geophys. Res.,102, 22,117, 1997. Takahashi, K., S.-I. Ohtani, W. J. Hughes, and R. R. Anderson, CRRES
observation of Pi2 pulsations: Wave mode inside and outside the plas-masphere,J. Geophys. Res.,106, 15,567, 2001.
Takahashi, K., K. Liou, and K. Yumoto, Correlative study of ultravi-olet aurora and low-latitude Pi2 pulsations, J. Geophys. Res., 107, doi:10.1029/2002JA009455, 2002.
Takahashi, K., D.-H. Lee, M. Nos´e, R. R. Anderson, and W. J. Hughes, CRRES electricfield study of the radial mode structure of Pi2 pulsa-tions,J. Geophys. Res.,108, doi:10.1029/2002JA009761, 2003. Tsyganenko, N. A. and D. P. Stern, Modeling the global magneticfield
of the large-scale Birkeland current systems,J. Geophys. Res.,101, 27,187, 1996.
Yamaguchi, R. et al., The timing relationship between bursty bulk flows and Pi2s at the geosynchronous orbit,Geophys. Res. Lett.,29, doi:10.1029/2001GL013783, 2002.
Yeoman, T. K. and D. Orr, Phase and spectral power of mid-latitude Pi2 pulsations: Evidence for a plasmaspheric cavity resonance,Planet. Space Sci.,37, 1367, 1989.
Yumoto, K.et al., Correlation of high- and low-latitude Pi2 magnetic pul-sations observed at 210◦magnetic meridian chain stations,J. Geomag. Geoelectr.,46, 925, 1994.
Yumoto, K.et al., The STEP 210◦magnetic meridian network project,J. Geomag. Geoelectr.,48, 1297, 1996.