R E S E A R C H
Open Access
Numerical simulation study on
effectiveness of shielding structure on
ultrasonic transmission tomography
Nan Li
1*, Kun Xu
2and Sihai Li
1Abstract
Ultrasonic tomography (UT) is a non-invasive multiphase flow detection technique. In ultrasonic transmission tomography, reconstruction images are derived from a direct wave signal transmitted through the materials in the sensing area. The maximum values of the received direct wave from the reference pattern and the measured pattern are normally used to reconstruct the images. The speed of sound in the pipe wall and the materials in the sensing area affect the received signal. This in turn affects image quality—especially when the arrival time of the direct wave propagated through the sensing area is close to the arrival time of the direct wave propagated through the pipe wall. Here, we describe a novel shielding structure for ultrasonic transmission tomography. The relative variation ratio (RVR) is defined and used to evaluate the validity of the shielding structure. LargerRVRvalues imply better signal resolution and better signal suppression. A simplified mode is discussed including the influence of the shielding structure’s design parameters on the received direct wave. The optimized shielding structure size was determined. A comparison of the results between the normal pipe and the shielding pipe indicated that the RVRincreased from 57.25 to 91.27%. This proves that the shielding structure can suppress the effect of the signal from the pipe wall on received direct wave signals.
Keywords:Ultrasonic tomography, Transmission mode, Shielding, Direct wave, Suppression
1 Introduction
Ultrasonic waves are sensitive to an object’s density and elasticity and can recover the component’s distribution in the sensing area via measurement of signal at the ultra-sonic transducers. This is known as ultraultra-sonic tomog-raphy [1]. Similar to electrical capacitance/resistance tomography (ECT/ERT) [2–4], this technique is used in many industrial applications [5, 6]. Researches have mainly focused on three parts. The first is ultrasonic tom-ography (UT) system design and sensor optimization. Since 1996, a series of related studies on UT system design and sensor optimization have been performed by Hoyle, Li, and Schlaberg et al. [7–9]. Takahashi et al. designed a 2-MHz PVDF sensor for UT systems, and the sensor can be used to simultaneously monitor the changes in ampli-tude and phase [10].
The second is the image reconstruction algorithm. Rahiman et al. presented an HBR (hybrid-binary recon-struction) algorithm to reconstruct two-phase flow. The reconstruction speed is 10 frames/s [11]. In 2012, he presented a new method to improve the spatial reso-lution of the reconstructed images. The experimental results proved that this method is feasible and valid [12]. In 2014 and 2015, Yang et al. used ellipse and hyperbola algorithms to reconstruct a series of a priori circle targets based on the ultrasonic reflection tomog-raphy system [13,14].
The third area of research is industrial applications. Brown et al. developed a UT system with applications in pneumatic conveyance [15]. Xu et al. demonstrated a UT system that monitors gas/liquid flow [16]. Schlaberg et al. built a 16-transducer ultrasonic reflection tomog-raphy systems for hydrocyclones, and the size and pos-ition of the air core could be monitored in real time. This system improved the separation efficiency of the hydrocyclone particles and slurries [17].
* Correspondence:[email protected]
1School of Automation, Northwestern Polytechnical University, Xi’an 710072,
China
Full list of author information is available at the end of the article
tenuation is also significant. The received signals are more or less interfered by the ultrasound waves propa-gated from the pipe wall—especially when the speed of sound in the pipe wall is greater than the direct wave propagated across the sensing area. The usual way to solve this problem is to place the transducers in the pipe and make full contact with the internal media so that the influence of the pipe can be eliminated. However, these arrangements are not allowed in some cases. Therefore, a method to suppress the effect of the pipe on the received signal is necessary.
This paper describes techniques to suppress the influence of the signals propagating in the pipe wall on the direct waves received by transducers. First, a UT system with a transmission mode is introduced followed by a novel structure named the “shielding structure”in Section2. The size of the shielding ture was optimized, and the effectiveness of the struc-ture was evaluated. We compared the signals between the UT system with a shielding structure and without a shielding structure.
2 Principle and methodology 2.1 Ultrasonic tomography
A typical UT system consists of a data acquisition unit, a data processing unit, and an image reconstruction algo-rithm [20]. Transducers are evenly placed around a pipe wall; the number varies based on application. All trans-ducers act as transmitters and receivers. For a system withntransducers, there aren(n−1)/2 measurements.
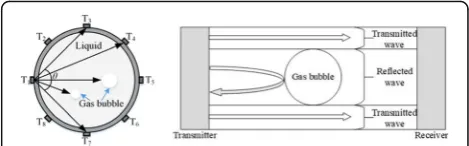
However, upon considering the quantity and quality of the data for better imaging, angular width θ of the main lobe of the transducer should be considered regardless of whether the system works in transmission mode or reflection mode. Five opposite transducers in a fan-shaped angle range are in the receiving state for an 8-transducer UT transducer (T1-T8) withθ= 90° (T1 is the transmitting transducer; Fig. 1). Each transducer is excited in turn, and 20 sets of data are obtained for imaging. Note that θ is a constant value when the de-sign parameters of the transducers are determined. Normally it is less than 90° (near 45°).
The sensitivity distribution at the sensing field was het-erogeneous due to the nonlinearity of the measurement system. Three basic parameters must be considered before
measurement of the UT sensor: the speed (c), wavelength (λ), and frequency (f) of the ultrasonic wave. The parame-ters satisfy the following function:λ=c/f.
The selection of transducer frequency thus becomes an important part. To detect the object in the sensing area, the smallest size of object a and excitation frequencyfshould satisfy Eq. (1), and the diffraction can be ignored [21].
2πfa
c ≫1 ð1Þ
For ultrasonic transmission tomography, only direct signals received by the transducers will be applied to de-termine whether there is any object by measuring the time of flight (TOF; Fig.2). When T1 is set as an ultra-sound transmitter, the received signal of R1 consists of the signal propagated from a directly transmitted path, a reflecting path from the bubble and the inner pipe wall, and an arc path in the pipe wall. The LBP (linear back projection) algorithm is usually used in ultrasonic trans-mission tomography. This algorithm mainly relies on the maximum amplitude value in direct wave time range.
In theory, the receiver cannot receive a direct wave signal when the gas bubble is placed on the propagation path between the transmitter and the receiver. Thus, the presence of the gas bubble can be identified. However, the signal propagated in the pipe wall also can be re-ceived at that time, and it certainly will affect the signal analysis. Therefore, a shielding structure is necessary.
2.2 Shielding structure
The shielding structure is intended to suppress the effect of the signals that propagate into the pipe wall. T1 is a transmitter, while R1 to R3 are receivers in Fig. 3. The shielding bulges are arranged on the outer of the pipe wall between a transmitter and a receiver. The ultra-sound wave propagated into the pipe wall will be
“absorbed”by these bulges.
3 Modeling and setups
To simplify the model, two opposing transducers are arranged outside of the pipe wall along the horizontal direction of the sensing section. One transducer is trans-mitter and another is receiver. The point source is excited by a sine wave signal modulated by a 5-cycle Hanning window. The excitation is 14 Pa, and the center frequency is 300 kHz. The pipe is made of acrylic with an outer diameter of 110 mm; the thickness of the pipe wall is 5 mm. A gas bubble is located at the center of the sensing area with a diameter of 20 mm.
Next, a parametric study was applied to evaluate the opti-mal size of the shielding structure. Two acrylic bulges with an initial heighthof 10 mm and initial widthwof 10 mm were symmetrically placed outside the pipe wall—these are perpendicular to the horizontal direction. The range of bulges handwvary from 10 to 40 mm, respectively. The diagram of the model is shown in Fig.4a, and the sound field distributions of 50, 70, and 80μs are illustrated in Fig. 4from (b) to (d). Note that the speed of the ultrasonic wave in acrylic and water are 2730 and 1473 m/s, respectively. This means that the arrival time of the ultrasonic wave propagated though the pipe wall is close to a direct wave transmitted through the water.
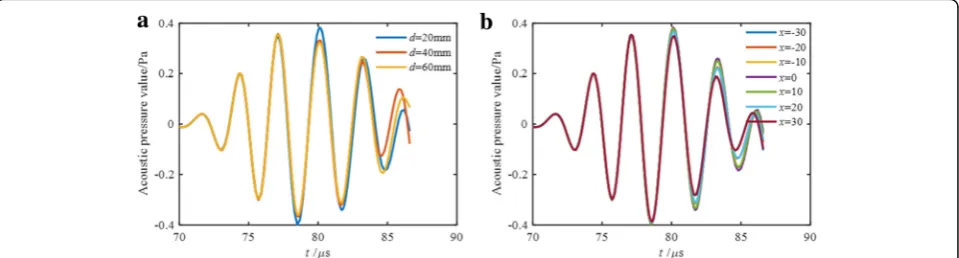
The gas bubble will block direct wave propagated across sensing section. The effect of the size and loca-tion of the gas bubble on the direct ultrasound wave sig-nals needs to be evaluated. The bubble position moves on the connecting line of the two transducers (T1 and R1) to guarantee the direct wave is blocked, i.e., the x axis direction. Here, two situations are considered: (1) The bubble diameterdchanges from 20 to 60 mm with a 20 mm interval at the center of the Section 2). The center position of the bubble moves from the position (−30, 0) to (30, 0) with a (10, 0) interval where the pos-ition (0, 0) is the center of sensing section. The results are shown in Fig.5. Considering differences in the sound speed in the pipe and water, the theoretical time range of the received direct wave is 71.6 to 88.2μs.
a
b
Fig. 2aThe three kinds of paths for ultrasonic wave propagation excitation signal and received signal (note: 1 refers to direct wave signal, 2 is reflected signal from bubble and pipe wall, and 3 is the signal propagated through the pipe wall).bMeasurement principle of ultrasonic transmission mode
The principles of the imaging algorithm suggest that we only care about the maximum value of the received direct wave signal. The results show that the maximum value of received signal is slightly affected by changes in the diameters and positions of the gas bubble. Therefore, the influence ofdandxon the received signal is ignored in this follow-up study.
4 Results and discussion
Equation (1) shows that the diffraction can be ignored in the following ultrasonic transmission tomography experi-ments. The validity of the shielding structure is evaluated in two steps based on the model demonstrated in Fig.4a.
Step 1: The received signals of R1 on the pipe without a shielding structure will be measured and analyzed for two situations: (a) the pipe is full of water or (b) a single gas bubble is located at the center state. In a follow-up study (normal pipe con-dition, NPC), these received values will be used as reference signals.
Step 2: The received signals of R1 on the pipe without a shielding structure will be measured and analyzed for two situations: (a) the pipe is full of
water and (b) a single gas bubble located at the center state. In a follow-up study (shielding pipe condition, SPC), these received values are used to compare with the reference signals and to then re-construct images.
At the same time, a set of experiments is given as a com-parison. In the experiment, the transducer has dual func-tions that it can be used either as a transmitter or as a receiver. The shape of piezoelectric transducer is cylinder. Its diameter and thickness are 10 and 6.7 mm, respectively. The frequency of 300 kHz is a center frequency of thick-ness vibration direction.
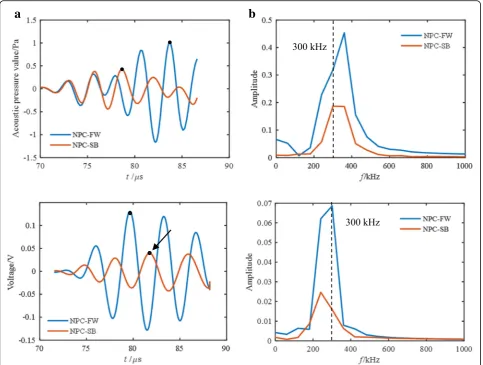
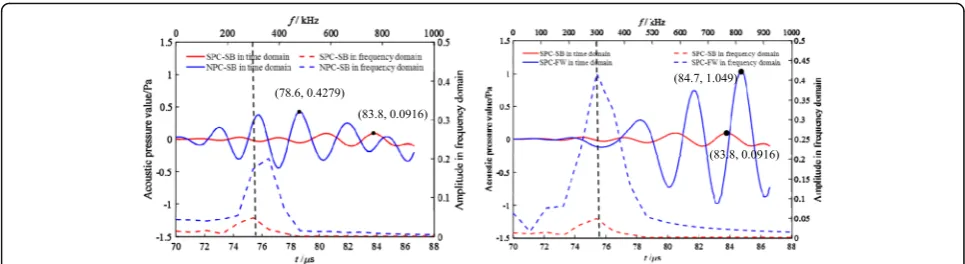
The reference signals from simulated results and experimental results are shown in Fig. 6. Note that only direct wave signals are given in follow-up fig-ures, i.e., the range of t is from 70 to 88.5 μs. Here, NPC-FW denotes that the model is full of water in NPC; NPC-SB refers to the model in which a single bubble is placed at the center of the NPC. Two max-imum points are highlighted in Fig. 6 due to the image reconstruction algorithm. The relative variation ratio, RVR, is defined as the following equation to evaluate the effectiveness of the shielding structure. Fig. 4A physical model and propagation process of ultrasonic wave inside the bulges:aphysical modelb50μs,c70μs, andd80μs
RVR¼Mmax−M
0
max
Mmax
100% ð2Þ
Here, Mmaxis received maximum value of direct wave signal in the pipe without gas bubbles.M′maxis received maximum value of direct wave signal in the pipe with a single bubble.RVRplays a key role in imaging part— lar-gerRVRvalues imply better imaging quality [20,21].
The Mmax is (83.7, 1.001) for NPC; M′max is (78.6, 0. 4279). TheRVRare 57.25 and 69.53% corresponding to the simulated and experimental results, respectively (Fig.6). The spectrum domain signals of the simulated and experimental results show that the most of the energy is concentrated around 300 kHz. These results indicate that the results cor-respond with the simulation. The numerical approach can provide an economical way to tackle the variables, and 2D approximations also support quick simulations. The follow-ing study will concentrate on the simulation.
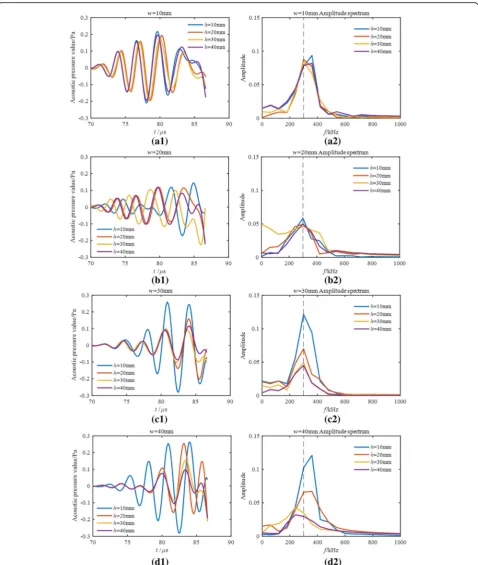
For SPC, the proper size of the acrylic bulges should be decided before the RVR can be calculated. These conditions are similar to Section 3. The effects of size and location of the gas bubble on the direct wave can be ignored. Thus, we set a single gas bubble at the cen-ter position of the sensing area with a 20 mm diamecen-ter. The maximum values of the measurement direct wave with a different combination of w and h are listed in Table1.
a
b
Fig. 6A comparison of the received direct signal of ultrasound waves between NPC-FW and NPC-SB:atime domain signals of simulated and experimental results andbfrequency domain signals of simulated and experimental results
Table 1The maximum acoustic pressure value of the direct waves with different widthwand heighthof shielding structure (Pa)
h/mm w/mm
10 20 30 40
Both w and h can affect the maximum value of dir-ect wave measurements; there is no monotonic chan-ging trend. For h> 10 mm, when w equals to h, the maximum acoustic pressure value of the direct wave is the smallest—these are highlighted by the red box in Table 1. The smallest value among all combinations (0.0916 Pa) is derived when w and h are 30 mm. It is difficult to have more definite conclusions from only Table 1. Therefore, the time domain and frequency domain signal of the received direct waves are pre-sented in Fig.7.
Figure7suggests that the time domain signals have no common change trend with changes inw. Atw= 10 mm, the waveform is slightly changed, and there are small changes in the phase and amplitude (Fig. 7(a1)). This point also can be observed in the frequency domain shown in Fig.7(a2). Note that forhvalues equal to 10 and 40 mm, the highest amplitude is at 380 kHz, but the exci-tation is 300 kHz. This means that the shielding structure does not filter out the influence of the signal propagated through the pipe wall. Therefore, this size is not suitable for the shielding structure of this study.
Atw= 20 mm, the main difference of the waveform is in the phase change (Fig.7(b1)). The frequency domain signal analysis shows that the peak value appears at 300 kHz for all ofhexcepth= 30 mm (Fig.7(b2)). The maximum value is insensitive to height of the shielding structure. This is not the best choice for shielding structures. Atw= 30 mm, the phase shift is small (Fig.7(c1)), and it also has a single peak at 300 kHz in the frequency domain (Fig.7c2). Most of the energy is concentrated at 300 kHz for allhvalues compared with the frequency domain signals whenw= 20 mm andw = 40 mm. When w= 40 mm, there is a large phase shift whenhincreases from 10 to 20 mm (Fig.7(d1)). The phase shift becomes smaller when h is larger than 20 mm. The frequency domain signals indicate that the performance of the shielding structure at a 40-mm width is better than the shielding structure with 20 mm (Fig. 7(d2)), but this is worse than the structure with 30 mm. Therefore, both the
wandhof the shielding structure should be 30 mm for op-timal performance. To evaluate the effectiveness of the shielding structure and compare the received direct signal of the ultrasound waves between SPC-SB and NPC-SB, the SPC-WF and SPC-SB are shown in Fig.8whenwandhof the shielding structure are 30 mm.
The maximum value of SPC-SB is smaller than the NPC-SB in both the time domain and the frequency domain. The peak value of NPC-SB in the frequency domain is 350 kHz. The peak values of SPC-SB and SPC-FW are 300 kHz. This means that the signals prop-agated through pipe wall have been suppressed. After calculation, the SPC RVR is 91.27%. This is obviously greater than RVR (57.25%) of NPC. These results can prove that the “shielding structure” suppresses the use-less ultrasonic waves propagated in the pipe wall.
5 Conclusions
The simulated and experimental results suggest the following:
(i) A parametric study determined the optimal size of the shielding structure. The“shielding structure”can effectively suppress the signal propagated in pipe wall. Simulation analysis shows that the proper size of acrylic bulges should be 30 mm forwandh. In this case, the amplitude of the received ultrasonic direct waves of SPC-SB is much smaller than NPC-SB. (ii) GreaterRVRvalues result in better imaging quality.
TheRVRof SPC is 91.27%, which is obviously
greater than theRVRof NPC.
(iii) The spectrum analysis shows that the central frequency
of SPC-SB and SPC-FW signal is 300 kHz whenwand
hare 30 mm. This suggests that the received direct wave signal is only from the water, and the influence of the signals from the pipe wall is suppressed.
Abbreviations
University of Technology from 2010 to 2016. Currently, he is an associate professor in Northwestern Polytechnical University. His main research interests include non-destructive testing and evaluation, automatic control, and process tomography.
Kun Xu received his B.S. degree in 2014 from Baicheng Normal University. He is currently a master student at Beijing University of Technology. His main research interests include non-destructive testing and evaluation, process tomography, and sensor technology.
Sihai Li received the M.S. and Ph.D. degrees in Navigation Guidance and Control from the School of Automation, Northwestern Polytechnical University (NWPU), Xi’an, China, in 1988 and 2000, respectively. He has been a professor of Northwestern Polytechnical University since 2008. He is the director of INS and Multi-sensor Integrated Navigation Research Group at NWPU. He is a leading expert in the area of aviation inertial navigation and integrated navigation systems in China with over 25 years’industrial experience. He is currently a council member of Chinese Society of Inertial Technology (CSIT).
Authors’contributions
NL proposed the shielding structure. He also analyzed the data and signals. KX performed the simulations. NL, KX, and SL wrote the paper. All authors read and approved the final manuscript.
Competing interests
The authors declare that they have no competing interests.
Publisher’s Note
Springer Nature remains neutral with regard to jurisdictional claims in published maps and institutional affiliations.
Author details
1School of Automation, Northwestern Polytechnical University, Xi’an 710072,
China.2College of Mechanical Engineering and Applied Electronics Technology, Beijing University of Technology, Beijing 100124, China.
Received: 27 January 2018 Accepted: 11 April 2018
References
1. Schlaberg HI, Yang M, Hoyle BS. Ultrasound reflection tomography for industrial processes. Ultrasonics.36(1), 297–303 (1998)
2. M Mao, J Ye, H Wang, et al., Evaluation of excitation strategies for 3D ECT in gas-solids flow measurement. IEEE Sensors J.16(23), 8523–8530 (2016) 3. N Li, M Cao, K Liu, et al., A boundary detecting method for post-tensioned
pre-stressed ducts based on Q-factor analysis. Sens. Actuators A Phys.248, 88–93 (2016)
4. A Lehikoinen, JMJ Huttunen, S Finsterle, et al., Dynamic inversion for hydrological process monitoring with electrical resistance tomography under model uncertainties. Water Resour. Res.46, W04513 (2010) 5. XX Dong, C Tan, Y Yuan, et al., Measuring oil-water two-phase flow velocity
with continuous-wave ultrasound Doppler sensor and drift-flux model. IEEE Trans. Instrum. Meas.65(5), 1098–1107 (2016)
6. DL Núñez, MA Molero-Armenta, MAG Izquierdo, et al., Ultrasound transmission tomography for detecting and measuring cylindrical objects embedded in concrete. Sensors17(5), 1085 (2017)
7. BS Hoyle, Process tomography using ultrasonic sensors. Meas. Sci. Technol.
7, 272–280 (1996)
8. W Li, BS Hoyle, Ultrasonic process tomography using multiple active sensors for maximum real-time performance. Chem. Eng. Sci.52(13), 2161–2170 (1997)
–
14. L Yang, C Xu, X Guo, et al., Ultrasonic tomography of immersion circular array by hyperbola algorithm. Telkomnika13(1), 65–75 (2015)
15. GJ Brown, D Reilly, D Mills, Development of an ultrasonic tomography system for application in pneumatic conveying. Meas. Sci. Technol.7, 396–405 (1996)
16. LJ Xu, Y Han, LA Xu, et al., Application of ultrasonic tomography to monitoring gas/liquid flow. Chem. Eng. Sci.52(13), 2171–2183 (1997) 17. HI Schlaberg, FJW Podd, BS Hoyle, Ultrasound process tomography system
for hydrocyclones. Ultrasonics38, 813–816 (2000)
18. Q Su, C Tan, F Dong, Mechanism modeling for phase fraction measurement with ultrasound attenuation in oil–water two-phase flow. Meas. Sci. Technol.
28(3), 035304 (2017)
19. G Steiner, C Deinhammer, Ultrasonic time-of-flight techniques for monitoring multi-component processes. Elektrotechnik Informationstechnik
126(5), 200–205 (2009)
20. LJ Xu, LA Xu, Ultrasound tomography system used for monitoring bubbly gas/liquid two-phase flow. IEEE Trans. Ultrason. Ferroelectr. Freq. Control
44(1), 67–76 (1997)