© 2015, IRJET.NET- All Rights Reserved
Page 132
Sensitivity Analysis of Maximum Overvoltage on Cables with
Considering Forward and Backward Waves
Hamed Touhidi
1,Mehdi Shafiee
2, Behrooz Vahidi
3, Seyed Hossein Hosseinian
41
Islamic Azad University, Bam Branch, Department of Electrical Engineering, Bam, IRAN
2PhD Student, Department of Electrical Engineering, Ferdowsi University of Mashhad, Mashhad, IRAN
3
Professor, Department of Electrical Engineering, Amirkabir University of Technology, Tehran, IRAN
---***---Abstract - lightning is known to be one of the primarysources of most surges in high keraunic areas. It is well-known fact that surge overvoltage is a significant contribution in cable failures. The other source of surge voltage is due to switching and it is pronounce on extra high voltage power transmission systems. The effect of both lightning and switching surges is weakening the cable insulation. The progressive weakening of such insulation will lead to cable deterioration and eventually its failure. Each surge impulse on the cable will contribute with other factors towards cable insulation strength deterioration and ultimately cable can fail by an overvoltage level below the cable basic impulse level (BIL). The maximum lightning overvoltage for a given cable depends on a large number of parameters. This paper presents the effect of model parameters (e.g., rise time and amplitude of surge, length of cable, resistivity of the core and sheath, tower footing resistance, number of sub conductors in the phase conductor (bundle), effect of surge arrester, length of lead, relative permittivity of the insulator material outside the core, power frequency voltage, stroke location, cable joints, shunt reactors, sheath thickness) on maximum cable voltage. The simulations show that the maximum overvoltage.
Keywords:
Maximum overvoltage, Sensitivity analysis,
Forward and Backward waves.
1. INTRODUCTION
power transmission network has developed during the last decades based on the use of over head line and cables [1].The insulation of underground insulated cables is not self restoring and the BIL can experience a decrease as a result of aging. Lightning overvoltage can be a major cause of underground cable failure; therefore it must be taken into account when designing the insulation system of a cable.IEC specifies one, two, or three BIL levels for each system voltage, thus giving the customer some room for adapting the BIL to the actual lightning overvoltage conditions. The manufacturer is simply required to produce cables that satisfy the lightning test voltages. CIGRE WG B1-05 is currently undertaking a study to assess the maximum voltage stress on long cables. This study is motivated by the possibility of reducing the
required test voltage for long cables that are protected by arresters, as the cable attenuation may reduce the maximum cable voltage well below the existing BIL’s. Therefore it is necessary to develop a technique which is able to estimate maximum overvoltage in power cables considering effective parameters. The resulting overvoltage at the cable ends has been subject to several investigations, e.g. [2-4] while in reality the maximum voltage may occur inside the cable [5, 6]. This maximum voltage can be found by calculating the voltage at selected positions along the cable (discretized model) [7]. This can be done by subdividing the cable into a number of small sections but error accumulation lead to inaccurate results. References[6,8,9] presents an improved approach where a regular line model is used for obtaining the voltages and currents at the line ends which are next used in the calculation at internal points using an off-line time step. However, in the case of steep-fronted lightning surges, the maximum voltage can only be determined with good accuracy if one of the selected positions is sufficiently close to the position of the maximum voltage. Article [10] is presented an analysis of the maximum voltage inside distribution cables from lightning strokes based on analysis by lattice diagrams. However, the technique does not cover the cable attenuation effects found in long transmission cables and the exact position of maximum voltage. In [11], maximum voltage is calculated by adding the peak value of the voltage wave in the forward and backward direction. The study presented in this paper is aimed at determining effect of model parameters on maximum lightning overvoltage (close back flashover) with the method which is explained in [11]. This goal is achieved by performing sensitivity analysis considering effective parameters on the maximum overvoltage. Simulation results show the importance of this study.
2.
COMPUTATIONAL
PROCEDURE
The maximum voltage was calculated based on the technique presented in [11]. The computation was carried out in three steps:
1) Calculation of the voltage at the exposed end of the cable assuming infinite cable length.
© 2015, IRJET.NET- All Rights Reserved
Page 133
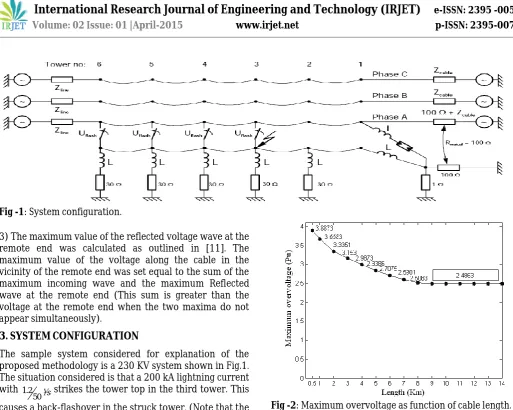
Fig -1: System configuration.3) The maximum value of the reflected voltage wave at the remote end was calculated as outlined in [11]. The maximum value of the voltage along the cable in the vicinity of the remote end was set equal to the sum of the maximum incoming wave and the maximum Reflected wave at the remote end (This sum is greater than the voltage at the remote end when the two maxima do not appear simultaneously).
3.
SYSTEM
CONFIGURATION
The sample system considered for explanation of the proposed methodology is a 230 KV system shown in Fig.1. The situation considered is that a 200 kA lightning current
with s
50 2 .
1 strikes the tower top in the third tower. This
causes a back-flashover in the struck tower. (Note that the voltages are presented in p.u. of the system voltage in all sections, i.e. 1. p.u. equals230 2
3 KV
). The complete
parameter model is given in Appendix.
4.
SENSITIVITY
ANALAYSIS
The maximum lightning overvoltage for a given cable depends on a large number of parameters. In this part the effect of model parameters on the maximum overvoltage was investigated.
4.1 Effect of cable length
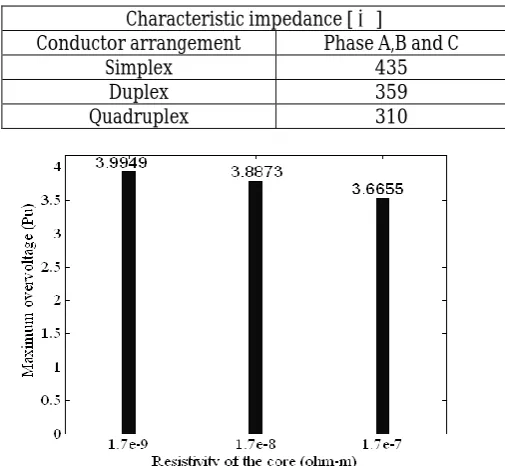
To study the effect of different cable lengths, simulations were carried out for cable lengths from 0.5 km to 14km.The results in Fig.2. Indicate that the maximum overvoltage along the cable is reduced with increasing cable length due to the cable attenuation and distortion effects combined with the finite duration of the impinging overvoltage at the exposed end. In the case of very long cables, the overvoltage level is limited to the arrester protective level at the exposed cable end plus the voltage drop along arrester leads. For shorter cables, the maximum voltage occurs within a few kilometers from the remote end where it may significantly exceed the arrester protective level.
Fig -2: Maximum overvoltage as function of cable length.
4.2 Effect of magnitude of lightning stroke
Fig.3. compares maximum overvoltage on cable with different magnitude of lightning strokes between 100 to 200KA with front time s
50 2 .
1 . As seen from the simulation
results in Fig.3. with decreasing magnitude of lightning stroke decreases the maximum overvoltage on cable.
© 2015, IRJET.NET- All Rights Reserved
Page 134
4.3 Effect of length of arrester lead
The magnitude of the transient voltage witch propagates down the cable is mainly determined by arrester discharge voltage, the lead lengths on the arresters and the rate-of-rise of surge current. Approximately this voltage is the sum of arrester voltage and the arrester lead-induced voltage, which is a function of the lead length and rate-of-rise of current surge (
t i
). Fig.4. shows
maximum overvoltage on cable as function of arrester lead lengths (e.g., 3,9and16 m). As seen from the simulation results in Fig.4. with increasing arrester lead lengths, maximum overvoltage on cable is increases.
Fig -4: Maximum overvoltage as function of length of arrester lead.
4.4 Effect of number of sub conductors in the
phase conductor (Bundle)
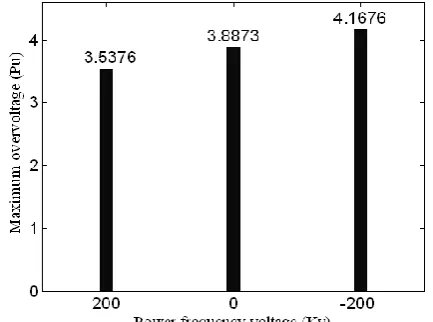
Fig.5. compares maximum overvoltage on cable with three different structures in phase conductor (simplex, duplex and quadruplex bundle) as seen from simulation results, maximum overvoltage in system with quadruplex bundles of over head line higher than system with simplex bundle of over head line. The reason is that, the over head line surge impedance decreases, it causes an increase in the ratio of the characteristic impedance of the cable and the line. This factor causes the peak value of the impinging voltage increase at exposed end. The change in the surge impedance of line is shown in Table 1.
4.5 Effect of resistivity of the core material
Fig.6. compares maximum overvoltage on cable with three different values of resistivity of the core material (e.g., material, maximum overvoltage on cable decreases. The reason is that the attenuation coefficient was increases and causes the voltage peak value of a voltage wave transmitted along the cable are reduced. The change in the attenuation coefficient is shown in Table 2.
Fig -5: Maximum overvoltage as function of number of
4.6 Effect of resistivity of the sheath material
Fig.7. compares maximum overvoltage on cable with three different values of resistivity of the core material (e.g, Characteristic impedance []
Conductor arrangement Phase A,B and C
Simplex 435
Duplex 359
© 2015, IRJET.NET- All Rights Reserved
Page 135
results with increasing the value of resistivity of thesheath material, maximum overvoltage on cable decreases. The reason is that the attenuation coefficient was increases and causes the voltage peak value of a voltage wave transmitted along the cable are reduced. The change in the attenuation coefficient is shown in Table 3.
Fig -7: Maximum overvoltage as function of resistivity of sheath material.
Table -3: Impact of resistivity of the sheath material on attenuation coefficient
4.7 Effect of resistivity of stroke location
Fig.8. compares maximum overvoltage on cable with three different locations (tower number 2, 3 and 4). The results show that the stroke location is very important. A very low peak value is obtained when the stroke hits on tower 4 because the peak value of the impinging voltage at exposed cable end is strongly reduce.
Fig -8: Maximum overvoltage as function of stroke location.
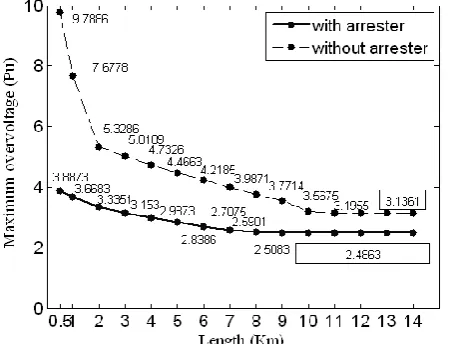
4.8 Effect of power frequency voltage
Fig.9. compares maximum overvoltage on cable with three different values of power frequency voltage (-200, 0and 200KV). As seen from the simulation results with increasing the value of power frequency voltage, maximum overvoltage on cable decreases. The reason is that the value of the reflected wave is strongly influenced by the power frequency voltage and the maximum value of the reflected wave decreases when power frequency voltage increases.
Fig -9: Maximum overvoltage as function of power frequency voltage.
4.9 Effect of surge rate-of-rise
The rate-of-rise of lightning current has significant influence on the level of maximum overvoltage at the cable and one of factors that effected on back flashover voltage. We investigated this influence with 200
KA
lightning current waveform with rise times varying from 0.1 to 3s
(0.1, 1.2, 3
s
). As seen from the simulation results presented in Fig.10. The maximum overvoltage will increase when the front time of surge decreases. It means that, increasing the front time of surge cause reduction the peak value of the impinging voltage.Fig -10: Maximum overvoltage as function of rise time. Resistivity of the sheath
material Attenuation coefficient (dbkm) 8
10
*
8
.
2
0
.
268066
7
10
*
8
.
2
0
.
467032
6
10
*
8
.
© 2015, IRJET.NET- All Rights Reserved
Page 136
4.10 Effect of arrester
Fig.11. compares maximum overvoltage on cable with and without considering arrester as function of cable length. As seen from the simulation result, maximum overvoltage on cable significantly reduced by the presence of surge arrester.
Fig -11: Maximum overvoltage as function of cable length with considering arrester and without arrester.
4.11 Effect of tower footing resistance
The tower footing resistance is one of factors that effected on back flashover voltage. During a back flashover, the major part of the stroke current flows in to ground via the over head shield wires and towers. And therefore, maximum overvoltage on the cables can be reduced by using an effective tower footing resistance. Simulation results in Fig.12. with different tower footing resistance (e.g., 10,40and 90
) shown that the maximum overvoltage on cable decrease significantly when the tower footing resistance decreases. And the overvoltage stresses on the cables can be reasonably controlled for tower footing resistances of 10
or lower.Fig -12: Maximum overvoltage as function of tower footing resistance.
4.12 Effect of thickness of sheath
Fig.13. compares maximum overvoltage on cable with three different values for thickness of sheath (e.g., 1, 2and3 mm).
As seen from the simulation results reducing the thickness of the sheath from 2 to 1 mm leads to a strong increase of the attenuation, where as a reduction from 3 to 2 mm has little effect. The change in the attenuation coefficient is shown in Table 4. This can be understood by considering that the dominant frequency component of the transient is about 10 KHZ. At this frequency, according to [12] the penetration depth in sheath is 2.4 mm, thus, increasing the thickness of the sheath beyond 2.4 mm will not lead to a significant change in the maximum overvoltage.
Fig -13: Maximum overvoltage as function of thickness of sheath.
Table -4: Impact of thickness of sheath on attenuation coefficient
Thickness of sheath (mm)
Attenuation coefficient (
km db
)
1
0
.
625473
2
0
.
445879
3
0
.
445601
4.13 Effect of
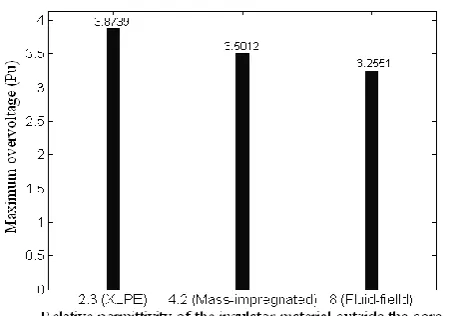
Relative permittivity of the
insulator material outside the core
Fig.14. compares maximum overvoltage on cable with three different values of relative permittivity of the insulator material outside the core (e.g., 2.3, 4.2 and8). As seen from the simulation results with increasing the value of relative permittivity, maximum overvoltage on cable decreases. The reason is that the attenuation coefficient was increases and causes the voltage peak value of a voltage wave transmitted along the cable are reduced.
4.14 Effect of
Shunt reactors
© 2015, IRJET.NET- All Rights Reserved
Page 137
at each cable end, the effect of the reactors was only a 2 kVchange to the maximum overvoltage.
Fig -14: Maximum overvoltage as function of relative permittivity of the insulator material outside the core.
4.15 Effect of
Cable joints
Cable joints can have significantly higher surge impedance than the cable and may therefore result in a higher cable overvoltage. The cable voltage increases with increasing value for the joint/cable surge impedance ratio and with increasing joint length. In practice, the joint/cable surge impedance ratio will be smaller than 1.45 and joints are usually shorter than 5 m. In order to assess the effect of joints on the cable overvoltage, calculations were done assuming 5 m joint length and 1.45 for the joint/cable surge impedance ratio the maximum voltage increase was found to be smaller than 1%.
5. CONCLUSIONS
In this paper considering from sensitivity analysis that the maximum overvoltage on cable:
1) Is significantly reduced by the presence of surge arresters.
2) Increases when increasing the grounding impedance of towers.
3) Increases when increasing the number of sub conductors in a bundle.
4) Increases when decreasing the rise time of lightning stroke.
5) Increases when increasing the magnitude of lightning stroke.
6) Decreases when increasing the length of cable. 7) Increases when increasing the length of arrester lead. 8) Increases when power frequency voltage decreases. 9) is strongly dependent on which tower the back
flashover takes place
10)is reduced when decreasing the sheath thickness 11)is reduced when decreasing the conductivity of the
sheath material
12)is reduced when decreasing the conductivity of the core material
13)is reduced when increasing the relative permittivity of the insulator material outside the core
14) The presence of shunt reactors and joints has only a minor effect on the maximum cable overvoltage.
REFERENCES
[1] M. DEL Brenna, F. Donazzi, A. Mansoldo, “Long Length EHV under Grounded Cable Systems in the Transmission Network”, Cigre Conference 2004, Paris, paper B1-304.
[2]E.W. Greenfield and W.A. Pullmann, “Transient behaviour of short and long cables", IEEE Trans. Power Apparatus and Syst., vol. 103, no. 11, pp. 3193-3204, November1984.
[3] S.A. Probert, Y.H. Young, P.K. Basak and C.P. Ferguson, “Review of the Basic Insulation Level for 400 kV Oil -Filled Cable Systems: Switching and temporary over voltages (TOV),ETEP 2003,PP.277-283.
[4]P.P. Barker, “Voltage Quadrupling on a UD Cable”, IEEE Trans. Power Delivery, Vol5, no.1, 1990.PP. 498 – 501. [5]J. Huse, K.Olsen and T. Ulriksen, ”Lightning Over
voltages in Cable Connection''Electra,no.58,1978. [6]L. Marti and H.W. Dommel, “Calculation of Voltage
Profiles Along Transmission Lines”, IEEE Trans. Power Delivery, vol. 12, no. 2, pp. 993-998, April 199.
[7]M.H.Shwehdi, M.A Abdalla, “The Use of Emtp for Analyzing a Cable Terminated Transformer under a Lightning Surge”. IECEC-Volume 3, 27 July-1 Aug. 1997 Page(s):2208 - 2210 vol.3 1998.
[8]B. Gustavsen, J. Mahseredjian. “Simulation of internal over voltages on transmission lines by an extended method of characteristics approach”. IEEE Transactions on Volume 22, Issue 3, July 2007 Protection of Underground Distribution Cables,” IEEE Trans. Power Del., vol. 15, no. 2, pp. 756–763, Apr. determination for modeling system transients-Part II: Insulated cables”, IEEE Trans. Power Delivery, vol. 20, no. 3, pp. 2045- 2050, July 2005.
[13]V. L. Paucar, M.J. Rider, “Artificial neural network for solving the power flow problem in electric power system”, Electr. Power Syst. Res. 62 (2002),pp.139– 144.
[14] S. Haykin, Neural Network: A Comprehensive Foundation, 2nd ed. Prentice Hall, 1998.
© 2015, IRJET.NET- All Rights Reserved
Page 138
A. System configurationSystem that shown in Fig.1, Contain a lossless distributed parameter line model represents each span with four conductors .The two shield wires are assumed to have the same potential and they are considered as a fourth conductor. The phase conductors are at the remote end of the last span terminated by a resistance which is equal to the equivalent characteristic impedance (
412 l
z ) when neglecting the presence of the other conductors. Each tower is represented by an inductance L. Five possible flashover locations are considered, each represented by a switch that closes when the absolute value of the voltage across the switch exceeds the voltage
U
flash (Uflash=1000KV). B. Surge arrester
The arrester is modeled as a series connection of an inductance L and a non-linear static arrester characteristic. Table 5 shows the applied surge arrester current-voltage characteristic. The leads are represented by inductances based on
m H
1 .
Table -5: Surge arrester current-voltage characteristic
Current(A) Voltage(V)
A full frequency-dependent transmission line model is used for the cable when calculating the voltage at remote end of the cable. Cable arrangement and physical data of a cable are shown in Fig.15. and Table 6.
Fig -15: Cable configuration.
Table -6: Physical data of 230 KV cable
Name Value
Inner radius of core (cm) 0.0
Outer radius of core (cm) 2.34
Inner radius of sheath (cm) 3.85
outer radius of sheath (cm) 4.13
Outer insulator radius (cm) 4.84
Core resistivity (m) 6
All relative permeability
r 1.0Earth resistivity (
m
) 100engineering from Shahid Bahonar
University, Kerman, Iran, in 2005 and the M.S. degree in electrical engineering from Shahid Bahonar University, Kerman, Iran, in 2008. His main fields of research are image processing, high voltage, electrical insulation and power system transient.
Mehdi Shafiee was born in Kerman, Iran, in 1983. He received the B.S. in electrical
engineering from Shahid Bahonar
University, Kerman, Iran, in 2006 and the M.S. degree in electrical engineering from Amirkabir University of Technology, Tehran, in 2008. Currently, he is pursuing the Ph.D. degree with the Department of Electrical Engineering Mashhad University. His main fields of research are high voltage, electrical insulation, power system transient, FACTS devices and Renewable energies.
Behrooz Vahidi (M’00–SM’04) was born in
Abadan, Iran, in 1953. He received the B.S. degree in electrical engineering from Sharif University of Technology, Tehran, Iran, in 1980, the M.S. degree in electrical engineering from Amirkabir University of Technology, Tehran, in 1989, and the Ph.D. degree in electrical engineering from the University of Manchester Institute of Science and Technology, Manchester, U.K., in 1997. His main fields of research are high voltage, electrical insulation, power system transient, lightning protection, and pulse power technology.