Original article
Evaluating temporal patterns of snakebite in
Sri Lanka: the potential for higher snakebite
burdens with climate change
Dileepa Senajith Ediriweera
,
1,2* Peter John Diggle,
2Anuradhani Kasturiratne,
3Arunasalam Pathmeswaran,
3Nipul Kithsiri Gunawardena,
4Shaluka Francis Jayamanne,
5Geoffrey Kennedy Isbister,
6,7Andrew Dawson,
6,8David Griffith Lalloo
9and Hithanadura Janaka de Silva
51
Centre for Health Informatics, Biostatistics and Epidemiology, Faculty of Medicine, University of
Kelaniya, Ragama, Sri Lanka,
2Centre for Health Informatics, Computing and Statistics, Lancaster
University Medical School, Lancaster, UK,
3Department of Public Health, Faculty of Medicine,
University of Kelaniya, Ragama, Sri Lanka,
4Department of Parasitology, University of Kelaniya,
Ragama, Sri Lanka,
5Department of Medicine, Faculty of Medicine, University of Kelaniya, Ragama, Sri
Lanka,
6South Asian Clinical Toxicology Research Collaboration, University of Peradeniya, Peradeniya,
Sri Lanka,
7Clinical Toxicology Research Group, University of Newcastle, Waratah, Australia,
8
Addiction Medicine, Central Clinical School, Faculty of Medicine, University of Sydney, Sydney,
Australia and
9Department of Clinical Sciences, Liverpool School of Tropical Medicine, Liverpool, UK
*Corresponding author. Centre for Health Informatics, Biostatistics and Epidemiology, Faculty of Medicine, University of Kelaniya, Ragama, Sri Lanka. E-mail: [email protected]
Editorial decision 7 August 2018; Accepted 20 August 2018
Abstract
Background:
Snakebite is a neglected tropical disease that has been overlooked by
healthcare decision makers in many countries. Previous studies have reported seasonal
variation in hospital admission rates due to snakebites in endemic countries including
Sri Lanka, but seasonal patterns have not been investigated in detail.
Methods:
A national community-based survey was conducted during the period of
August 2012 to June 2013. The survey used a multistage cluster design, sampled
165 665 individuals living in 44 136 households and recorded all recalled snakebite events
that had occurred during the preceding year. Log-linear models were fitted to describe
the expected number of snakebites occurring in each month, taking into account
sea-sonal trends and weather conditions, and addressing the effects of variation in survey
effort during the study and of recall bias amongst survey respondents.
Results:
Snakebite events showed a clear seasonal variation. Typically, snakebite
incidence is highest during November–December followed by March–May and August,
but this can vary between years due to variations in relative humidity, which is also a
risk factor. Low relative-humidity levels are associated with high snakebite incidence.
VCThe Author(s) 2018. Published by Oxford University Press on behalf of the International Epidemiological Association. 1
This is an Open Access article distributed under the terms of the Creative Commons Attribution License (http://creativecommons.org/licenses/by/4.0/), which permits unre-stricted reuse, distribution, and reproduction in any medium, provided the original work is properly cited.
doi: 10.1093/ije/dyy188 Original article
If current climate-change projections are correct, this could lead to an increase in the
an-nual snakebite burden of 31.3% (95% confidence interval: 10.7–55.7) during the next 25–
50 years.
Conclusions:
Snakebite in Sri Lanka shows seasonal variation. Additionally, more
snake-bites can be expected during periods of lower-than-expected humidity. Global climate
change is likely to increase the incidence of snakebite in Sri Lanka.
Key words:Sri Lanka, snakebite, seasonal variation, weather, relative humidity, global climate change
Introduction
Sri Lanka—a tropical island nation in the Indian ocean—is host to more than 100 terrestrial snake species. Annual snakebite incidence in Sri Lanka is about 400 per 100 000 people, corresponding to 80 000 snakebites in a 20 million population.1,2 Previous data have indicated geographical variation and seasonal patterns in snakebites across the world.3–5Previous local studies have also reported seasonal variation in hospital admission rates due to snakebites, e.g. the peak incidence in admissions due to bites byBungarus caeruleusin September–October6and byDaboia russeliiin
March–April and October–November.7 Similar patterns have been reported in other parts of the world.8–13
There are four climate seasons in Sri Lanka; the South-West monsoon (‘Yala’ season) operates from May to September, bringing rain to central highlands, southern and western parts of the country, whilst the North-East monsoon (‘Maha’ season) lasts from December to February, bringing rain into the northern and eastern parts of the country. Sri Lanka is an agricultural country whose agricultural activities are mainly carried out in the ‘Yala’ and ‘Maha’ seasons.14,15 Snakebite is considered as an occupational hazard; high incidences of snakebites have been reported during the periods of high rains and agricultural activity.3,6,7,16
Global climate change is likely to have adverse effects on health during the twenty-first century, especially in devel-oping countries with low income. Increasing incidences in a number of food-borne, water-borne and vector-borne
diseases have been recognized, but snakebite, which is a dis-ease of poverty, has not been emphasized.17,18According to the representative concentration pathways’ (RCP) interme-diate scenarios (i.e. RCP 4.5 and RCP 6),19Sri Lanka will experience an increase of approximately 1.0–2.0C in
max-imum temperature by 2100.20,21 Snakes are cold-blooded animals and climate change is likely to alter their geograph-ical distribution. Previous studies have attempted to evalu-ate the effect of climevalu-ate change on snakebite based on snake distributions and have highlighted the necessity for further research,22–24but no studies have evaluated the
ef-fect of climate change on the epidemiology of snakebite. Determining the geographical variation of snakebites provides useful information by identifying high-risk areas. This helps policy makers to target preventive measures and to allocate resources efficiently at the local level. Understanding the seasonal variation in snakebite inci-dence is also important to determine resource allocation at the operational level, e.g. the distribution of anti-venom based on seasonal requirements and deployment of tar-geted preventive measures.25,26 Geographical variation in
snakebite incidence has been studied in Sri Lanka, but tem-poral snakebite patterns have not been evaluated. In this paper, we analyse the seasonal pattern of snakebite inci-dence and show the possible effect of global climate change on snakebite incidence in Sri Lanka during the next 25– 50 years. Our methodology highlights a general approach to addressing the effects of variable survey effort and recall bias associated with epidemiological surveys of this kind. Key Messages
• Snakebite incidence shows seasonal variation in Sri Lanka, with the highest incidence during November–December
followed by March–May and August.
• Lower-than-expected relative humidity in a given season leads to higher snakebite incidence.
• Global climate change is likely to increase the snakebite burden in Sri Lanka during next 25–50 years.
• This study demonstrates a general approach to addressing the effects of variable survey effort and recall bias
associ-ated with epidemiological surveys.
Methods
Definitions
Survey month is the month where the survey was con-ducted. The National Snakebite Survey was conducted for 11 consecutive months andsurvey monthsare denoted by ‘s’ (i.e.s¼1, 2,. . .11).
Bitten monthis the month where the victim experienced a snakebite. The National Snakebite Survey reported snake-bite events that occurred during a period of 23 months and bitten monthsare denoted by ‘t’ (i.e.t¼1, 2,. . .23). Note that the 13thbitten monthcorresponds to the 1stsurvey month, as survey reported snakebite data for the preceding 12 months.
Average meteorological parameters in a given bitten month represent the mean value across all the locations that reported snakebites in a given bitten month (e.g. average rainfall in January 2012 represents the mean rainfall over all the locations that reported a snakebite in January 2012).
Data sources
Epidemiological data
An island-wide community-based National Snakebite Survey was conducted between August 2012 and June 2013.1The study sampled about 1% of the Sri Lankan pop-ulation. Sri Lanka has 9 provinces and 25 districts. The survey design used multistage cluster sampling, with 125 clusters sampled from each province and clusters allo-cated to districts within each province in proportion to the population size of each district. In each cluster, 40 consecu-tive households were sampled from a random initial house-hold on the electoral register. In the event of non-response (nobody in the household after two visits), the next house on the electoral register was selected. Data were collected by conducting face-to-face interviews with an adult household member. All snakebite events occurring in the sampled households during the year preceding the date of survey were recorded along with the date of each snakebite.
Meteorological measurements of weather
Average meteorological measurements in each bitten month were obtained from the Department of Meteorology, Sri Lanka. Meteorological measurements included rainfall, minimum temperature, maximum temperature, minimum
relative humidity and maximum relative humidity.
Meteorological measurements (i.e. weather data) pertaining to each location and time (i.e. bitten location and month) were then attached to each individual bite report. We then calculated the average meteorological measurements for each bitten month as the average value reported in all the bitten locations in a particular bitten month and used these
averaged meteorological values in each bitten month as ex-planatory variables for the analysis.
Statistical methods
The National Snakebite Survey in Sri Lanka was conducted over 11 consecutive months. Any snakebite experienced by any household member within the year preceding the date of interview was recorded in the survey. Therefore, the survey included snakebite events occurring between August 2011 and June 2013 (i.e. 23 months). We call the month in which the survey was carried out thesurvey monthand the month in which the snakebite occurred thebitten month. The num-ber of snakebites recorded in each bitten month is given in
Supplementary Figure 1, available asSupplementary dataat
IJEonline.
Accounting for survey methodology
The number of snakebites recorded in each bitten month depends on both the risk of snakebite and the effective sample size for the given month. The effective sample size for a given month in turn depends on the survey effort in that month (i.e. number sampled in a given month) and the number of survey months that contributed snakebite records to a particular bitten month. Survey effort also var-ied over time due to the variation in population density and the extent of the geographical area surveyed in a par-ticular month (Supplementary Figure 2, available as
Supplementary data atIJE online). Note that more than
1 survey month can contribute snakebite records to a par-ticular bitten month. For example, only the survey month August 2012 provided records of snakebites in the bitten month August 2011, whereas the August and September 2012 surveys both contributed to the number of snakebite records for the bitten month September 2011. For the data analysis, the number of snakebites recorded in each bitten month was further disaggregated across each of the con-tributing survey months so that the response variable was the number of bites recorded at each combination of bitten month and survey month, whilst survey effort in each sur-vey month was considered as an offset. Our data include 22 snakebites that occurred during the period of 23 bitten months but with recall duration more than 12 months. Therefore, our study had 158 combinations of bitten and survey months (i.e. 11 bites occurring in the same survey month, 125 bites pertaining to the preceding 12 months and 22 bites that occurred more than 12 months before the survey month but within the 23 bitten months).
Accounting for recall bias
The survey recorded snakebite events that occurred throughout the year preceding the date of survey, so the
number of recorded snakebites in any bitten month would be affected by recall bias. For this reason, the statistical model included the time difference between survey month and bitten month as a log-linear effect, corresponding to an exponentially decaying recall power.
Modelling snakebite events
The National Snakebite Survey reported 695 snakebite events from a sample of 165 665 individuals. Twenty snakebite events were removed during data cleaning due to missing values. We fitted a Poisson log-linear model to the number,Yst, of snakebites occurring in each bitten-survey
month, with expected numbers of bites: E(Yst)¼Effortsx exp{(s – t)aþetb}.
t¼1, 2,. . ., 23 bitten months (1)
s¼1, 2,. . .11 survey months.
In Equation (1), s is the survey month, t is the bitten
month,etis the exposure vector in monthtandEffortsis the
number of people sampled in survey monthsdivided by the total population of Sri Lanka. The following terms were considered for inclusion in the exposure vector: bitten month t, corresponding to a log-linear trend over the study period; sine and cosine functions with periodicities of 12, 6, 4 and 3 months to investigate seasonal effects; average values of minimum temperature, maximum temperature, minimum relative humidity, maximum relative humidity and rainfall with time-lags of 0, 1, 2 and 3 months. All of the meteoro-logical variables were de-seasonalized using sine and cosine functions to avoid confounding of weather effects with other, unrecorded seasonally varying factors. We refer to these de-seasonalized series asweather anomalies.
Forward variable selection with log-likelihood ratio assessment was used to determine which explanatory varia-bles should be included in the exposure vector et.
Confidence intervals (CIs) were calculated using the stan-dard Normal approximation to the sampling distribution of the maximum-likelihood estimates of the model parameters, and validated using a bootstrap method (Supplementary
Material, available as Supplementary data atIJE online).
Goodness of fit of the model was assessed by the ratio be-tween residual deviance and residual degrees of freedom and by residual plots. All computations used the R program-ming language version 3.2.3.27
The expected numbers of reported snakebites in any month, after adjusting for recall bias for each bitten-survey month, were estimated from the fitted log-linear model and used to calculate monthly snakebite estimates and 95% CIs for the whole country. Monthly snakebite estimates were then decomposed into seasonal and weather-related compo-nents, and predictions made under future climate scenarios. The only weather-related explanatory variable included in
the fitted log- linear model was relative humidity. We used the association between relative humidity and temperature to predict snakebite burden under scenarios corresponding to changes in temperature with rainfall fixed at current lev-els. Median monthly average levels of maximum relative hu-midity and maximum temperature over the study period were 89% and 31C, respectively. We would expect
approximately a 2.5% reduction in humidity if the tempera-ture were to increase by 0.5C, holding all other
environ-mental conditions fixed.28 We therefore predicted the country-wide monthly seasonal snakebite incidence under this scenario, i.e. for an average relative-humidity anomaly of –2.5%, to reflect a 0.5C increase in the mean annual
temperature in the country.
Ethics statement
Ethical approval for the National Snakebite Survey was obtained from the Ethics Review Committee of the Faculty of Medicine, University of Kelaniya. All interviews were conducted after obtaining informed written consent. Permission for conducting the survey was obtained from District- and Divisional-level public administrators.
Results
Weather patterns
Rainfall, relative humidity and temperature all showed clear seasonal variation during the study period. High rain-fall levels, high relative-humidity levels and low tempera-ture levels were observed towards the end of each year (i.e. 2011 and 2012). Relatively low rainfall and relative-humidity levels and high temperature levels were observed during May–June in 2012. Monthly time series of the aver-aged meteorological variables are shown in Figure 1. Summary statistics are given inTable 1.
Explanatory analysis
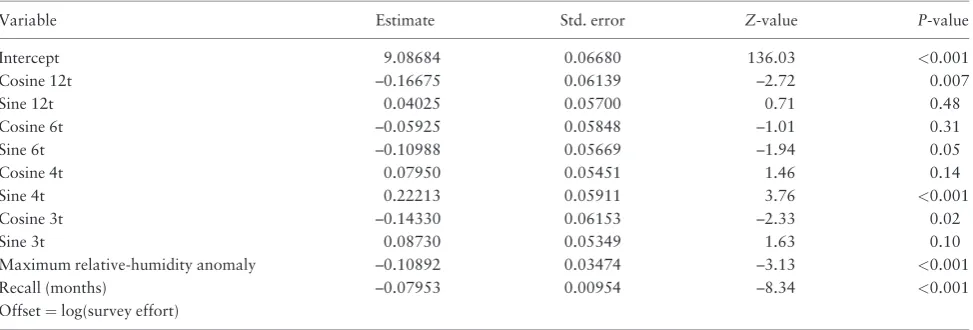
The fitted log-linear model for the recorded monthly num-bers of snakebites is summarized inTable 2. Adequacy of the fitted model was assessed using the deviance statistic, a residual vs fitted value plot and an autocorrelation plot. Residual deviance of the model was 146.56 with residual degrees of freedom 147; the associated chi-squared (gener-alized likelihood ratio) goodness-of-fit test gave no evi-dence of over-dispersion relative to the assumed Poisson distribution (p¼0.50). Plots of standardized residuals against fitted values, and of the residual autocorrelation, also gave no evidence of lack of fit (Supplementary Figure 3AandB, available asSupplementary dataatIJEonline).
Observed and predicted numbers of snakebites for each bitten month are shown inSupplementary Figure 4, avail-able asSupplementary dataatIJEonline.
Reported monthly snakebites showed a complex sea-sonal pattern, with contributions from sine–cosine pairs at 12-, 6-, 4- and 3-month periodicities. They also showed associations with maximum relative-humidity anomalies and with recall duration, i.e. the number of months be-tween bitten month and survey month. The expected
number of snakebites was higher in months with lower-than-expected average maximum relative humidity. The expected number ofreportedsnakebites decreased with in-creasing recall duration; the estimated snakebite recall probabilities for recall durations 3, 6 and 12 months were 0.79, 0.62 and 0.39, respectively.Supplementary Figure 5, available as Supplementary data atIJE online, compares the expected numbers of snakebites in the sample with and without adjustment for recall bias.
Figure 1.(a) Average rainfall; (b) average minimum temperature and maximum temperature; (c) average minimum relative humidity and maximum relative humidity in each bitten month.
Table 1.Summary statistics of average rainfall, minimum temperature, maximum temperature, minimum relative humidity and
maximum relative humidity in bitten months
Variable Mean (SD) Median (inter-quartile range) Coefficient of variation
Average rainfall over bitten months 143 (105) mm 140 (89.5–260.5) mm 73
Average minimum temperature over bitten months 22.3 (1.3)C 22.0 (21.5–23.0)C 5.9
Average maximum temperature over bitten months 30.4 (1.5)C 31.0 (30.0–31.0)C 4.8
Average minimum relative humidity over bitten months 71.9 (4.0) % 73.0 (70.0–76.0) % 5.6
Average maximum relative humidity over bitten months 87.2 (3.4) % 89.0 (85.5–91.0) % 3.9
Table 2.Parameter estimates from log-linear model (i.e. estimates are in log scale)
Variable Estimate Std. error Z-value P-value
Intercept 9.08684 0.06680 136.03 <0.001
Cosine 12t –0.16675 0.06139 –2.72 0.007
Sine 12t 0.04025 0.05700 0.71 0.48
Cosine 6t –0.05925 0.05848 –1.01 0.31
Sine 6t –0.10988 0.05669 –1.94 0.05
Cosine 4t 0.07950 0.05451 1.46 0.14
Sine 4t 0.22213 0.05911 3.76 <0.001
Cosine 3t –0.14330 0.06153 –2.33 0.02
Sine 3t 0.08730 0.05349 1.63 0.10
Maximum relative-humidity anomaly –0.10892 0.03474 –3.13 <0.001
Recall (months) –0.07953 0.00954 –8.34 <0.001
Offset¼log(survey effort)
Null deviance : 273.39 on 157 degrees of freedom. Residual deviance : 146.56 on 147 degrees of freedom.
Snakebite temporal patterns
Snakebites showed a seasonal pattern and an independent association with maximum relative-humidity anomaly
(Figure 2). According to the pure snakebite seasonal
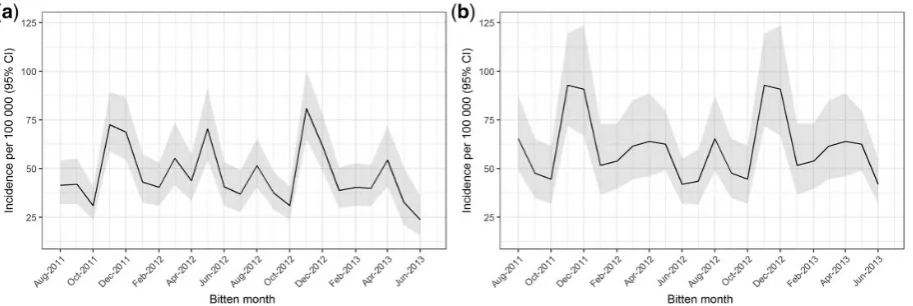
pat-tern, the highest expected snakebite incidence occurs during November–December, followed by March–May and August, whilst the lowest occurs during June–July, fol-lowed by October. The highest and lowest respective snakebite incidences are 70.7 (95% CI: 57.3–87.2) and 31.9 (95% CI: 23.5–43.3) per 100 000, whilst the overall monthly incidence is 45.7 (95% CI: 35.4–59.0). Lower-than-expected maximum humidity levels contribute to an increase in snakebite incidence and vice versa. For instance, expected snakebite incidences for May 2012 and May 2013 are 70.4 (95% CI: 54.2–91.5) and 32.9 (95% CI: 21.1–51.2) per 100 000, respectively, due to the differences in relative-humidity levels (i.e. –3.588 and 3.404, respec-tively) in these 2 months (Figure 3a).
Our model predicts the total number of snakebites in Sri Lanka during the calendar year 2012 to have been 119 000 (95% CI: 103 000–134 000) after accounting for recall bias and survey effort. Had there been no deviations from expectation in the seasonal weather patterns, i.e. zero anomaly in the maximum relative-humidity levels, during 2012, the predicted number would have been 110 000 (95% CI: 95 000–124 000).
Effects of different climate-change scenarios
According to our model, a 1% reduction in maximum rela-tive humidity at all times of the year holding rainfall fixed at current levels will increase snakebites by an estimated 11.5% (95% CI: 4.1–19.4). Similarly, a 2.5% reduction in
maximum relative humidity, corresponding to a 0.5C
in-crease in maximum temperature levels, will inin-crease snake-bites by 31.3% (95% CI: 10.7–55.7). Under the projection of a 0.5C increase in maximum temperature levels
nation-wide, these results imply the following. First, the expected annual snakebite burden will increase to 144 000 (95% CI: 122 000–166 000). Second, the incidence per 100 000 will rise to 92.8 (95% CI: 72.0–119.6) in November, the month of highest risk, and to 41.9 (95% CI: 31.8–55.3) in June, the month of lowest incidence. This will result in an overall monthly incidence of 60.0 (95% CI: 44.5–81.0)
(Figure 3b).
An alternative scenario is that a temperature increase associated with climate change will affect primarily dry months. A 1C temperature increase over 6 dry months
to-gether with no change in the other 6 months will increase the overall monthly incidence to 62.2 (95% CI: 49.1–74.1) per 100 000 and total number of snakebites to 147 000 (95% CI: 120 000–1 740 000) nationwide.
In summary, a 0.5C average increase in temperature
will substantially increase snakebites in Sri Lanka to a sim-ilar extent whether this average temperature increase is spread over the whole year or concentrated into the 6 dry months.
Discussion
The National Snakebite Survey showed clear seasonal vari-ation in snakebite incidence. Snakebites showed a complex seasonal pattern independently of the seasonal weather anomalies. The highest snakebite incidence was observed during the period November–December, with smaller peaks in March–May and August. Under average weather
Figure 2.Decomposed snakebite incidence plot. Dotted line indicates the estimated snakebite incidence without seasonal and weather effects (i.e. in-tercept of the fitted model). Dashed line indicates the seasonal variation in snakebite incidence without the weather effect (i.e. inin-tercept and harmonic functions of the fitted model). Solid line indicates the estimated snakebite incidence for the study period including seasonal and weather effects (i.e. full model).
conditions, Sri Lanka can expect monthly snakebite incidence of 46 bites per 100 000 population per month on average, increasing to 71 bites per 100 000 during November–December. Periods of lower-than-expected relative-humidity levels lead to higher-than-expected snakebite incidence and vice versa. Our estimated seasonal snakebite peaks are compatible with previous local data.6,7,16 Similar seasonal patterns have also been ob-served in other countries in the region.9,29–32
Regular seasonal weather patterns (i.e. rainfall, temper-ature and humidity) are closely associated with rotational movement of the Earth around the Sun. We therefore used harmonic mathematical functions to represent annual, bi-annual, quarterly and three-monthly regular components of variation in incidence. All the variables representing weather conditions were considered for inclusion in the model as anomalies, i.e. departures from expectation for the month in question, again using harmonic mathematical functions to describe their expected patterns of seasonal variation. This use of anomalies, rather than actual values, of weather-related variables enabled us to evaluate the effects of weather conditions independently of other sea-sonally varying factors with which they would otherwise have been confounded.33,34Therefore, the purely seasonal effects in the model (sine and cosine terms) can be consid-ered as proxies for seasonally varying expected weather and agricultural patterns, andweather anomaly effects as weather effects that cannot be explained by the purely sea-sonal pattern. After accounting for the purely seasea-sonal weather pattern, snakebites showed association with maxi-mum ambient relative humidity, but not with rainfall or temperature.35Monthly average maximum relative humid-ity showed the lowest coefficient of variation among the meteorological variables and exhibited more pronounced changes over time than either temperature or rainfall. Thus, maximum relative humidity can be considered as a
better representative of relevant monthly weather condi-tions in our study. A positive correlation between rainfall and snakebite has been shown in a number of studies,36–38 but it is possible that these reported correlations could be due to the rainfall acting as a proxy for the combined effects of unmeasured social and environmental factors.
Lower-than-expected maximum humidity levels in a given month were associated with higher numbers of snakebites and vice versa. This was clearly seen, e.g., in a comparison between May 2012 and May 2013, where esti-mated incidence was higher and lower, respectively, than the expected incidence according to the pure seasonal pat-tern. Previous literature has shown that certain snake spe-cies can be encountered more frequently on lower humid days and dry seasons, and high snake activity patterns may predispose to snakebites.39,40 During dry periods, Sri Lanka experiences high temperature and low rainfall, leading to low relative humid environmental conditions. More snakebites can be expected during such dry periods. A similar observation has been made in Costa Rica (Latin America), where more snakebites have been recorded in high-temperature and low-rainfall conditions.24
Snakebite patterns coincide with the agricultural sea-sons, with high numbers of snakebites observed at the be-ginning and end of the agricultural seasons corresponding to cultivation and harvesting times. The ‘Maha’ season is the main agricultural season in the country, starting during November–December. This explains the associated high snakebite burden during this time compared with the much lower incidence in the ‘Yala’ season that starts around May, when agricultural activities are largely confined to areas fed with irrigated water. On the other hand, heavy physical farming activities, leading to greater human inter-action with the environment, are usually over before the onset of heavy rains during the agricultural seasons and a correspondingly low snakebite incidence can be observed Figure 3.(a) Estimated snakebite incidence for the study period with 95% confidence interval. (b) Predicted snakebite incidence with 95% confidence interval for the scenario of a 2.5% reduction in maximum relative humidity, corresponding to a 0.5C increase in maximum temperature levels
hold-ing rainfall fixed at current levels.
during the mid-seasons. Subsequently, harvesting starts af-ter the heavy rains and high snakebite incidence can again be observed towards the end of farming seasons.6,7,16 Lower relative-humidity levels are expected at the begin-ning and end of each agricultural season compared with mid-season when rainfall is generally heaviest, and this is reflected in the estimated snakebite pattern during an agri-cultural season. In 1978, the Accelerated Mahaweli Programme deforested nearly 130 000 hectares of land in the country and settled farming communities in the dry zone. Subsequently, rodents, lizards and other potential snake-prey populations increased near human dwellings, especially during the harvesting seasons, predisposing to snakebites.29,41Also, outdoor activities take place during the dry warmer months, leading to high snakebite inci-dence during such months.42,43
Global climate-change models have projected that Sri Lanka will experience an increase of about 1.0–2.0C
in its maximum temperature levels by 2100 under the RCP 4.5 and RCP 6 scenarios. Accordingly, we can expect a 0.5C increase in maximum temperature levels over the
next 25–50 years.20We considered the inverse physical re-lationship between temperature and relative humidity in order to make future projections of snakebite incidence due to the global climate change.28 According to the fitted model, snakebite burden will escalate along with the increasing maximum temperature levels, and we should expect a nationwide increase of snakebites by 31% per cal-endar year over the next 25–50 years. Either homogenous or heterogeneous temperature increases over a year under global climate change will increase the national burden of snakebite to a similar extent. Increasing temperature will cause expansion of dry seasons and the drying-up of water sources, tanks and rivers. These changes affect snake eco-systems and the associated reduction in humidity levels will lead to further increase in snakebites.22 Hot weather conditions encourage foraging activity in reptiles8,44,45and
lack of water and food forces both snakes and snake-prey into human habitats, leading to an increase in the numbers of accidental snakebites.46 Therefore, it is important to identify snakebite as a health priority in a time of global climate change.22,24
Accuracy of recall of an event in an epidemiological study is related to the characteristics of the respondent and of the event of interest.47 Although snakebite events are significant events, still it is possible that victims and family members will forget the event. The National Snakebite Survey captured the snakebite events that occurred in the preceding year, and it could be anticipated that recorded bitten numbers will suffer from recall bias. We addressed this in our analysis by an exponentially decaying function of recall duration. Our analysis showed a significant and
substantial recall effect, and our final monthly snakebite estimates were derived after correcting for this. A particu-lar consequence of recall bias is that the true burden of snakebite in Sri Lanka is substantially greater than would be deduced simply from the number of snakebites recorded during the survey. This explains why a previous report based on a purely spatial analysis1 gave the estimated
total number of snakebites occurring in Sri Lanka as 80 000 bites per year, whereas the present analysis that accounts for recall bias estimates the annual snakebite bur-den to be approximately 110 000 under expected weather conditions, rising to 120 000 in years such as 2012, when humidity is lower than expectations.
The National Snakebite Survey was conducted over 11 months. Survey effort varied considerably from month to month due to the variation in population density in the surveyed areas as well as the geographical extent surveyed during a month. Similarly, the effective sample size for each bitten month varied from month to month. These fea-tures of the survey methodology were addressed by consid-ering the number of bites pertaining to each combination of bitten month and survey month as the response variable in a log-linear model that included an offset to represent the fraction of population sampled during each survey month. This allowed us to estimate the risk of snakebites at the national level in each bitten month.
Limitations
Our estimates are limited to inference on variation in snakebite incidence over a relatively short period of 23 months. Average monthly dew point would have been a better indicator of variation in monthly humidity than the average relative humidity, but the relevant data could not be obtained for the analysis. Our predictions of the effect of increasing temperature in snakebite incidence used the physical relationship between temperature and relative hu-midity, and the change in relative-humidity level resulting from an increase in temperature was calculated assuming other environmental conditions are fixed. In other words, we estimated the effect of global climate change based purely on a change in expected temperature and no change to rainfall. However, climate-change effects can only be explained fully by considering changes in ecosystems, pop-ulation growth, land use, urbanization and access to food and water.48The aim of the present study has been to eval-uate temporal variation in snakebite burden at the national level. We already know that snakebite burden exhibits spa-tial variation.1Our preliminary investigations suggest that
local patterns of temporal variation in snakebite burden also vary across the country. A likely contributory factor to this is that monsoon seasons occur at different times of
the year in the different parts of the country. We intend to investigate this, and other aspects of spatio-temporal inter-action, in a future study.
The present study has aimed only to evaluate snakebite burden at the national level. Seasonal patterns may differ at the regional level and it is known that different snake species respond differently to changes in weather conditions.24,35,49 Therefore, further studies are required to evaluate spatio-temporal variation of snakebites in Sri Lanka.
Conclusion
In conclusion, we have shown seasonal variation in snake-bite incidence in Sri Lanka, an independent adverse effect of low relative-humidity level and a potential increase in snakebite burden due to changes in global climate. These findings can inform healthcare decision-making at the national level. Our methodology for addressing recall bias and month-to-month variation in survey effort can be implemented in any generalized linear modelling software and is applicable to any epidemiological survey in which these features appear.
Supplementary data
Supplementary dataare available atIJEonline.
Funding
National Snakebite Survey was supported by the National Health Medical Research Council, Australia [NHMRC 631073, NHMRC 630650, NHMRC Program Grant 1055176, NHMRC Practitioner Fellowship 1059542, NHMRC Senior Research Fellowship 1061041]. Dileepa Ediriweera is supported by the Medical Research Council [MR/P024513/1].
Acknowledgements
The authors wish to acknowledge the assistance given by the Director General of Health Services, Provincial Directors of Health Services of the nine provinces, District Secretaries and Regional Directors of Health Services of the 25 administrative districts of Sri Lanka, all the Divisional Secretaries and the respective Grama Niladharis of the sampled Grama Niladhari Divisions for implemen-tation of the study. The technical contributions of Dr Suwin Hewage, Ms Dilki Erangika, Ms Ishara Henayake, Ms Nayana Harshakanthi, Ms W.M.A. Amarasinghe, Mr R.M.G.C.S.B. Jayatissa, Mr W.P.A. Wickramarathne, Mr J.H.M.B.T. Jayasundara, Mr V. Vijayakanth, Mr E.A.S. Edirisinghe, Mr R. Tudugala, Ms T.A.R. Dilrukshi, Mr T. Thivagar, Mr B.M.A.I. Balasooriya, Mr R.M.U.S. Rathnayake, Mr A. Aravinthan, Mr S.W. Buddhika, Ms H.R.I.N. Henayake, Mr K.A.S.K. Karunathilaka,
Mr S. Ushjenthan, Ms A.M.B.D.E. Bandarage, Mr S.M.R. Prasad, Mr P. Tishanthan, Mr T.B. Wickramasinghe and Mr N.W.M Chathuranga to the study are also acknowledged.
Conflict of interest:None declared.
References
1. Ediriweera DS, Kasturiratne A, Pathmeswaran Aet al. Mapping the risk of snakebite in Sri Lanka—a national survey with geo-spatial analysis.PLoS Negl Trop Dis2016;10:e0004813. 2. Jayawardana S, Gnanathasan A, Arambepola C, Chang T.
Chronic musculoskeletal disabilities following snake envenom-ing in Sri Lanka: a population-based study.PLoS Negl Trop Dis 2016;10:e0005103.
3. de Silva HJ, Kasturiratne A, Pathmeswaran A, Lalloo DG. Snakebite: the true disease burden has yet to be determined. Ceylon Med J2013;58:93–95.
4. Rahman R, Faiz MA, Selim Set al. Annual incidence of snake bite in rural Bangladesh.PLoS Negl Trop Dis2010;4:e860. 5. Mohapatra B, Warrell DA, Suraweera Wet al. Snakebite
mortal-ity in India: a nationally representative mortalmortal-ity survey.PLoS Negl Trop Dis2011;5:e1018.
6. Ariaratnam CA, Sheriff MHR, Theakston RDG, Warrell DA. Distinctive epidemiologic and clinical features of common krait (Bungarus caeruleus) bites in Sri Lanka.Am J Trop Med Hyg 2008;79:458–62.
7. Kularatne SAM. Epidemiology and clinical picture of the Russell’s viper (daboia russelii russelii) bite in Anuradhapura, Sri Lanka: a prospective study of 336 patients.Southeast Asian J Trop Med Public Health2003;34:855–62.
8. Chattopadhyay S, Sukul B. A profile of fatal snake bite cases in the Bankura district of West Bengal.J Forensic Leg Med2011;18:18–20. 9. Hansdak SG, Lallar KS, Pokharel P, Shyangwa P, Karki P, Koirala S. A clinico-epidemiological study of snake bite in Nepal.Trop Doct1998;28:223–26.
10. Ribeiro LA, Jorge MT, Iversson LB. Epidemiology of accidents due to bites of poisonous snakes: a study of cases attended in 1988.Rev Saude Publica1995;29:380–88.
11. Chippaux JP. Epidemiology of snakebites in Europe: a system-atic review of the literature.Toxicon2012;59:86–99.
12. Alkaabi JM, Al Neyadi M, Al Darei Fet al. Terrestrial snakebites in the south east of the Arabian peninsula: patient characteris-tics, clinical presentations, and management.PLoS One2011;6: e24637.
13. Chippaux JP. Incidence and mortality due to snakebite in the Americas.PLoS Negl Trop Dis2017;11:e0005662.
14. Climate of Sri Lanka [Internet]. 2017. http://www.meteo.gov.lk (2 November 2017, date last accessed).
15. Seo S-NN, Mendelsohn R, Munasinghe M. Climate change and agriculture in Sri Lanka: a Ricardian valuation.Environ Dev Econ2005;10:581.
16. Kularatne SAM, Silva A, Weerakoon Ket al. Revisiting Russell’s Viper (Daboia russelii) bite in Sri Lanka: is abdominal pain an early feature of systemic envenoming?PLoS One 2014;9: e90198.
17. IPCC Fifth Assessment Synthesis Report-Climate Change 2014 Synthesis Report.IPCC Fifth Assess Synthesis Report-Climate Change 2014 Synthesis Report. 2014, p. 167. IPCC, Geneva.
18. Harrison RA, Hargreaves A, Wagstaff SC, Faragher B, Lalloo DG. Snake envenoming: a disease of poverty.PLoS Negl Trop Dis2009;3:e569.
19. van Vuuren DP, Edmonds J, Kainuma Met al. The representa-tive concentration pathways: an overview.Clim Change2011;
109:5–31.
20. Trouet V, Van Oldenborgh GJ. KNMI climate explorer: a web-based research tool for high-resolution paleoclimatology. Tree-Ring Res [Internet]2013;69:3–13. http://www.bioone.org/doi/ abs/10.3959/1536-1098-69.1.3 (8 December 2017, date last accessed).
21. Area and Climate [Internet]. Department of Census and Statistics—Sri Lanka, Colombo. http://www.statistics.gov.lk/ (8 December 2017, date last accessed).
22. Nori J, Carrasco PA, Leynaud GC. Venomous snakes and cli-mate change: ophidism as a dynamic problem.Clim Change 2014;122:67–80.
23. Yanez-Arenas C, Townsend Peterson A, Rodrı´guez-Medina K,~ Barve N. Mapping current and future potential snakebite risk in the new world.Clim Change2016;134:697–711.
24. Chaves LF, Chuang T-W, Sasa M, Gutierrez JM. Snakebites are associated with poverty, weather fluctuations, and El Nino.Sci Adv2015;1:e1500249.
25. Chippaux J-P. Snakebite envenomation turns again into a neglected tropical disease!J Venom Anim Toxins Incl Trop Dis 2017;23:38.
26. Gutie´rrez JM, Williams D, Fan HW, Warrell DA. Snakebite envenoming from a global perspective: towards an integrated ap-proach.Toxicon2010;56:1223–35.
27. R Core Team.R: A Language and Environment for Statistical Computing. Vienna: R Foundation for Statistical Computing, 2015.
28. Lawrence MG. The relationship between relative humidity and the dewpoint temperature in moist air: a simple conversion and applications.Bull Amer Meteor Soc2005;86:225–33.
29. Brunda G, Sashidhar RB. Epidemiological profile of snake-bite cases from Andhra Pradesh using immunoanalytical approach. Indian J Med Res2007;125:661–68.
30. Lal DS, Rotti S, Danabalan M, Kumar A. Epidemiological profile of snakebite cases admitted in JIPMER hospital. Indian J Commun Med2017;26:36.
31. Hati AK, Mandal M, De MK, Mukherjee H, Hati RN. Epidemiology of snake bite in the district of Burdwan, West Bengal.J Indian Med Assoc1992;90:145–47.
32. Thapar R, Darshan BB, Unnikrishnan Bet al. Clinico-epidemio-logical profile of snakebite cases admitted in a tertiary care centre in South India: a 5 years study.Toxicol Int2015;22:66–70. 33. Stolwijk AM, Straatman H, Zielhuis GA. Studying seasonality
by using sine and cosine functions in regression analysis. J Epidemiol Community Health1999;53:235–38.
34. Morris A, Gozlan RE, Hassani H, Andreou D, Couppie´ P, Gue´gan J-F. Complex temporal climate signals drive the emer-gence of human water-borne disease.Emerg Microbes Infect 2014;3:e56.
35. Daltry JC, Ross T, Thorpe RS, Wu¨ster W. Evidence that humid-ity influences snake activhumid-ity patterns: a field study of the Malayan pit viper Calloselasma rhodostoma.Ecography (Cop) 1998;21:25–34.
36. Pirasath S, Gnanathasan A, Thadchanamoorthy S. Epidemic poi-soning with snakes in eastern Sri Lanka; epidemiological and clinical features in Batticaloa district.Epidemiol Open Access 2015;5:183.
37. Vaiyapuri S, Vaiyapuri R, Ashokan Ret al. Snakebite and its socio-economic impact on the rural population of Tamil Nadu, India.PLoS One2013;8:e80090.
38. Angarita-Gerlein D, Bravo-Vega CA, Cruz C, Forero-Munoz NR, Navas-Zuloaga MG U-CJ. Snakebite Dynamics in Colombia: Effects of Precipitation Seasonality on Incidence. IRES. 2017 [Internet] https://mcmsc.asu.edu/ (9 November 2017, date last accessed).
39. Sun LX, Shine R, Debi Z, Zhengren T. Biotic and abiotic influen-ces on activity patterns of insular pit-vipers (Gloydius shedaoen-sis, Viperidae) from north-eastern China.Biol Conserv2001;97: 387–98.
40. Brown GP, Shine R, Madsen T. Responses of three sympatric snake species to tropical seasonality in northern Australia. J Trop Ecol2002;18:549–68.
41. Keyler DE, Gawarammana I, Gutie´rrez JM, Sellahewa KH, McWhorter K, Malleappah R. Antivenom for snakebite enve-noming in Sri Lanka: the need for geographically specific anti-venom and improved efficacy.Toxicon2013;69:90–97. 42. Karabuva S, Vrkic I, Brizic I, Ivic I, Luksic B. Venomous
snakebites in children in southern Croatia.Toxicon2016;112: 8–15.
43. Spyres MB, Ruha AM, Seifert S, Onisko N, Padilla-Jones A, Smith EA. Occupational snake bites: a prospective case series of patients reported to the toxic North American snakebite registry. J Med Toxicol2016;12:365–69.
44. Nelson KJ, Gregory PT. Activity patterns of garter snakes, Thamnophis sirtalis, in relation to weather conditions at a fish hatchery on Vancouver Island, British Columbia. J Herpetol 2000;34:32–40.
45. Dehghani R, Rabani D, Panjeh Shahi M, Jazayeri M, Sabahi Bidgoli M. Incidence of snake bites in Kashan, Iran during an eight year period (2004–2011).Arch Trauma Res2012;1: 67–71.
46. Dupoue´ A, Stahlschmidt ZR, Michaud B, Lourdais O. Physiological state influences evaporative water loss and micro-climate preference in the snake Vipera aspis. Physiol Behav 2015;144:82–89.
47. Coughlin SS. Recall bias in epidemiologic studies. J Clin Epidemiol1990;43:87–91.
48. Haines A, Kovats RS, Campbell-Lendrum D, Corvalan C. Climate change and human health: impacts, vulnerability and public health.Public Health2006;120:585–96.
49. Franc¸a FGR, Braz VS. Diversity, activity patterns, and habitat use of the snake fauna of Chapada dos Veadeiros National Park in Central Brazil.Biota Neotrop2013;13:74–85.