R E S E A R C H
Open Access
Optimized threshold calculation for
blanking nonlinearity at OFDM receivers
based on impulsive noise estimation
Zehra Ali
1, Ferheen Ayaz
2*and Chang-Soo Park
1*Abstract
Impulsive noise (IN) degrades the performance of OFDM-based communication systems. Performance degradation is usually measured in terms of signal-to-noise ratio (SNR) and symbol-error rate (SER). To improve the performance of the system of OFDM receivers, one of the effective methods is to use blanking nonlinearity. In this method, the samples whose magnitudes exceed a certain fixed threshold are considered to be IN-affected and are therefore blanked. A fixed threshold does not always determine the IN-affected samples truly for all probabilities of IN occurrence. This paper proposes an optimized threshold-calculation method for blanking nonlinearity which is based on distribution characteristics of the received signal, i.e., mean, median, and peak. The proposed method can calculate an optimized threshold for all probabilities of impulsive noise occurrence. Simulation results show over 2.2-dB gain in SNR and lower SER by using the proposed method as compared to fixed threshold.
Keywords:OFDM; Blanking nonlinearity; Impulsive noise
1 Introduction
Impulsive noise (IN) is one of the most challenging factors of performance degradation in power line communica-tions [1]. One of the most widely used modulation tech-niques for PLC and wireless/wired channels is orthogonal frequency division multiplexing (OFDM). It offers many advantages like increased data rates, robustness in multi-path, and resistance to noise [2].
Impulsive noise (IN) is characterized by random oc-currences of short bursts with high amplitude [3]. High-spectral-power IN pulses degrade the performance of the OFDM system by reducing its signal-to-noise ratio (SNR) and increasing symbol-error rate (SER) [4]. One of the simple methods to improve system performance is to precede a conventional OFDM demodulator with blanking nonlinearity in which a signal sample is set to zero if its amplitude exceeds a particular threshold. This threshold is conventionally fixed in an OFDM receiver [5]. The fixed value of threshold plays a very important
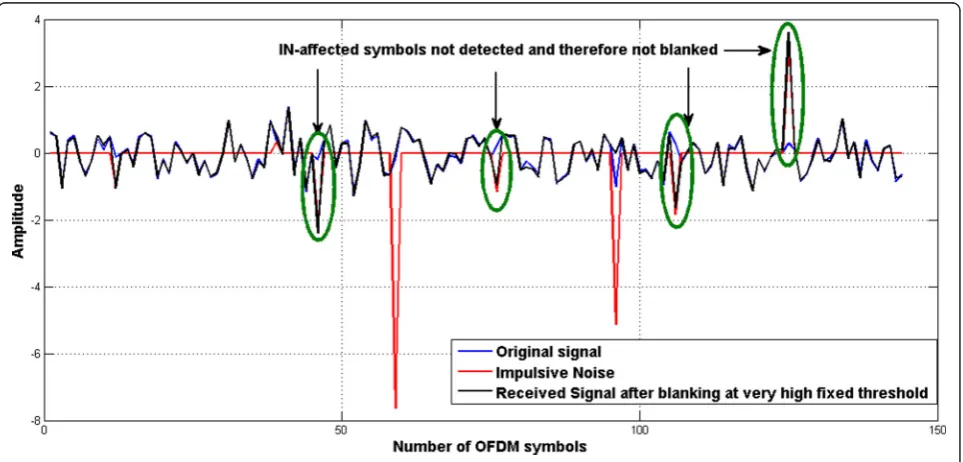
role in the resulting SNR of the system. This is because the samples whose amplitudes are greater than the threshold are presumed to be affected by IN and are therefore blanked. Samples whose amplitudes are lesser than the fixed threshold are considered to be true values of the signal—unaffected by IN and hence remain un-changed. Therefore, fixing a very high value of threshold may not blank all the IN-affected signals, and a very low value of threshold may blank the true samples [6]. Figures 1 and 2 explain the significant role of threshold.
Various methods to find optimal threshold have been reported in [7] and [8]. However, these methods are purely theoretical. A direct relationship between the peak of the transmitted signal and optimal threshold is derived in [8], but it is not feasible to determine the exact peak of trans-mitted signal of OFDM receivers. In this paper, we propose an optimized threshold-calculation method for blanking nonlinearity based on impulsive noise estimation (INE) by using distribution characteristics of the received signal, i.e., peak (maximum value), median, and mean. The use of median and mean in filtering and removing impulsive noise has already resulted in many well-established algorithms in [9] and [10]. The optimized threshold-calculation method proposed in this paper is
* Correspondence:[email protected];[email protected]
2Department of Electronic Engineering, NED University of Engineering and
Technology, Karachi, Pakistan
1School of Information and Communication, Gwangju Institute of Science
and Technology (GIST), Gwangju, South Korea
© 2015 Ali et al. This is an Open Access article distributed under the terms of the Creative Commons Attribution License (http://creativecommons.org/licenses/by/4.0), which permits unrestricted use, distribution, and reproduction in any medium, provided the original work is properly credited.
independent of the probability of IN occurrence and can be adapted to a receiver even if the probability of IN oc-currence in the channel is not known. Since the proposed method determines the optimized threshold using the characteristics of the received signal, instead of the trans-mitted signal, it can be used in practical scenarios.
The paper is organized as follows. Section OFDM sys-tem model and optimized threshold-calculation method describes the system model and optimized threshold-calculation method. The system performance of the
proposed optimized threshold (OT) is compared with a fixed threshold (FT) by simulations at different probabil-ities in Section Simulation results and discussions. Con-clusions are presented in Section ConCon-clusions.
2 OFDM System model and optimized threshold-calculation method
2.1 OFDM system model
The model for OFDM transmission system is shown in Fig. 3.
Fig. 1Blanking nonlinearity at very low fixed threshold applied to IN-affected signal
In the OFDM system, the time-domain signal s(t) is obtained by taking the inverse Fourier transform of the frequency-domain signal by using
s tð Þ ¼ 1ffiffiffiffi
WhereSkdenotes the frequency-domain signal,j¼ ffiffiffiffiffiffi
−1
p
,
Nis the number of subcarriers, andTsis the active symbol interval. The transmitted signal is passed through an addi-tive transmission channel, including addiaddi-tive white Gauss-ian noise (AWGN) and additive IN. AWGN is denoted by
wkand has variance.σ2w¼ð1=2ÞE wj jk 2
. IN is denoted by
ikand is modeled as a Bernoulli-Gaussian random process [4] as follows:
ik¼bkgk; 0≤k≤N‐1 ð2Þ
Where bkis the Bernoulli process of sequence ‘bk =1’ or ‘bk = 0’ with probability of p or 1 − p, respectively, and gk is the complex–zero mean white Gaussian noise
with variance σ2
i ¼ð1=2ÞE gk
2
h i
. Thus, the noisy
chan-nel can be characterized by the signal-to-AWGN ratioS NR¼10 log10 1=σ2
w
and signal-to-IN ratio SINR¼10 log10 1=σ2
i
. The received time-domain signal (rk) can be expressed as
The received signal is passed to the nonlinear preproces-sor. The output of the nonlinear preprocessorykis then fed to the OFDM demodulator for further processing and is represented in [5] as
Blanking:⋅yk¼ rkj j≤rk T
0 j jrk >T ;
ð4Þ
whereT is the blanking threshold andk= 0, 1, …, N−
1. The threshold value is a crucial parameter in blanking
Fig. 3Block diagram of the OFDM transmission system with the blanking device at the receiver
Fig. 4Block diagram of calculating optimized threshold from distribution characteristics of received signals
nonlinearity as it is responsible for deciding which signal is to be blanked [6].
2.2 The proposed optimized threshold-calculation method
We investigated that instead of fixing a threshold, blank-ing can result in higher SNR if it is performed at an opti-mized threshold (OT) determined by the distribution
characteristics of the received signal. The proposed cal-culation method for OT is shown in the form of a block diagram in Fig. 4.
For optimizing threshold, we define some parameters known as impulsive noise estimation (INE), alpha (α), beta (β), and gamma (γ). The value ofγcan be set by the user in the range of 5.1 ± 0.1. The values of INE,α, andβare calculated as shown in Eqs. (5), (6), and (7) as follows:
1 2 3 4 5 6 7 8 9 10
−10 −5 0 5 10
SNR, dB
beta
Fig. 5SNR with varyingβin OT
4 4.5 5 5.5 6
6 8 10 12 14 16 18
SNR, dB
gamma
p=0.01 p=0.03 p=0.1
INE¼ maxðrkð ÞdBÞ−mean rð kð ÞdBÞ ð5Þ
α¼median rð kð ÞdBÞ−mean rð kð ÞdBÞ ð6Þ
β¼γ−α ð7Þ
The threshold which gives maximum SNR based on INE is calculated as shown in Eq. (8).
OT¼INE=β ð8Þ
3 Simulation results and discussions
The computer simulation of the OFDM system is carried out with 16 QAM modulation, SNR = 40 dB, SINR =−15 dB, number of subcarriers,N= 105, σ2w¼ð1=2ÞE wj jk2
,
andσ2i ¼ð1=2ÞE gk 2
h i
.
0 20 40 60 80 100
6 8 10 12 14 16 18 20
Number of iterations
SNR, dB
p=0.01 OT p=0.03 OT p=0.1 OT p=0.01 FT p=0.03 FT p=0.1 FT
Fig. 7SNR of blanking nonlinearity with FT and OT for 100 iterations andp= 0.1,p= 0.03, andp= 0.01
0 20 40 60 80 100
1.4 1.6 1.8 2 2.2 2.4 2.6
Relative Gain (dB)
Number of Iterations
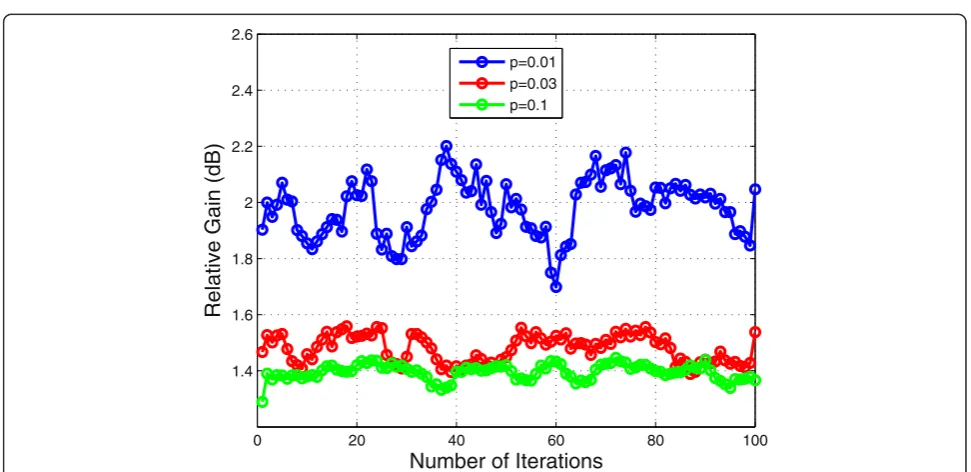
p=0.01 p=0.03 p=0.1Fig. 8Relative SNR gain with OT relative to FT blanking nonlinearity, 16 QAM modulation
Probability (p) of IN occurrence is considered to bep= 0.01, 0.03, and 0.1, which implies that 1, 3, and 10 % of the received samples will be affected by IN, respectively. Therefore, with 105subcarriers, the average number of IN pulses received within each OFDM symbol is (pN), i.e., about 1000, 3000, and 10,000 IN pulses per OFDM symbol for p= 0.01, 0.03, andp = 0.1, respectively. The output SNR is obtained by
SNR¼ E sj jk 2
E y k−sk
2
h i
0 @
1
A ð9Þ
Conventionally, the fixed threshold (FT) of OFDM re-ceivers may be selected in the range from 0 to 15 result-ing in an SNR of 0 to 18 dB [5]. It is also found that the value of optimal threshold which gives maximum SNR is Fig. 9Relative SNR gain with OT relative to FT blanking nonlinearity, 64 QAM modulation
14.5 15 15.5 16 16.5 17 17.5 18 18.5
10−4 10−3 10−2 10−1
SNR, dB
Symbol Error Rate
OT FT
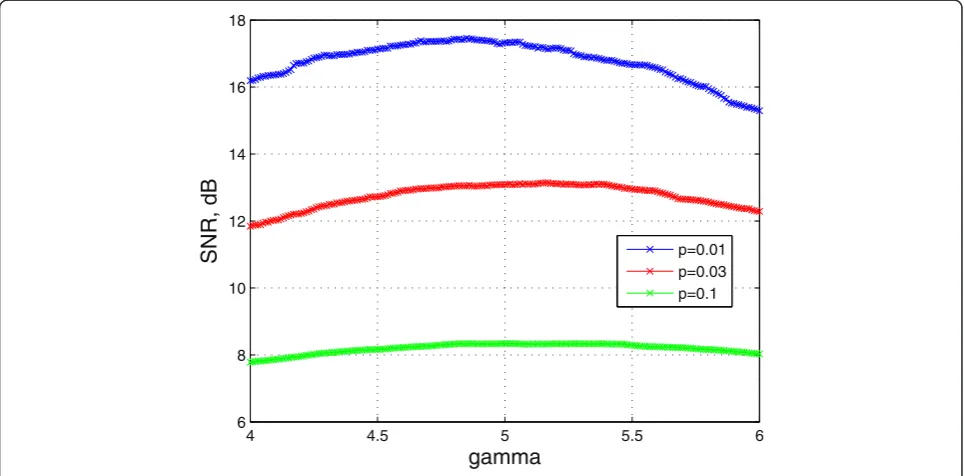
different for different probabilities of impulsive noise oc-currence [6]. In our method of calculating optimized threshold (OT) in Eq. (8), optimum value ofβlies in the range of 4 to 6 as shown in Fig. 5. In order to get more accurate results, we define β as in Eq. (7). Therefore, we have only one fixed parameter, gamma (γ), whose value can be 5.1 ± 0.1. As shown in Fig. 6, SNR fluctuates only ±0.15 dB by changing the value ofγwithin ±0.1 range.
For blanking with FT, the fixed optimal thresholds which maximize SNR were obtained from the results
reported in [6]. To check the accuracy of our simulation model in terms of the selection of FT, the SNR after blanking nonlinearity using FT was obtained in 100 iter-ations. Figure 7 shows that the simulation results of SNR with FT closely match the analytical results as obtained in [6]. Figure 7 also shows the plot of resulting SNR in 100 iterations after applying blanking nonlinearity using OT. It is clearly shown that OT outperforms FT in all IN scenarios by providing a higher SNR than that achieved by FT.
11 11.5 12 12.5 13 13.5
10−2 10−1 100
SNR, dB
Symbol Error Rate
OT FT
Fig. 11SER of blanking nonlinearity with OT and FT forp= 0.03
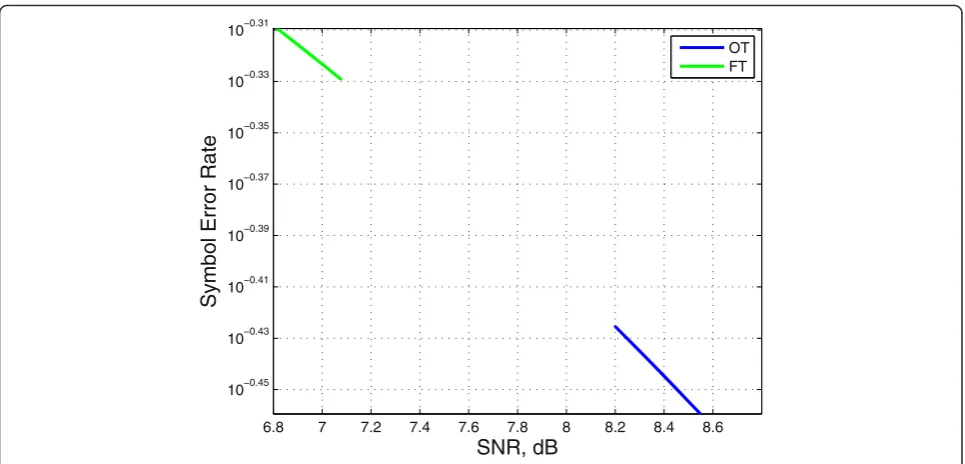
6.8 7 7.2 7.4 7.6 7.8 8 8.2 8.4 8.6
10−0.45 10−0.43 10−0.41 10−0.39 10−0.37 10−0.35 10−0.33 10−0.31
SNR, dB
Symbol Error Rate
OT FT
Fig. 12SER with OT and FT forp= 0.1
The relative gain in SNR achieved by OT as compared with FT is plotted in Fig. 8 using Eq. 10. The maximum achievable relative SNR gain is about 2.24 dB forp= 0.1, 1.16 dB forp= 0.01, and 1.73 dB for p= 0.03. Figure 8 shows that the relative SNR gain is never less than 0 for all probabilities. This means that blanking nonlinearity with OT never results in lower SNR than blanking non-linearity with FT. To further check the accuracy of the proposed method, the relative SNR gain was also plotted simulating a 64 QAM modulation. Figure 9 shows that the gain is always greater than 0 even with higher modu-lation index.
SNRRGð Þ ¼dB 10 log10ðSNROT=SN RFTÞ: ð10Þ
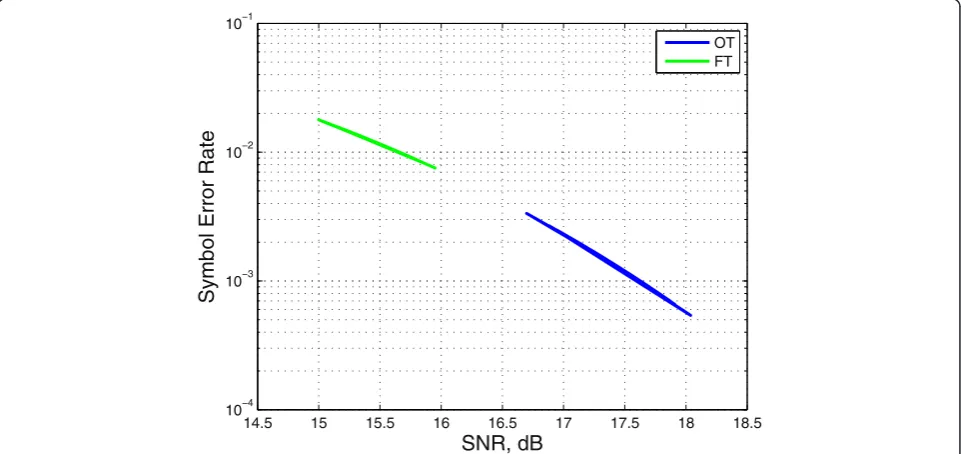
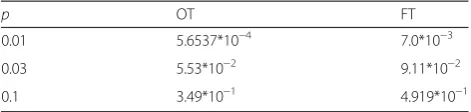
System performance of blanking nonlinearity with OT is also compared with FT in terms of symbol-error rate (SER). Figures 10, 11, and 12 show SER for p = 0.01, 0.03, and 0.1, respectively. Table 1 shows that the mini-mum SER achieved by OT is always lower than that achieved by the FT method in all IN scenarios. The SER of the system is given in Eq. 11 as in [6] as follows:
Wheremis modulation index andQisQfunction.
4 Conclusions
The optimized threshold for blanking nonlinearity for achieving higher SNR and lower SER is proposed. As the optimized threshold is determined according to the peak, mean, and median of the signal, it gives better re-sults and better system performance regardless of the probability of impulsive noise occurrence. On the other hand, a fixed threshold is independent of the signal char-acteristics. Therefore, one fixed threshold is not suitable for all the received signals with different probabilities of impulsive noise which may occur in practical scenarios.
Moreover, in this paper, the optimum range for setting
γis introduced. Changing γwithin the given range does not cause a greater change in SNR. The SNR remains higher than that achieved by setting a fixed threshold. Whereas, changing the conventional fixed threshold re-sults in a drastic change in SNR.
the supervision of Professor Chang Soo Park.
Received: 23 December 2014 Accepted: 18 June 2015
References
1. TH Tran, DD Do, TH Huynh, PLC impulsive noise in industrial zone: measurement and characterization. Int J Comput Electrical Eng5(1), 48–51 (2013)
2. J Lin, M Nassar, BL Evans, Impulsive noise mitigation in powerline communications using sparse Bayesian learning. IEEE Commun J31(7), 1172–1183 (2013)
3. L Lampe, Bursty impulse noise detection by compressed sensing, inIEEE International Symposium on Power Line Communications and Its Applications (ISPLC), 2011, pp. 29–34
4. M Ghosh, Analysis of the effect of impulse noise on multicarrier and single carrier QAM systems. IEEE Trans Commun44(2), 145–147 (1996) 5. SV Zhidkov, On the analysis of OFDM receiver with blanking nonlinearity in
impulsive noise channels, inProceedings of International Symposium on Intelligent Signal Processing and Communication Systems (ISPACS), 2004, pp. 492–496
6. SV Zhidkov, Performance analysis and optimization of OFDM receiver with blanking nonlinearity in impulsive noise environment. IEEE Trans Vehicular Technol55(1), 234–242 (2006)
7. U Epple, M Schnell, Adaptive threshold optimization for a blanking nonlinearity in OFDM receivers, inIEEE Global Communications Conference (GLOBECOM), 2012, pp. 3661–3666
8. E Alsusa, KM Rabie, Dynamic peak-based threshold estimation method for mitigating impulsive noise in power-line communication systems. IEEE Trans Power Deliv28(4), 2201–2208 (2013)
9. S Singhal, VV Thakare, Comparative evaluation of standard and adaptive median filter for removing different type of noises. Int J Emerg Trends Sci Technol1(07), 1227–1232 (2014)
10. T Sunilkumar, A Srinivas, ME Reddy, DGR Reddy, Removal of high density impulse noise through modified non-linear filter. J Theor Appl Inf Technol
47(2), 471–478 (2013)
Submit your manuscript to a
journal and benefi t from:
7Convenient online submission
7Rigorous peer review
7Immediate publication on acceptance
7Open access: articles freely available online
7High visibility within the fi eld
7Retaining the copyright to your article