Cavit Ceylan, MD;
*Omer Gokhan Doluoglu, MD;
†Erdogan Aglamis, MD;
§Ozkan Baytok, MD
**Department of Urology Clinic of Türkiye Yüksek Ihtisas Training and Research Hospital, Ankara, Turkey; †Ankara Training and Research Hospital, Ankara, Turkey; §Elazığ Training and Research Hospital, Urology Clinic, Elazığ, Turkey
Cite as: Can Urol Assoc J 2014;8(1-2):e81-5. http://dx.doi.org/10.5489/cuaj.510 Published online February 12, 2014.
Abstract
Introduction: In this study, we evaluate the relationship between
increasing core numbers and cancer detection rate.
Methods: We included 1120 patients with prostate-specific
anti-gen levels ≤20 ng/mL and/or suspicious digital rectal examination findings in this study. All patients had a first-time prostate biopsy and 8, 10, 12, 16, and 20 core biopsies were taken and examined in different groups during the study. Multiple logistic regression analysis was made to reach the factor affecting the cancer detec-tion rate between the patients with and without cancer. A p < 0.05 was considered statistically significant.
Results: Out of 1120 patients, 221 (19.7%) had prostate cancer.
Again of the total 1120 patients, 8 core biopsies were taken from 229 (20.4%); 10 core biopsies from 473 (42.2%); 12 core biopsies from 100 (8.9%); 16 core biopsies from 140 (12.5%); and 20 core biopsies from 178 (15.9%) patients. The increase in the core num-ber increased the cancer detection rate by 1.06 times (p = 0.008).
Conclusions: As long as prostate volume increases, increasing the
core number elevates the cancer detection rate. Thus, the rate of missed cancer will be reduced and the rates of unnecessary repeti-tive biopsy decreases.
Introduction
Transrectal ultrasound (TRUS)-guided prostate needle biopsy is the gold standard in the diagnosis of prostate cancer. Recently, the detection of localized prostate cancer has improved due to the development of various new biopsy methods.1-3 However, a standard biopsy method,
includ-ing a number of cores, has not yet been established. In 1989, Hodge and colleagues proposed TRUS-guided sex-tant prostate needle biopsy.4 Since then, the random,
sys-temic 6-core prostate biopsy has become the most popular
biopsy method and has significantly improved prostate can-cer detection. However, recent reports have indicated that systematic sextant biopsy might be inadequate for cancer detection.5 This approach is associated with a relatively high
false-negative rate of 15% to 31%.6,7 Groups at many clinics
perform extended prostate biopsy strategies consisting of 8 to 13 biopsies since this strategy has not been associated with an increase in morbidity and the number of clinically insignificant prostate cancers.1,8 In addition, Letran and
col-leagues reported that the sextant biopsy protocol was not appropriate in patients with a prostate gland volume greater than 55.6 cc.9
Several issues arise when considering what constitutes the optimal biopsy strategy for patients with suspected prostate cancer. How many biopsies should be taken to maximize cancer detection? In this study, we compared the cancer detection rates of 8, 10, 12, 16, and 20 core prostate biop-sies in patients with suspected prostate cancer and prostate-specific antigen (PSA) ≤20 ng/mL.
Methods
Between January 2003 and August 2010, we retrospec-tively reviewed the charts of 1700 patients who underwent TRUS-guided biopsy of the prostate at the Türkiye Yüksek İhtisas Training and Research Hospital and Elazığ Training and Research Hospital. We excluded patients with previ-ously known prostate cancer, PSA >20 ng/mL, suspicion of acute prostatitis and a history of cystourethroscopy or urethra catheterization within 1 month. A total of 1120 patients with a serum PSA ≤20 ng/mL and/or suspicious digital rectal examination (DRE), who received TRUS-guided biopsy for the first time, were included in the analysis. All the patients in this study were Turkish.
Prostate biopsies were taken from only 1 urologist (CC). Ten minutes before the procedure, each patient was instilled with 20 mL of 2% lidocaine jelly rectally. Patients were
placed in the left decubitus position. Biopsies were done with 18-gauge Tru-cut biopsy needles during longitudinal scanning. All patients were given fluoroquinolone for 3 days, starting on the day of biopsy. Ages, prostate volumes, PSAs, free/total PSA rates, PSA densities (PSADs), numbers of core taken, DREs, Gleason scores of all patients were recorded. The patients were divided into 2 groups as those with cancer and without cancer according to biopsy results.
TRUS prostate volume was calculated using a computer-gen-erated elliptical estimation of 0.52 × length × width × height. All procedures were performed using a diagnostic ultrasound machine with 7.5 mHz biplanar probe (EUB-420, Hitachi Medical Corp, Tokyo Japan).
In addition to classical sextant biopsy,4 biopsies were
taken laterally directed (lateral apex, lateral midgland, lateral base) (Fig. 1).
Statistical analysis
Data analysis was performed by using SPSS for Windows, version 11.5 (SPSS Inc., Chicago, IL). To determine whether the continuous variables were normally distributed, we used the Shapiro Wilk test. Homogeneity of variances was evalu-ated by the Levene test. Data were shown as mean ± stan-dard deviation or median (interquartile range) for continuous variables and number of cases and percentages for categori-cal ones.
Previously, the analyses of prostate volume were catego-rized by quartiles. The mean differences among prostate vol-ume quartiles were analyzed by one-way ANOVA following post-hoc Tukey test; the Kruskal Wallis test was applied for comparisons of the median values. When the p-values from the Kruskal Wallis test statistics were statistically significant, the Conover’s non-parametric multiple comparison test was used to determine group differences.
We used the univarite logistic regression analyses to deter-mine whether the associations between clinical
character-istics of the patients and biopsy outcomes were statistically significant. We used the multiple logistic regression analysis to determine the best predictors to discriminate benign and malignant patients. Any patient with a univariable p value of <0.25 was accepted as a candidate for the multivariable model. The odds ratio, as well as the 95% confidence inter-vals for each independent variable, was also calculated. A p value less than 0.05 was considered statistically significant.
Results
Prostate cancer was found in 221 (19.7%) of the 1120 patients. Of these total number of patients (n =1120), 8 core biopsies were taken from 229 (20.4%), 10 core biopsies from 473 (42.2%), 12 core biopsies from 100 (8.9%), 16 core
Base
Apex
Fig. 1. Biopsy core schema. Black circle: sextant biopsy schema; inverted triangle+black circle: 8 cores biopsy schema; triangle + inverted triangle+black circle: 10 cores biopsy schema; hourglass+Triangle+inverted triangle+black circle: 12 cores biopsy schema; 2 squares+hourglass+triangle+inverted triangle+black circle: 16 cores biopsy schema; 2 double-circles+2 squares+hou rglass+triangle+inverted triangle+black circle: 20 cores biopsy schema.
Table 1. Comparison of clinical characteristics of patients according to biopsy outcome
Variables Negative biopsy (n=899) Positive biopsy (n=221) p value OR (95% CI)
Age (years) 64.1 ± 7.5 67.1 ± 8.0 <0.001 1.054 (1.033–1.075)
Volume 50 (31) 40 (24) <0.001 0.981 (0.974–0.988)
Volume quartiles
12–34 (cc) 180 (20.1%) 88 (39.8%) <0.001 3.352 (2.166–5.188)
35–47 (cc) 237 (26.4%) 60 (27.1%) 0.017 1.736 (1.103–2.733)
48–66 (cc) 240 (26.8%) 38 (17.2%) 0.744 1.086 (0.663–1.777)
67–253 (cc) 240 (26.8%) 35 (15.8%) — 1.000
Total PSA (ng/mL) 6.9 (3.88) 8.6 (6.06) 0.002 1.041 (1.015–1.067)
Free PSA (ng/mL) 1.2 (0.83) 1.0 (0.86) 0.800 0.984 (0.869–1.114)
Free/total PSA (ng/mL) 0.18 (0.11) 0.15 (0.10) <0.001 0.021 (0.003–0.180)
PSA density 0.13 (0.10) 0.21 (0.20) <0.001 19.628 (7.123–54.091)
No. cores 11.8 ± 4.0 13.1 ± 4.6 <0.001 1.072 (1.036–1.108)
biopsies from 140 (12.5%), and 20 core biopsies from 178 (15.9%) patients. The mean age of patients with benign pros-tatic hyperplasia (BPH) was 64.1 ± 7.5, and the mean age of the group with cancer was 67.1 ± 8.0 (p < 0.001). While the median prostate volume in the BPH group was 50 cc (range: 12-253), the median volume in the cancer group was 40 cc (range: 14-156) (p < 0.001). While the number of cores taken in patients in whom prostate cancer was detected was 13.1 ± 4.6, it was 11.8 ± 4.0 in the BPH group (p < 0.001) (Table 1). The cancer detection rate decreased from 39% to 15% as long as prostate volume increases.
The cancer detection rates of 8, 10, 12, 16, and 20 core prostate biopsies were 18.3%, 14.8%, 24%, 22.1%, and 30.3%, respectively (Fig. 2). The highest cancer detection rate was achieved with a 20-core biopsy.
The mean prostate volumes and PSA values of the patients according to the number of core are seen in Table 2. The mean prostate volumes of the patients from whom 8, 10, 12, 16, and 20 core biopsies were found as 46.1 ± 18.8 cc, 56.6 ± 26.3 cc, 52.3 ± 29 cc, 49.4 ± 27.5 cc, and 55.1 ± 29.7 cc, respectively (p = 0.0001). A post-hoc analy-sis was done to determine the differences between groups. While the prostate volumes of the 8-core patients were lower than the 10- and 20-core patients (p < 0.0001), the mean prostate volume of the 10-core patients was higher than volume in the 16-core patients (p < 0.0001). The prostate volumes of the other groups were similar (Table 2).
The mean PSA values of the patients from whom 8, 10, 12, 16, and 20 core biopsies were taken were 8.4 ± 4.2 ng/ mL, 6.5 ± 2.3 ng/mL, 8.7 ± 4.6 ng/mL, 8.8 ± 4 ng/mL, and
9.7 ± 8.8 ng/mL, respectively (p = 0.0001). Again, a post-hoc analysis was done to determine the differences between groups. While the 10-core patients had lower PSA values compared to the 8-, 12-, 16-, and 20-core patients, the PSA values of the other groups were similar.
Hematuria was observed in 25 (10.9%), 38 (8%), 12 (12%), 17 (12.1%), 22 (12.4%) of patients from whom 8, 12, 16, and 20 core biopsy were taken, respectively (p = 0.35) Fever (over 38°) and infection were found in 2 (0.9%) in 8-core, 10 (2.1%) in 12-core, 0. 1 (0.7%) in 16-core, and 2 (1.1%) in 20-core patients (p = 0.36). Rectal bleed-ing was found in 3 (1.3%) 8-core, 7 (1.5%) 12-core, 0.1 (0.7%) 16-core, and 2 (1.1%) 20-core patients (p = 0.75). Urinary retention, epididymitis, and rectal bleeding were not observed in these patients.
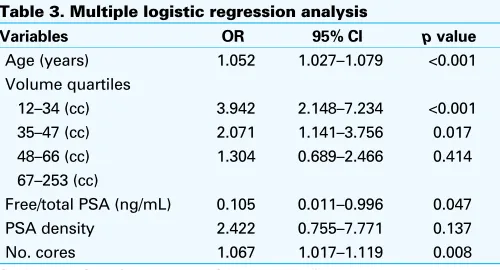
We performed a multivariate analysis to find the most valuable variable to detect the possibility of cancer positivity in positive-biopsy patients. In doing so, we found that age increases the cancer detection rate by 1.05 times, prostate volume in the first quartile (12-34 cc) by 3.9 times, and the increasing number of cores by 1.06 times (Table 3).
Discussion
The final diagnosis of prostate cancer is established by pathology. The sextant (bilateral specimen from apex, migland, and base on the sagittal plane) biopsy described first by Hodge and colleagues in 1989 misses clinically important prostate cancers by 20% to 30%.4 Various biopsy
methods in which additional biopsies were taken particu-larly from the lateral region of the prostate were developed to increase the cancer detection rate.1,10 Most researchers
take more lateral zone samples to elevate the cancer detec-tion rate.8,11 In the study by Yamamoto and colleagues, a
12-core transperineal prostate biopsy was taken from 300 patients with PSA 2.5 to 20 ng/mL and the cancer detection rate increased.12 In another study, 10, 12, and 13 core
pros-tate biopsies increased the cancer detection rate by 25%, 22%, and 35%, respectively.1,13 In the study by Guichard
and colleagues, the cancer detection rates of 6, 12, 18, and 21 core prostate biopsies were 31.7%, 38.7%, 41.5%, and 42.5%, respectively.14 In a study made on 1086 cases, a
12-core biopsy significantly increased the cancer detection rate in proportion to the 6-core biopsy.15 Eskicorapci and
colleagues found that the cancer detection rate increased by 25.5% with the addition of the lateral peripheral zone biopsies to the sextant biopsy technique.13
Prostate cancer detection rate
Fig. 2. The cancer detection rates of 8, 10, 12, 16, and 20 core prostate biopsies.
Table 2. Comparison of prostate volumes and PSA levels of patients according to the number of cores (ANOVA)
8 cores 10 cores 12 cores 16 cores 20 cores p value
Prostate volume (cc) Mean ± SD 46.1 ± 18.8 56.6 ± 26.3 52.3 ± 29 49.4 ± 27.5 55.1 ± 29.7 0.0001
PSA ng/mL Mean ± SD 8.4 ± 4.2 6.5 ± 2.3 8.7 ± 4.6 8.8 ± 4.0 9.7 ± 8.8 0.0001
When Durkan and colleagues took a 2-core biopsy from the transitional zone and a 4-core biopsy from the peripheral zone in addition to a sextant biopsy, they found that the cancer detection rate alone increased by 19% in proportion to sextant biopsy.7 The logic of these studies is based on the
increase in the possibility to detect cancer by increasing the samples. However, the situation is not always so simple. There are also many studies which show that increasing the core number does not affect the cancer detection rate. In one particular study, a 12-core extended biopsy was not superior to a sextant biopsy.16
Ung and colleagues took 6 to 18 core biopsies from 750 patients and reviewed the effect of the association of the increasing core number with prostate volume on the cancer detection rates. They showed that the cancer detection rate decreased from 40% to 27% as long as prostate volume increased; moreover, the cancer detection rate was not dif-ferent as long as the number of cores increased (p = 0.77). Authors, however, had a very wide PSA range in this study (0.3 to 67 ng/mL).17
When Scattoni and colleagues compared 12 and 18 core prostate biopsy techniques, they found that the cancer detection rates were similar (p = 0.37). In this same study, the increasing core number and the cancer detection rate increased significantly when the prostate was larger than 55 cc.18 Similarly, Jones and colleagues found that
satura-tion biopsy did not increase the cancer detecsatura-tion rate.19
Many studies show the effect of prostate volume on pros-tate cancer detection rate. Ficarra and colleagues suggest at least an 8-core biopsy if prostate volume is >30 cc.20
In a study performed in France, Guichard and colleagues divided the prostate into 3 groups: <35 cc, 35-55 cc, and >55 cc; cancer detection rates were 45%, 36%, and 28%, respectively, when a 12-core biopsy was taken. Moreover, in this study, the authors found that the prostate volume was significantly low in the positive biopsy (39.7 vs. 46.8 cc,
p < 0.01).21 Uzzo and colleagues found that the cancer
detection rate in prostates below 50 cc was significantly higher in proportion to those above 50 cc (38% vs. 23%).22
Similarly, in our study, the prostate volumes in the positive
biopsy group were significantly lower. Particularly, in the first and second quartiles, statistically significant volumes were observed (p < 0.001 and p = 0.017, respectively).
At our clinic, routine 8 cores between 2003 and 2005, routine 10 cores between 2005 and 2009, routine 12 cores between 2009 and 2012 were taken. As a result of the increase in the studies which show cancer detection of lat-eral core biopsies, there has been an increase in routine core biopsies taken. We also took 16 and 20 cores for prostate biopsy for our other study. The indications are the same in all the biopsies. No high core application was done to patients with high volume or high PSA.
According to our study, the highest cancer detection rate was achieved with a 20-core (30.3%) prostate biopsy. The reason the cancer detection rate is lower in the 10-core prostate biopsy compared to the 8-core biopsy is that the 10-core group had lower PSAs and higher prostate volumes (Table 2). The cancer detection rate increased by 3.9 times in small-volume prostates (12-34 cc). Increasing the number of cores increased cancer detection rates by 1.06 (p = 0.008).
Common complications of TRUS-guided prostate needle biopsy include hemospermia (37.4%), hematuria (14.5%), rectal bleeding (2.2%), prostatitis (1%) fever over 38° (0.8%) and urinary retention (0.2%).23 In our study, no differences
were observed among groups in terms of complications. Infection and fever requiring hospitalization were observed in 15 patients; they were successfully treated with antibiot-ics. We believe that the increase in core numbers did not cause additional morbidity.
There are limitations in our study. It was retrospective and the biopsy groups were not completely homogeneous. This may have caused bias in the results. Moreover, it was not possible to access family history due to the retrospective nature of the study. This is the first study with a large patient series in which cancer detection rates of 8, 10, 12, 16, and 20 core prostate biopsies are compared at the same time.
Conclusion
Although taking at least 8 core biopsies is recommended if the prostate gland is 30 to 40 cc, there is still no consensus on the core number required for large-volume prostates. We found that as the prostate volume increased, the core num-bers increased; therefore, these factors elevated the cancer detection rate. Thus, the rate of missed cancers and the rate of unnecessary repetitive biopsy are decreased.
Competing interests: Dr. Ceylan, Dr. Doluoglu, Dr. Aglamis and Dr. Baytok all declare no competing financial or personal interests.
This paper has been peer-reviewed.
Table 3. Multiple logistic regression analysis
Variables OR 95% CI p value
Age (years) 1.052 1.027–1.079 <0.001
Volume quartiles
12–34 (cc) 3.942 2.148–7.234 <0.001
35–47 (cc) 2.071 1.141–3.756 0.017
48–66 (cc) 1.304 0.689–2.466 0.414
67–253 (cc)
Free/total PSA (ng/mL) 0.105 0.011–0.996 0.047
PSA density 2.422 0.755–7.771 0.137
No. cores 1.067 1.017–1.119 0.008
References
1. Eskew LA, Bare RL, McCullough DL. Systematic 5 region prostate biopsy is superior to sextant method for diagnosing carcinoma of the prostate. J Urol 1997;157:199-203. http://dx.doi.org/10.1016/ S0022-5347(01)65322-9
2. Babaian RJ, Toi A, Kamoi K, et al. A comparative analysis of sextant and an extended 11-core multisite dire-cted biopsy strategy. J Urol 2000;163:152-7. http://dx.doi.org/10.1016/S0022-5347(05)67993-1 3. Emiliozzi P, Longhi S, Scarpone P, et al. The value of a single biopsy with 12 transperineal cores detecting
prostate cancer in patients with elevated prostate specific antigen. J Urol 2001;166:845-50. http:// dx.doi.org/10.1016/S0022-5347(05)65849-1
4. Hodge KK, McNeal JE, Terris MK, et al. Random systematic versus directed ultrasound guided transrectal core biopsies of the prostate. J Urol 1989;142:71-4.
5. Watanabe M, Hayashi T, Tsushima T, et al. Extensive biopsy using a combined transperineal and transrectal approach to improve prostate cancer detection. Int J Urol 2005;12:959-63. http://dx.doi. org/10.1111/j.1442-2042.2005.01186.x
6. Singh H, Canto EI, Shariat SF, et al. Improved detection of clinically significant, curable prostate can-cer with systematic 12-core biopsy. J Urol 2004;171:1089-92. http://dx.doi.org/10.1097/01. ju.0000112763.74119.d4
7. Durkan GC, Sheikh N, Johnson P, et al. Improving prostate cancer detection with an extended core transrectal ultrasonography-guided prostate biopsy protocol. BJU Int 2002;89:33-9. http://dx.doi. org/10.1046/j.1464-410X.2002.02555.x
8. Presti JC Jr, Chang JJ, Bhargava V, et al. The optimal systematic prostate biopsy scheme should include 8 rather than 6 biopsies: Results of a prospective clinical trial. J Urol 2000;163:163-7. http://dx.doi. org/10.1016/S0022-5347(05)67995-5
9. Letran JL, Meyer GE, Loberiza FR, et al. The effect of prostate gland volume on the yield of needle biopsy. J Urol 1998;160:1718-21. http://dx.doi.org/10.1016/S0022-5347(01)62392-9
10. Terris MK, Wallen EM, Stamey TA. Comparison of mid-lobe versus lateral systematic sextant biopsies in the detection of prostate cancer. Urol Int 1997;59:239-42. http://dx.doi.org/10.1159/000283071 11. Matlaga BR, Eskew LA, McCullough DL. Prostate biopsy: Indications and technique. J Urol 2003;169:12-9.
http://dx.doi.org/10.1016/S0022-5347(05)64024-4
12. Yamamoto S, Kin U, Nakamura K, et al. Transperineal ultrasound-guided 12-core systematic biopsy of the prostate for patients with a prostate-specific antigen level of 2.5-20ng/ml in Japan. Int J Clin Oncol 2005;10:117-21. http://dx.doi.org/10.1007/s10147-004-0464-7
13. Eskicorapci SY, Baydar DE, Akbal C, et al. An extended 10-core transrectal ultrasonography-guided prostate biopsy protocol improves the detection of prostate cancer. Eur Urol 2004;45:444-8. http://dx.doi. org/10.1016/j.eururo.2003.11.024
14. Scattoni V. Systematic prostate biopsies are more and more often becoming saturation biopsies. Eur Urol 2006;50:202-4. http://dx.doi.org/10.1016/j.eururo.2006.01.040
15. Chiang IN, Chang SJ, Pu YS, et al. Comparison of 6- and 12-core prostate biopsy in Taiwanese men: Impact of total prostate-specific antigen, prostate-specific antigen density and prostate volume on prostate cancer detection. Urol Int 2009;82:270-5. http://dx.doi.org/10.1159/000209356
16. Naughton CK, Miller DC, Mager DE, et al. A prospective randomized trial comparing 6 versus 12 prostate biopsy cores. Impact on cancer detection. J Urol 2000;164:388-92. http://dx.doi.org/10.1016/ S0022-5347(05)67367-3
17. Ung JO, San Francisco IF, Regan MM, et al. The relationship of prostate gland volume to extended needle biopsy on prostate cancer detection. J Urol 2003;169:130-5. http://dx.doi.org/10.1016/ S0022-5347(05)64052-9
18. Scattoni V, Roscigno M, Raber M, et al. Initial extended transrectal prostate biopsy-are more prostate can-cers detected with 18 cores than 12 cores? J Urol 2008;179:1327-31. http://dx.doi.org/10.1016/j. juro.2007.11.052
19. Jones JS, Patel A, Schoenfield L, et al. Saturation technique does not improve cancer detection as an initial prostate biopsy strategy. J Urol 2006;175:485-8. http://dx.doi.org/10.1016/S0022-5347(05)00211-9
20. Ficarra V, Novella G, Novara G. The potential impact of prostate volume in the planning of optimal number of cores in the systematic transperineal prostate biopsy. Eur Urol 2005;48:932-7. http://dx.doi. org/10.1016/j.eururo.2005.08.008
21. Guichard G, Larre S, Gallina A. Extended 21-sample needle biopsy protocol for diagnosis of prostate cancer in 1,000 consecutive patients. Eur Urol 2007;52:430-5. http://dx.doi.org/10.1016/j.euru-ro.2007.02.062
22. Uzzo RG, Wei JT, Waldbaum RS, et al. The influence of prostate size on cancer detection. Urology 1995;46:831-6. http://dx.doi.org/10.1016/S0090-4295(99)80353-7
23. Acar C, Eskicorapci S, Bolat D. Prostate biopsy review [in Turkish]. Endoüroloji Bülteni 2010;12:16-9.