In silico analysis of histone H3 gene expression
during human brain development
MEGAN REN and STEVE VAN NOCKER*
Program in Cell and Molecular Biology, Michigan State University, MI, USA
ABSTRACT Precise regulation of chromatin structure is essential for proper development of higher eukaryotes, and methylation of histone H3 at lysine-27 (H3K27) by the Polycomb Repressive Com-plex 2 (PRC2) component EZH2 has emerged as an important and conserved mechanism to ensure silencing of developmentally regulated genes. Recurrent mutations within the histone H3 genes H3F3A and HIST1H3B that convert K27 to methionine (H3K27M) and disrupt the global H3K27 methylation landscape and PRC2-dependent silencing, have recently been identified in pediatric high-grade gliomas including Diffuse Intrinsic Pontine Glioma (DIPG) and Glioblastoma multiforme (GBM; Type IV glioma). These findings have generated renewed interest in the dynamics of histone genes and their expression, which have been difficult to study due to redundancy and high sequence homology within the H3 gene family. In this in silico study, we re-evaluated genomic organization of the human H3 gene family and expression of these genes in the human brain, utilizing public RNA-based sequence datasets for the human genome and brain development. We identified tran-scriptional activity from at least 17 protein-encoding H3 genes in the developing brain, comprising at least 14 canonical (H3.1)-like and 3 ‘replication-independent’ (H3.3)-like forms, and encoding six distinct H3 isoforms. Transcripts for H3.3 genes including H3F3A show gradual decrease in abundance associated with developmental progression, whereas H3.1 transcripts including HIST1H3B tend to be strongly downregulated at an early prenatal stage and remain essentially silent thereafter. Twelve genes, including members of both H3.1 and H3.3 classes, contain a K27-AAG codon that is mutable to that for M (ATG), whereas the remaining contain the alternative, AAA codon for K at this position. H3F3A is the only H3.3-like gene containing the K27-AAG codon, whereas HIST1H3B is among ten H3.1-like genes containing this codon. This data indicates that, in the early developing human brain, HIST1H3B constitutes the largest proportion of H3.1 transcripts among H3.1 isoforms. We suggest that the apparent overrepresentation of K27M mutations in H3F3A relative to other H3 isoforms may result from its uniqueness among H3.3s for the K27-AAG codon and the functional relationship between H3.3 and PRC2, whereas overrepresentation of K27M mutations in HIST1H3B may be a product of strong relative expression of this gene in the early developing brain.
KEY WORDS:
histone H3, H3 variant, brain development, glioma, DIPG
Various types of cancers are collectively among the leading causes of non-accidental death in children (Heron, 2013), and cancers of the brain and central nervous system are highly represented among these (Ward et al., 2014). The majority of malignant brain tumors are classified as gliomas, originating from the glial cells of the nervous system that provide support and insulation for neurons (Ward et al., 2014). Diffuse Intrinsic Pontine Glioma (DIPG) is a rare form of brain cancer that occurs predominantly in children (Grimm and Chamberlain, 2013). Tumors arise in the pons, a part of the
www.intjdevbiol.com
*Address correspondence to: Steve van Nocker. 390 PSS Building, 1066 Bogue St., East Lansing, MI, USA 48824-1325. Tel: +1-517-775-5218. Fax: +1-517-355-0249.
E-mail: [email protected]
Supplementary Material (two figures and 3 tables) for this paper is available at: http://dx.doi.org/10.1387/ijdb.150334sv
Accepted: 3 May 2016.
ISSN: Online 1696-3547, Print 0214-6282 © 2016 UPV/EHU Press
Printed in Spain
Abbreviations used in this paper: DIPG, diffuse intrinsic pontine glioma; FPKM, frag-ments per kilobase of transcript per million mapped reads; GBM, glioblastoma multiforme; NB-PG, non-brainstem pediatric glioblastoma; PRC2, polycomb repressive complex 2.
diagnosis is 6-7 years, and survival is typically less than one year (Grimm and Chamberlain, 2013). Glioblastoma multiforme (GBM; also called glioblastoma or grade IV glioma) is another, highly ag-gressive and generally inoperable brain cancer. Glioblastoma is the most common primary malignant brain tumor in humans, and although less common in children than adults, pediatric cases have a similar low median survival of less than two years (Omuro and DeAngelis, 2013).
Recent advances in DNA sequencing technologies allow re-searchers to identify genetic mutations within cancerous tissues that could contribute to pathology and often define molecular subgroups of cancers (Meldrum et al., 2011). In a large-scale sequencing study of pediatric DIPG and non-brainstem pediatric glioblastomas (NB-PG), it was found that the majority of DIPG cases analyzed and a substantial fraction of NB-PG exhibited single-nucleotide mutations in either of two genes, H3F3A and HIST1H3B, encoding histone H3 proteins (Wu et al., 2012), that would convert Lysine-27 of the protein to methionine (K27M). Similarly, an independent exome sequencing study of GBM samples identified K27M in H3F3A as a common recurrent mutation (Schwartzentruber et al., 2012). These findings were intriguing, because H3 function is influenced by posttranslational modification, and the K27 site is subject to both acetylation and methylation. A protein called Polycomb Re-pressive Complex 2 (PRC2) catalyzes trimethylation of H3K27 in a mechanism that has a key role in silencing pluripotency genes and developmental regulatory genes during cell differentiation (Margueron and Reinberg, 2011). In vitro, H3K27M can act as a dominant inhibitor of PRC2, by binding strongly to the active site of the catalytic methyltransferase subunit of PRC2, EZH2 (Lewis et al., 2013). This interaction is due to the favorable steric
interac-tion between the hydrophobic methyl group side chain of M and the relatively hydrophobic EZH2 active site (Lewis et al., 2013). This gain-of-function replacement results in diminished H3K27me3 throughout the genome, potentially leading to abnormal expression of genes that contribute to cell proliferation (Bender et al., 2013; Chan et al., 2013).
Interestingly, targeted sequencing of a large number of GBM samples representing various patient ages found H3F3A K27M mutations prevalently in pediatric cases, and H3F3A mutations were also found to be significantly biased to pediatric, as op-posed to adult, cases of anaplastic astrocytoma, a type of glioma originating from astrocytes (Schwartzentruber et al., 2012). These observations, together with the fact that DIPG typically presents during early childhood, are in accordance with etiology disrupting the important developmental functions of H3K27 and PRC2.
Although numerous studies are now underway to better char-acterize the specific contribution of H3K27M to the pathology of these cancers, an unresolved question is why H3K27M mutations have been found only in a subset of the large histone H3 gene family. The organization and expression of the human histone gene families including H3 have been incompletely characterized, due in part to redundancy and high sequence homology among H3 members (Marzluff et al., 2002). However, several histone H3 genes in addition to H3F3A and HIST1H3B are known that contain a codon for K at position 27 (AAG) that is simply mutable, through a single nucleotide switch, to a codon for M (ATG; AUG in the RNA transcript) (Morgan and Shilatifard, 2013; see below) and thus are potential candidates for H3K27M. It has been suggested that differential transcriptional or post-translational regulation of these genes relative to other histone H3 isoforms my help to explain why
Gene Name Gene ID Gene description Gene location Ensembl transcript ID Transcript name Ensembl protein ID
H3F3A ENSG00000163041 H3 histone family 3A Ch 1: 226061851-226072001 forward ENST00000366815
ENST00000366813 ENST00000366814 ENST00000366816
H3F3A-001 H3F3A-002 H3F3A-003 H3F3A-004
ENSP00000355780 ENSP00000355778 ENSP00000355779 ENSP00000355781
H3F3B ENSG00000132475 H3 histone family 3B Ch 17: 75776434-75785893 reverse ENST00000254810
ENST00000586607 ENST00000589599 ENST00000586270 ENST00000587560 ENST00000587171 ENST00000592643 ENST00000591890
H3F3B-001 H3F3B-003 H3F3B-005 H3F3B-006 H3F3B-007 H3F3B-009 H3F3B-010 H3F3B-011
ENSP00000254810 ENSP00000466020 ENSP00000465813 ENSP00000465403 ENSP00000468714 ENSP00000468484 ENSP00000467165 ENSP00000466663
H3F3C ENSG00000188375 H3 histone family 3C Ch 12: 31791185-31792241 reverse ENST00000340398 H3F3C-001 ENSP00000339835
HIST1H3A ENSG00000275714 histone cluster 1 H3a Ch 6: 26020490-26020900 forward ENST00000613854 HIST1H3A-001 ENSP00000480826
HIST1H3B ENSG00000274267 histone cluster 1 H3b Ch 6: 26031650-26032060 reverse ENST00000621411 HIST1H3B-001 ENSP00000484841
HIST1H3C ENSG00000278272 histone cluster 1 H3c Ch 6: 26045411-26045821 forward ENST00000612966 HIST1H3C-001 ENSP00000484658
HIST1H3D ENSG00000197409 histone cluster 1 H3d Ch 6: 26196840-26197250 reverse ENST00000356476 HIST1H3D-001 ENSP00000366999
HIST1H3E ENSG00000274750 histone cluster 1 H3e Ch 6: 26225155-26225565 forward ENST00000614911 HIST1H3E-001 ENSP00000482271
HIST1H3F ENSG00000277775 histone cluster 1 H3f Ch 6: 26250195-26250605 reverse ENST00000618052 HIST1H3F-001 ENSP00000484095
HIST1H3G ENSG00000273983 histone cluster 1 H3g Ch 6: 26269405-26271815 reverse ENST00000614378 HIST1H3G-001 ENSP00000484638
HIST1H3H ENSG00000278828 histone cluster 1 H3h Ch 6: 27810064-27811300 forward ENST00000369163 HIST1H3H-001 ENSP00000358160
HIST1H3I ENSG00000275379 histone cluster 1 H3i Ch 6: 27871905-27872315 reverse ENST00000616365 HIST1H3I-001 ENSP00000483283
HIST1H3J ENSG00000197153 histone cluster 1 H3j Ch 6: 27890382-27893106 reverse ENST00000359303 HIST1H3J-001 ENSP00000352252
HIST2H3A ENSG00000203852 histone cluster 2 H3a Ch 1: 149852619-149854274 forward ENST00000403683 HIST2H3A-001 ENSP00000385479
HIST2H3C ENSG00000203811 histone cluster 2 H3c Ch 1: 149839538-149841193 reverse ENST00000369158 HIST2H3C-001 ENSP00000358154
HIST2H3D ENSG00000183598 histone cluster 2 H3d Ch 1: 149813271-149813681 reverse ENST00000331491 HIST2H3D-001 ENSP00000333277
HIST2H3PS2 ENSG00000203818 histone cluster 2 H3 pseudogene 2 Ch 1: 143905555-143905966 reverse ENST00000392948 HIST2H3PS2-001 ENSP00000476960
HIST3H3 ENSG00000168148 histone cluster 3 H3 Ch 1: 228424845-228425325 reverse ENST00000366696 HIST3H3-001 ENSP00000355657
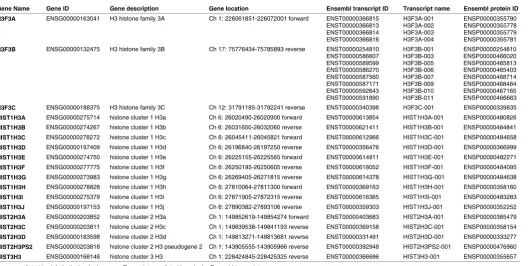
TABLE 1
PROTEIN-ENCODING H3 GENES IN THE HUMAN GENOME
these are selectively targeted for mutation in the cells of origin for DIPG and NB-PG (Wu et al., 2012), but the lack of relevant tran-scriptional information has made this difficult to address.
Direct sequencing of RNA (RNA-seq) offers the ability to study expression of individual members of closely related gene families that are not easily resolved through microarray or in situ hybrid-ization. In this study, we re-evaluated genomic organization of the H3 family using a recent annotation of human genome sequence, and exploited the exhaustive RNA-seq transcriptional data for the human brain cataloged in an online database, BrainSpan (Brain-Span, 2011), to provide a sketch of H3 expression in the context of human brain development.
Results
Census and genomic organization of human histone H3 genes
The strong sequence homology among H3 genes and transcripts, and inability to precisely distinguish isoforms, has often led to confu-sion with regards to the number and identities of active human H3 genes. Here, we initially recognized previously cataloged H3 genes in the human genome, via a sequence homology-based search of transcripts and putative open reading frame products, and using the Ensembl human genome database (e!Ensembl; http://useast. ensembl.org/Homo_sapiens/Info/Index) and representative H3F3A transcript and protein sequences as queries (see Materials and Methods). This identified a total of 57, transcriptionally active genes (Supplementary Table S1). Only 17 or 18 of these would produce transcripts with open reading frames encoding H3-like protein sequence, whereas the remainder would generate processed but noncoding transcripts. Two genes, HIST2H3A and HIST2H3C, would produce transcripts with identical sequence across the entire transcript, thus this data cannot determine if both are active. Two additional genes, HIST2H3PS2 and HIST3H3, have previously not been considered as active human H3 genes (e.g., Wu et al., 2012), but were represented by authentic H3-encoding transcripts in this database (Supplementary Table S1). Both the H3F3A and H3F3B genes would generate multiple (4 and 8, respectively) protein-encoding transcripts as a result of differential splice site usage, with all H3 isoforms invariant within the amino-terminal tail segment (not shown). H3F3C would encode a transcript closely homologous to H3F3B, differing within the open reading frame only by a 3-nucleotide deletion and an additional 11 single-nucleotide differences within the 411-nucleotide open reading frame. Unlike H3F3A and H3F3B, H3F3C has no intron (not shown).
Thus, taken together, our results indicate that the human genome contains a total of 18 potential H3-encoding genes (Table 1). As previously recognized, most H3 genes are present in two clusters on Chromosome 6 (10 genes: HIST1H3A-HIST1H3J) or Chromo-some 1 (3 genes: HIST2H3A, HIST2H3C, and HIST2H3D) (Marzluff et al., 2002) (Table 1). HIST2H3PS2 is located on chromosome 1, separated by ~6 mb from the HIST2A/C/D cluster. HIST3H3 is
also located on chromosome 1 but in a distinct position from the HIST2 cluster (Table 1). An additional H3-related gene, CENPA, encodes the centromeric H3 variant CENP-A. Because CENP-A shows only relatively low protein sequence identity to the remaining H3s (e.g., ~51% to H3F3A), has a specialized, centromere-specific
function (Müller and Almouzni, 2014), and does not encode for K at a position homologous to that of H3K27 (not shown), this gene was not analyzed further in this study.
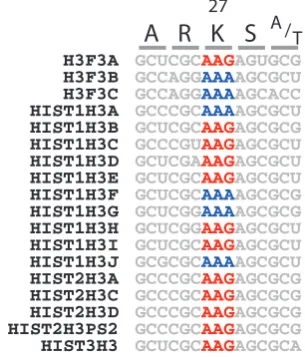
Collectively, these genes would encode six distinct, full-length isoforms. Although there is evidence for functional distinction among all six, and three classes (H3.1, H3.2 and H3.3) are often distinguished based on amino acid sequence (Szenske et al., 2011), in the present study these were more broadly generalized as canonical (H3.1-like), or variant (replication independent; H3.3), based on amino acid sequence variation within four key positions (Malik and Henikoff 2003) and the presence or absence of a 26-nucleotide regulatory sequence in the 3’ untranslated region of the transcript (Marzluff et al., 2008). According to this classifica-tion, H3F3A/B/C encode H3.3 proteins and the remainder encode H3.1 proteins (Supplementary Fig. S1, Table S2). All six isoforms contain K at position 27 (Fig. 1 and Supplementary Fig. S1). K is encoded degenerately by two codons, AAA and AAG, both used with similar frequency in human genes (Codon Usage Database, http://www.kazusa.or.jp). Only the AAG codon is simply mutable in DNA to the codon for M, ATG, via a single nucleotide switch. Includ-ing H3F3A and HIST1H3B, twelve genes utilize the AAG codon at position 27, whereas 6 genes utilize the AAA codon. There was no association between H3 type and codon usage, as H3.1 and H3.3 isoforms utilized both AAA and AAG (Fig. 1).
Expression of human histone H3 genes in the brain
To estimate expression of human histone H3 genes during brain development, we exploited BrainSpan, an online resource that catalogs gene expression data representing various brain structures through a range of development (BrainSpan, 2011). The 524 RNA-seq transcriptional data sets included in BrainSpan originated from samples from 42 donors, comprising up to 31 developmental ages ranging from 8 postconception weeks (pcw) to 40 years, and 26 brain structures (Supplementary Table S3). We utilized the ubiquitin gene UBB, elongation factor gene EEF1A1, and beta-tubulin gene TUBB4B as reference ‘constitutively expressed’ genes.
In contrast to the H3.3s, the H3.1 transcripts lack polyadenylation and are likely to be underrepresented in poly(A)-derived cDNA libraries and RNA-seq datasets including those considered here. Thus, these analyses recognize that H3.1 genes are likely to be
HIST1H3F GCUCGCAAAAGCGCG
HIST1H3H GCUCGGAAGAGCGCU
HIST1H3C GCCCGUAAGAGCGCU
HIST1H3E GCUCGCAAGAGCGCU
HIST1H3B GCUCGCAAGAGCGCG
HIST1H3I GCUCGCAAGAGCGCU
HIST1H3D GCUCGAAAGAGCGCU
HIST1H3G GCUCGGAAAAGCGCG
HIST1H3A GCCCGCAAAAGCGCU
HIST2H3A GCCCGCAAGAGCGCG
HIST2H3C GCCCGCAAGAGCGCG
HIST2H3D GCCCGCAAGAGCGCG
HIST2H3PS2 GCCCGCAAGAGCGCG
HIST3H3 GCUCGCAAGAGCGCA
HIST1H3J GCGCGCAAAAGCGCU
H3F3B GCCAGGAAAAGCGCU
H3F3C GCCAGGAAAAGCACC
H3F3A GCUCGCAAGAGUGCG
A
R K S
A /T27
more highly and broadly expressed than calculated here, and that H3.3 transcript levels cannot be directly compared with those for H3.1 as reference for gene activity. Perhaps not surprisingly, the three H3.3 genes H3F3A, H3F3B, and H3F3C were generally more strongly represented in the BrainSpan atlas and were identified in all samples. Nevertheless, we found that the full complement of H3.1 genes identified above were also widely represented in the BrainSpan atlas, with expression of each of the genes detected in multiple samples. Six H3.1 genes, HIST1H3A, HIST1H3D, HIST1H3E, HIST1H3J, HIST1H3H, and HIST2H3PS2, were identi-fied in the majority of samples. The most rarely represented was HIST2H3A/C, which was detected in only 6 samples (not shown).
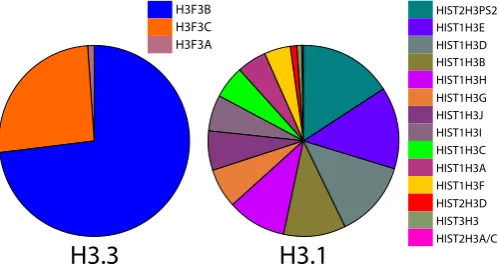
When analyzed collectively (irrespective of brain structure or developmental stage) by transcript representation, H3F3B and H3F3C comprised nearly all (~73 % and 26 %, respectively) of H3.3
transcripts (Fig. 2). H3F3A contributed less than 1 % of total H3.3 transcripts. The most strongly represented H3.1 was HIST2H3PS2, with ~ 16 % of total H3.1 transcripts. This and three additional
genes, HIST1H3E, HIST1H3D, and HIST1H3B, contributed over half of H3.1 transcripts (Fig. 2). The relative representation of each of the H3s did not differ markedly or significantly (Chi-squared test, p<0.05) among those 16 brain structures that were most highly represented by datasets (Supplementary Fig. S2).
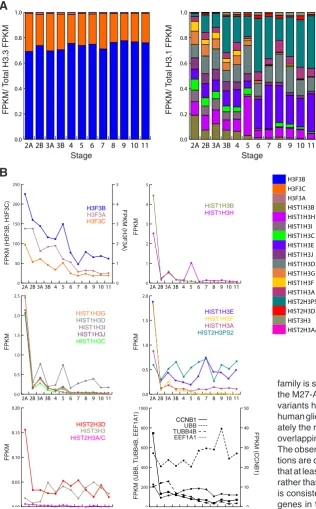
When analyzed with respect to developmental stage, irrespective of brain structure, H3F3B and H3F3C made up the vast majority (~99%) of H3.3 transcripts at all developmental stages, with H3F3B
predominating, and the relative representation of these three genes did not differ markedly or significantly (Chi-squared test, p<0.05) among developmental stages (Fig. 3A and not shown). In con-trast, H3.1 genes showed a transition from diversity of transcript composition at early stages, to dominance of only a few genes at later stages. At the earliest stage [Stage 2A (early prenatal A, 8-9 pcw)], nine H3.1 genes each contributed 7.5 % or greater of H3.1 transcripts, whereas at the latest stage [Stage 11 (adulthood, 20-60+ years], only three genes showed this degree of representation. HIST2H3PS2 and HIST1H3E together represented greater than half of H3.1 transcripts at the latest three stages [Stage 9 (late childhood, 6-11 years), Stage 10 (adolescence, 12-19 yrs) and Stage 11]. The increase in proportional representation for these two genes across developmental stages was significant, as was the observed decrease for HIST1H3B (Chi-squared test, p<0.05). Four
H3.1s (HIST2H3D, HIST3H3, and HIST2H3A/C) were expressed to a maximum of only less than 5 % of total H3.1 transcripts at any developmental stage (Fig. 3A).
On an individual basis, each of the three H3.3 genes, H3F3A/B/C, showed a gradual, developmental stage-associated decrease in transcript representation, with highest transcript levels at Stage 2A and lowest levels at or after Stage 7 (late infancy, 6-18 months) (Fig. 3B). In contrast, the majority of H3.1 genes showed highest transcript representation at Stage 2A, with substantial silencing by Stage 2B (early prenatal B, 10-12 pcw) and thereafter. This pattern resembled that of the cyclin gene CCNB1 (Fig. 3B), and potentially reflects the high mitotic activity and role for H3.1 in nucleosome biogenesis at the earliest developmental stage. In this respect, this data is consistent with a previous report that H3.1 genes, but not H3.3 genes, are essentially silent beyond the fetal stages (Frank et al., 2003). However, we noted exceptions to this pattern for HIST2H3PS2 and HIST3H3, neither of which showed clear development-associated transcript changes. For each of the eight brain structures that were represented by over 24 data sets and also sampled in Stage 2A, transcript abundance patterns across developmental stages were similar to those shown in Fig. 3B (not shown).
Discussion
New methods for exhaustive transcriptional profiling by sequenc-ing have enabled high-resolution analysis of expression of individual genes within large and closely homologous gene families. Several previous studies have characterized transcriptional activity in the developing human brain through microarray hybridization or in situ analysis, and/or have targeted specific sets of brain structures (Colantuoni et al., 2011; Kang et al., 2011; Lambert et al., 2011; Miller et al., 2014; Johnson et al., 2009; Fietz et al., 2012). The recent availability of RNA-seq data for the human brain, and the identification of H3K27M mutations in pediatric brain cancers, prompted us to carry out a census of transcriptionally active H3 genes in the human brain and analyses of their expression during brain development.
The BrainSpan database catalogs three H3.3-like genes, and up to 15 H3.1-like genes active in the brain. The human H3.3 class has typically been considered to comprise only two genes, H3F3A and H3F3B, and a previous study of H3 expression during human development analyzed only these genes as H3.3 (Frank et al., 2003). This data suggests that H3F3A is expressed relatively weakly in brain tissues. This is surprising given the annotation of multiple splice variants for the H3F3A transcripts (Table 1). The H3F3C gene, unlike H3F3A and H3F3B, does not contain introns, but is nevertheless classified here as H3.3-like based on amino acid conservation at key positions, very close sequence homol-ogy with H3F3B, and clear absence of a characteristic H3.1-like 3’ sequence important for regulation of expression. Expression of H3F3C may have escaped previous consideration due to the inability to distinguish between H3F3C and H3F3B transcripts via RNA gel blotting or RT-PCR. Nevertheless, the RNA-seq data within BrainSpan suggests that the H3F3C gene contributes a substantial fraction of H3.3 expression in brain tissues. Two H3.1-like genes, HIST2H3PS2 and HIST3H3, are annotated as, or often considered to be pseudogenes. Neither gene is expressed strongly in the presumptive proliferative tissues of early development, as was H3F3B
seen for other H3.1-like genes, and this lack of typical histone H3.1 expression may have contributed to their classification as pseudo-gene. However, both genes are expressed to appreciable levels within the presumptive differentiated tissues that predominate later developmental stages, and for HIST2H3PS2, this lack of silenc-ing contributes to its strong proportional representation for H3.1 transcription, when analyzed in collective samples irrespective of developmental stage. Based on their classification as pseudogene, HIST2H3PS2 and HIST3H3 may not have been fully considered as candidates in previous cancer screens. However, both harbor the K27-AAG codon, and mutations within these two genes may be identified in those cancer cases where no other obvious candidates
have been found. Incidentally, the NCBI dbSNP database (http://www.ncbi.nlm.nih.gov/SNP/) catalogs several germline polymorphisms within the open reading frames of both of these genes, but none of these polymorphisms affect the K27 codon (not shown). Consistent with the previous study of Frank et al.,2003), our study suggests human H3 genes are differentially expressed dur-ing brain development, with most H3.1-like genes substantially silenced at early stages while H3.3-like gene expression persists. Given the linkage between H3.1 expression and DNA replication, this most likely reflects the predominance of cell proliferation at initial stages and requirement for nucleosome biogenesis, although H3.1 exchange into nucleosomes may also be important in the extensive chromatin remodeling expected to accompany early development. Further insight could be provided by mapping the genome-wide occupancy of various H3 isoforms throughout brain development.
We show that most of the human H3 gene 0.0
Fig. 3. Development-associated H3 transcript accu-mulation.(A) Stacked bar graph showing proportional representation for 12 developmental stages, 2A-11. The FPKM value for each gene in proportion to combined H3.3 or H3.1 transcript FPKM is shown on the Y axis. Color codes are shown below. Stages are as defined in Methods and Supplementary Table S2. (B) Line graphs showing collective FPKM for each H3 gene at each developmental stage. Genes are grouped variously according to maximum FPKM. Color codes are as for (A). The lower right panel shows FPKM values for the reference genes CCNB1, UBB, TUBB4B, and EEF1A1.
family is subject to a simple A>T transversion that would create the M27-ATG codon. Thus, it is unclear why recurrent H3K27M variants have been identified for only H3F3A and HIST1H3B in human gliomas. Intuitively, those H3 isoforms that are proportion-ately the most highly expressed in a temporal or spatial pattern overlapping tumor initiation would be the most likely candidates. The observations that H3F3AK27M and HIST1H3BK27M muta-tions are common in DIPG, which presents at a young age, and that at least H3F3AK27M mutations are associated with pediatric rather than adult cases of GBM (Schwartzentruber et al., 2012), is consistent with the relatively strong early expression of both genes in the structures analyzed. We considered that the as-sociation between H3F3AK27M/HIST1H3BK27M mutations and brainstem gliomas, as opposed to non-brainstem gliomas (Wu et al., 2012; Reyes-Botero et al., 2014) might be explained by strong relative expression of these in the brainstem, as opposed to other brain structures. This remains a critical question because the datasets analyzed here focus on structures of the forebrain, which are developmentally distinguished from those comprising the brainstem early in embryogenesis. Nevertheless, we could not identify any significant localized expression of any of the H3.3-like or H3.1-like genes among the many additional brain structures that were represented in these data sets.
H3F3A is the only H3.3-like gene with the K27-AAG codon. The apparent prevalence of K27M mutations of this gene,
tive to the H3.1, HIST1H3B (Wu et al., 2012), could be explained by the enrichment for H3.3 within active euchromatin (Ahmad and Henikoff, 2002), where PRC2 targets developmentally relevant genes for silencing. In contrast, besides HIST1H3B, an additional ten H3.1-like genes harbor the K27-AAG codon. HIST1H3B does indeed appear to be expressed strongly in the brain structures analyzed, especially at early stages of development, and this may explain the overrepresentation of the H3K27M mutation in this gene. Nevertheless, additional K27-AAG H3.1 genes are expressed to moderate levels. Potentially, HIST1H3B protein accumulates to relatively high levels, or this gene exhibits cell type specific expres-sion, in glial cells or their progenitors. An alternative possibility is that HIST1H3B becomes ectopically expressed in tumor cells and contributes to pathogenesis as a secondary mutation. This is not unlikely given the proliferative nature of tumors.
Our study does not rule out functional specificity of the H3F3A and HIST1H3B isoforms, among H3.3s or H3.1s, respectively. Notably, recurrent mutations in H3F3A converting Glycine (G)-34 to arginine (R) or valine (V) were also identified in multiple cases of GBM/NB-PG (Schwartzentruber et al., 2012; Wu et al., 2012). These contribute to cancer progression in pathway(s) distinct from disruption of H3K27 methylation and PRC2 function (Bjerke et al., 2013). Unlike H3F3AK27M and HIST1H3BK27M, which are associated with the brainstem and thalamus, the H3F3AG34R/V mutations were preferential to cases affecting brain structures outside of the brainstem (Sturm et al., 2012), and did not show the striking association with pediatric cases seen for H3F3AK27M (Schwartzentruber et al., 2012). The observed absence of homolo-gous G34R/V mutations in other H3s, including H3F3B (Wu et al., 2012) can is not simply explained by expression pattern or codon usage, because H3F3B seems to be strongly expressed, G34 is conserved among all human H3s (Supplementary Fig. S1), and all codons for G are simply mutable to either R or V. Rather, this suggests that H3F3A has a unique role among H3s in the path-way affected in these cases. Functional specificity for H3F3A and HIST1H3B is also arguably supported by the absence of observed mutation in other H3s converting K27-AAA to I-ATA, as engineered H3K27I protein uniquely replicates the dominant negative effect of H3K27M on global genomic H3K27 methylation, at least in cultured cells (Lewis et al., 2012). An alternative explanation is that the relatively rare usage of the ATA codon may limit production of an inhibitory H3K27I protein (only 17% of Ile codons; Codon Usage Database, http://www.kazusa.or.jp).
The in silico analysis reported here is one example of innu-merable studies that could be carried out exploiting the current, petabyte-scale databanks of public sequence information. The efficacy of such an approach is strongly dependent on data quality and annotation, and is most appropriately used to guide more ad-vanced studies. Our study suggests a rationale for finer-resolution, RNA-based sequencing of development brain tissues, including tissues of the brain stem, to fully resolve expression of individual H3 isoforms, such as now possible with single-cell RNA-seq methods (Wu et al., 2014).
Materials and Methods
Genome Reference Consortium (GRC) assembly GRCh38 and Ensembl release 78 (December 2014) (Flicek et al., 2014) were used to identify known human H3 transcripts and proteins. Gene names and descriptions followed GRC and HUGO Gene Nomenclature (HGNC) designations. Sequence
homology analyses used the programs BLASTN and BLASTP and the e!Ensembl BLAST/BLAT server (http://useast.ensembl.org/Homo_sapiens/ Tools/Blast?db=core), with the H3F3A transcript ENST00000366815 cod-ing sequence and protein sequence (NCBI Consensus CSD protein set CCDS1550.1) as queries. Transcript/BLASTN using the E (Expect) value cutoff of 1E-12 identified a total of 68 transcripts originating from 57 genes (Supplementary Table S1). Protein/BLASTP identified 29 protein sequences, representing 19 genes, with at least 50% sequence identity with H3F3A over at least 70 amino acids of the 135-amino acid protein. Transcribed open reading frame sequences and open reading frame translations were retrieved from the Ensembl databases and aligned using ClustalX (Larkin et al., 2007; www.clustal.org).
BrainSpan data was accessed at http://brainspan.org/ in July 2015. Developmental transcriptome data was based on the October 2014 release, and details regarding RNA-seq methods are available in the BrainSpan Technical White Paper (release October 2013 v.5). Measurements used in this study are based on RNA-Seq Gencode v10, fragments per kilobase of transcript per million mapped reads (FPKM), normalized to genes. Data comprised 524 reference sets, representing samples from donors at 8 pcw to 40 years. Sample data was categorized into stages by developmental period as specified in the Brainspan Technical White Paper as follows: Stage 2A (early prenatal A), 8-9 pcw; 2B (early prenatal B), 10-12 pcw; 3A (early mid-prenatal A), 13-15 pcw; 3B (early mid-prenatal B), 16-18 pcw; 4 (late mid-prenatal), 19-24 pcw; 5 (late prenatal), 25-38 pcw; 6 (early infancy), birth-5 months; 7 (late infancy), 6-18 months; 8 (early childhood), 19 months-5 yrs; 9 (late childhood), 6-11 years; 10 (adolescence), 12-19 yrs; 11 (adulthood), 20-60+ years. Changes in proportional representation for transcripts across developmental stages and brain structures were analyzed using the Chi-squared test on FPKM values, with significance defined as p<0.05.
Ensembl designations for reference genes were as follows: UBB, ENSG00000170315; EEF1A1, ENSG00000156508; TUBB4B, ENSG00000188229; CCNB1, ENSG00000134057.
Acknowledgements
This study was supported a grant from the National Science Foundation (NSF), DBI-IOS 0922447. We thank Dr. Will Kopachik, MSU Department of Zoology, for assistance in understanding aspects of brain structure and development and for providing helpful comments.
References
AHMAD K, HENIKOFF S (2002). The histone variant H3.3 marks active chromatin by replication-independent nucleosome assembly. Mol Cell 9: 1191-1200. BRAINSPAN: ATLAS OF THE DEVELOPING HUMAN BRAIN [Internet] (2011).
Web-site: ©2014 Allen Institute for Brain Science. Available from: http://brainspan.org/. BENDER S, TANG Y, LINDROTH AM, HOVESTADT V, JONES DT, KOOL M, ZAPATKA M, NORTHCOTT PA, STURM D, WANG W et al. (2013). Reduced H3K27me3 and DNA hypomethylation are major drivers of gene expression in K27M mutant pediatric high-grade gliomas. Cancer Cell 24: 660-672.
BJERKE L, MACKAY A, NANDHABALAN M, BURFORD A, JURY A, POPOV S, BAX DA, CARVALHO D, TAYLOR KR, VINCI M et al. (2013). Histone H3.3 mutations drive pediatric glioblastoma through upregulation of MYCN. Cancer Discov 3: 512-519. CHAN K-M, FANG D, GAN H, HASHIZUME R, YU C, SCHROEDER M, GUPTA N,
MUELLER S, JAMES CD, JENKINS, SARKARIA J, ZHANG Z (2013). The histone H3.3K27M mutation in pediatric glioma reprograms H3K27 methylation and gene expression. Genes Dev 27: 985-990.
COLANTUONI C, LIPSKA BK, YE T, HYDE TM, TAO R, LEEK JT, COLANTUONI EA, ELKAHLOUN AG, HERMAN MM, WEINBERGER DR, KLEINMAN JE (2011). Temporal dynamics and genetic control of transcription in the human prefrontal cortex. Nature 478: 519-523.
FLICEK P, AMODE MR, BARRELL D, BEAL K, BILLIS K, BRENT S, CARVALHO-SILVA D, CLAPHAM P, COATES G, FITZGERALD S et al. (2014). Ensembl 2014.
Nucleic Acids Res 42: D749-D755.
FRANK D, DOENECKE D, ALBIG W (2003). Differential expression of human replacement and cell cycle dependent H3 histone genes. Gene 312: 135-143. GRIMM SA, CHAMBERLAIN MC (2013). Brainstem glioma: a review. Curr Neurol
Neurosci Rep 13: 346.
HERON M (2013). Deaths: Leading causes for 2010. U.S. Department of Health and Human Services, National Vital Statistics System: National Vital Statistics Reports 62, no. 6 [Accessed 20 January 2015]. Available from: http://www.cdc.gov/nchs/ data/nvsr/nvsr62/nvsr62_06.pdf.
JOHNSON MB, KAWASAWA YI, MASON CE, KRSNIK Z, COPPOLA G, BOGDANOVIĆ D, GESCHWIND DH, MANE SM, STATE MW, SESTAN N (2009). Functional and evolutionary insights into human brain development through global transcriptome analysis. Neuron 62: 494-509.
KANG HJ, KAWASAWA YI, CHENG F, ZHU Y, XU X, LI M, SOUSA AM, PLETIKOS M, MEYER KA, SEDMAK G et al. (2011). Spatio-temporal transcriptome of the human brain. Nature 478: 483-489.
LAMBERT N, LAMBOT MA, BILHEU A, ALBERT V, ENGLERT Y, LIBERT F, NOEL JC, SOTIRIOU C, HOLLOWAY AK, POLLARD KS, DETOURS V, VANDERHAEGHEN P (2011). Genes expressed in specific areas of the human fetal cerebral cortex display distinct patterns of evolution. PLoS One 6: e17753.
LARKIN MA, BLACKSHIELDS G, BROWN NP, CHENNA R, MCGETTIGAN PA, MCWILLIAM H, VALENTIN F, WALLACE IM, WILM A, LOPEZ R, THOMPSON JD, GIBSON TJ, HIGGINS DG (2007). Clustal W and Clustal X version 2.0.
Bioinformatics 23: 2947-2948.
LEWIS PW, MÜLLER MM, KOLETSKY MS, CORDERO F, LIN S, BANASZYNSKI LA, GARCIA BA, MUIR TW, BECHER OJ, ALLIS CD (2013). Inhibition of PRC2 activity by a gain-of-function H3 mutation found in pediatric glioblastoma.
Sci-ence 340: 857-861.
MALIK HS AND HENIKOFF S (2003). Phylogenomics of the nucleosome. Nat Struct
Biol 10: 882-891.
MARGUERON R, REINBERG D (2011). The Polycomb complex PRC2 and its mark in life. Nature 469, 343-349.
MARZLUFF WF, GONGIDI P, WOODS KR, JIN JP, MALTAIS L (2002). The human and mouse replication-dependent histone genes. Genomics 80: 487-498.
MARZLUFF WF, WAGNER EJ, DURONIO RJ (2008). Metabolism and regulation of canonical histone mRNAs: life without a poly(A) tail. Nat Rev Genet 9: 843-854. MELDRUM C, DOYLE MA, TOTHILL RW (2011). Next-generation sequencing for
cancer diagnostics: a practical perspective. Clin Biochem Rev 32: 177-195. MILLER JA, DING SL, SUNKIN SM, SMITH KA, NG L, SZAFER A, EBBERT A, RILEY
ZL, ROYALL JJ, AIONA K et al. (2014). Transcriptional landscape of the prenatal human brain. Nature 508: 199-206.
MORGAN MA, SHILATIFARD A (2013). (Poly)combing the pediatric cancer genome for answers. Science 340: 823-824.
MÜLLER S, ALMOUZNI G (2014). A network of players in H3 histone variant depo-sition and maintenance at centromeres. Biochim Biophys Acta 1839: 241-250. OMURO A, DEANGELIS LM (2013). Glioblastoma and other malignant gliomas: a
clinical review. JAMA 310: 1842-1850.
REYES-BOTERO G, GIRY M, MOKHTARI K, LABUSSIÈRE M, IDBAIH A, DELAT-TRE J-Y, LAIGLE-DONADEY F, SANSON M (2014). Molecular analysis of diffuse intrinsic brainstem gliomas in adults. J Neurooncol 116: 405-411.
SCHWARTZENTRUBER J, KORSHUNOV A, LIU XY, JONES DT, PFAFF E, JACOB K, STURM D, FONTEBASSO AM, QUANG DA, TÖNJES M et al. (2012). Driver mutations in histone H3.3 and chromatin remodeling genes in paediatric glioblas-toma. Nature 482: 226-230.
STURM D, WITT H, HOVESTADT V, KHUONG-QUANG DA, JONES DT, KON-ERMANN C, PFAFF E, TÖNJES M, SILL M, BENDER S et al. (2012). Hotspot mutations in H3F3A and IDH1 define distinct epigenetic and biological subgroups of glioblastoma. Cancer Cell 22: 425-437.
SZENSKE E, RAY-GALLET D, ALMOUZNI G (2011). The double face of the histone variant H3.3. Cell Res 21: 421-434.
WARD E, DESANTIS C, ROBBINS A, KOHLER B, JEMAL A (2014). Childhood and adolescent cancer statistics, 2014. CA Cancer J Clin 64: 83-103.
WU AR, NEFF NF, KALISKY T, DALERBA P, TREUTLEIN B, ROTHENBERG ME, MBURU FM, MANTALAS GL, SIM S, CLARKE MF, QUAKE SR (2014). Quantita-tive assessment of single-cell RNA-sequencing methods. Nat Methods 11: 41-46. WU G, BRONISCER A, MCEACHRON TA, LU C, PAUGH BS, BECKSFORT J, QU C, DING L, HUETHER R, PARKER M et al. (2012). Somatic histone H3 alterations in pediatric diffuse intrinsic pontine gliomas and non-brainstem glioblastomas.
Developmental control of cortico-cerebral astrogenesis
Antonello Mallamaci
Int. J. Dev. Biol. (2013) 57: 689-706
http://www.intjdevbiol.com/web/paper/130148am
Zfyve9a regulates the proliferation of hepatic cells during zebrafish embryogenesis
Nian Liu, Zhuo Li, Duanqing Pei and Xiaodong Shu Int. J. Dev. Biol. (2013) 57: 773-778
http://www.intjdevbiol.com/web/paper/130065xs
SMYD2 is induced during cell differentiation and participates in early development
Borja Sesé, Maria J. Barrero, Maria-Carme Fabregat, Veronika Sander and Juan Carlos Izpisua Belmonte Int. J. Dev. Biol. (2013) 57: 357-364
http://www.intjdevbiol.com/web/paper/130051ji
Comparative expression analysis of the H3K27 demethylases, JMJD3 and UTX, with the H3K27 methylase, EZH2, in Xenopus
5 yr ISI Impact Factor (2013) = 2.879 Akane Kawaguchi, Haruki Ochi, Norihiro Sudou and Hajime Ogino
Int. J. Dev. Biol. (2012) 56: 295-300
http://www.intjdevbiol.com/web/paper/113360ak
DNA methylation reprogramming and DNA repair in the mouse zygote
Konstantin Lepikhov, Mark Wossidlo, Julia Arand and Jörn Walter Int. J. Dev. Biol. (2010) 54: 1565-1574
http://www.intjdevbiol.com/web/paper/103206kl
Chromatin states of developmentally-regulated genes revealed by DNA and histone methylation patterns in zebrafish embryos
Leif C. Lindeman, Cecilia L. Winata, Håvard Aanes, Sinnakaruppan Mathavan, Peter Aleström and Philippe Collas
Int. J. Dev. Biol. (2010) 54: 803-813
http://www.intjdevbiol.com/web/paper/103081ll
Interplay between DNA methylation, histone modification and chromatin remodeling in stem cells and during development
Kohta Ikegami, Jun Ohgane, Satoshi Tanaka, Shintaro Yagi, and Kunio Shiota Int. J. Dev. Biol. (2009) 53: 203-214