DETECTION SINGLE NUCLEOTIDE POLYMORPHISMS IN UROMODULIN PROMOTER
REGION ASSOCIATED WITH RENAL DISEASES USING SINGLE-STRAND CONFORMATION
POLYMORPHISM-POLYMERASE CHAIN POLYMORPHISMS TECHNIQUE
ZAHRAA ISAM
1, RABAB OMRAN
2*, AMMAD HASSAN MAHMOOD
31Department of Biology, College of Science, University of Babylon, Al-Hillah City, Babel, Iraq. 2Department of Biology, College of Science, University of Babylon, Al-Hillah City, Babel, Iraq. 3Department of Urology, College of Medicine, University of Babylon, Consultant Urologist
in Hilla Teaching Hospital, Al-Hillah City, Babel, Iraq. Email: [email protected] Received: 17 August 2017, Revised and Accepted: 10 October 2017
ABSTRACT
Objective: The uromodulin, a glycoprotein, expressed and secreted by epithelial kidney cells lining the thick ascending limb of the Henle’s loop. It is encoded by the UMOD gene in humans. Our objective was to analyze single nucleotide polymorphisms (SNPs) in the UMOD promoter region in patients with chronic kidney disease (CKD) and end-stage renal disease (ESRD).
Results: UOMD promoter region polymorphisms using PCR-SSCP and sequencing DNA appeared three different conformational haplotypes, including A\G 49 haplotype (5 bands), A\G 49 and C\A 247 haplotype (5 bands), and C\G 45 and A\G 49 haplotype (6 bands) distributed among CKD and ESRD cases, due to the presence of three SNPs. There was no association between band numbers of PCR-SSCP with ESRD and CKD compared with a control group.
Conclusion: SSCP-PCR is a good screening method to detect genetic variations in an uromodulin promoter region.
Keywords: Chronic kidney disease, End-stage renal disease, UMOD-promoter region, SNPs, Single-strand conformation polymorphism-polymerase chain polymorphisms.
INTRODUCTION Inspite of over 50 years of uromodulin analysis that focuses on its
physiological roles has remained elusive, causing a gradual decline of the research. Recently, highlighted heredity investigations that proved the importance of this protein, since the uromodulin mutations were implicated in dominant tubulointerstitial viscus ill health [2,5]. Several genome-wide association studies (GWASs) investigated a lot of UMOD
genetic risk loci (such as rs12917707, rs6497476, and rs4293393) were concerned with estimated glomerular filtration rate (eGFR) related to chronic kidney disease (CKD) or upset [6,7]. In 2009, the single-nucleotide polymorphisms (SNPs) in the UMOD gene were investigated among a big cohort of patients suffering from CKD and found that these SNPs may be implicated to the genetic standing in end-stage renal disease (ESRD) [8]. SNPs are single-nucleotide variations that have arisen randomly over time in the human genome, and it is mostly occurring in noncoding regions [7,8]. The aim of the study was to analyzes single-nucleotide polymorphism (SNP) in the promoter region of the UMOD gene in patients suffering from CKD and ESRD using polymerase chain polymorphisms-single-strand conformation polymorphism (PCR-SSCP) technique.
METHODS Sampling
This was a case study conducted in the Biotechnology and Genetic Engineering Laboratory, Department of Biology, College of Science, University of Babylon, Iraq. The blood samples (150) were collected from patients suffering from CKD (50) and ESRD (50), in addition to healthy persons (50) as a control group. Blood samples were taken from out-and in-patients who admitted to Merjan Teaching Hospital (Dialysis Center), Babylon Province, from February to July 2016. All the participants were evaluated by a certified physician, who was also © 2018 The Authors. Published by Innovare Academic Sciences Pvt Ltd. This is an open access article under the CC BY license (http://creativecommons. org/licenses/by/4. 0/) DOI: http://dx.doi.org/10.22159/ajpcr.2018.v11i1.22063
Research Article
Methods: The blood samples were collected from 100 patients with CKD (50) and ESRD (50), who admitted at Merjan Teaching Hospital in Babylon Province, Iraq (February-July 2016). In addition, 50 blood samples of healthy control. The SNPs of UMOD promoter region was investigated using single-strand conformation polymorphism-polymerase chain polymorphisms (SSCP-PCR) and DNA sequencing techniques.
responsible for getting the most analytical and clinical values such as urea and creatinine concentrations. The patients with hepatitis were excluded from the study.
Genotyping using PCR-SSCP technique
The genotyping of the studied groups were performed using the SSCP-PCR technique after DNA extraction from blood samples. DNA was extracted from blood samples and purified using extraction and purification kit (Geneaid company - UK).
The targeted sites of the UMOD promoter regions were amplified using design-specific primers (Bioneer, IDTDNA - USA). Forward: 5’-GGGGATCTTCTCCCTTGGC-3’; Reverse: 5’- CAACCCACGTCACAGGGAAG-3’.
PCR was carried out in the reaction mixture containing 1 µl from forward and reverse primers, 12.5 µl of Green Master Mix, and 3 µl of genomic DNA, and the volume of reaction was completed up to 20 µl by adding 2.5 µl of the nuclease-free water. Amplification was carried out in a TRIO Thermal Cycler (Biometra, Germany) programed for 2 min pre-denaturation at 94°C; 30 cycles, 5 min at 94°C (DNA denaturation), 1 min at 61°C (annealing), and 1min at 72°C (extended); and a final extension of 5 min. PCR products were electrophorezed using gel electrophoresis (Cleaver Scientific - UK) in 1% agarose at 75 V for 1 hand visualized by ethidium bromide. Photos were taken using gel documentation system (Cleaver Scientific - UK).
After the amplification of the target sequence, SSCP was performed using polyacrylamide gel (PAG) electrophoresis throughout the following steps:
1. The 8% PAG was prepared and poured into the medium-casting tray (20 × 20 × 0.1 cm; H × W × T). The PAG (total volume 40 ml) composed of 8 ml of 40% acrylamide/bisacrylamide, 4 ml of 10× TBE, 2.8 ml of glycerol, 40 µl of TEMED, 400 µl of 10% ammonium persulfate, and 24.8 ml of deionized water.
2. During the gel solidified, the DNA samples were prepared by mixing
10 µl of PCR products with10 µl of 2× SSCP loading dye in Eppendorf tubes separately. Then, they incubated in a water bath at 95°C for 7 min. Subsequently, the mixtures immediately were placed in an ice bath for 5 min.
3. The samples were loaded into 8% PAG and migrated using vertical
electrophoresis unite (Cleaver Scientific - UK) at 200 V, 35 mA, and 6 W
for 180 min or until SSCP tracking dye reaches the bottom of the gel. 4. 4. The gels visualized by ethidium bromide. Photos were taken using
gel documentation system (EBOXCX - UK).
Sequencing of amplified DNA fragment
The amplified fragments were purified using the protocol suggested by Macrogen sequencing company (Macrogen - Korea), and then, they were sequenced using each primer pair. The sequences of the gene fragments analyzed were aligned by multiple sequence alignment program, according to Bio-edit, with the sequences published in the Gen Bank database taken as a reference to identify the polymorphisms.
Statistical analysis
Statistical analysis was carried out using SPSS version 16, and p ≤ 0.05
was considered statistically significant.
RESULTS
The cases of the study involved 150 samples divided into three groups: Two patient groups, including chronic and ESRD (each of them containing 50 patients) and healthy control groups (50). The study included female and male as a percentage 50% for both at the age ranged between 11 and 80 years. Furthermore, the percentage of hypertension was present in 43.33%, while in non-hypertension group was 56.665%. In addition, the percentage of patients with diabetes was 10%, whereas non-diabetic patients were 90%. Finally, the percentage of smoker patients was 33.33%, whereas the nonsmoker patients was 66.66%.
The results revealed that the CKD and ESRD groups had high significant
differences (p≤0.05) of urea, creatinine, and calcium levels in
comparison with control groups. These levels significantly increased
(p≤0.05) in female and male patient group compared with control
groups.
The genomic DNA was extracted from the blood samples and electrically migrated in 1% agarose, 75 V, 20 mA for 1h, (Fig. 1). Fig. 2 showed the amplification product of the UOMD promoter region. Fig. 3 showed PAG electrophoresis of SSCP-PCR conformational haplotypes of the amplified products (317 bp) of promoter region of UOMD gene.
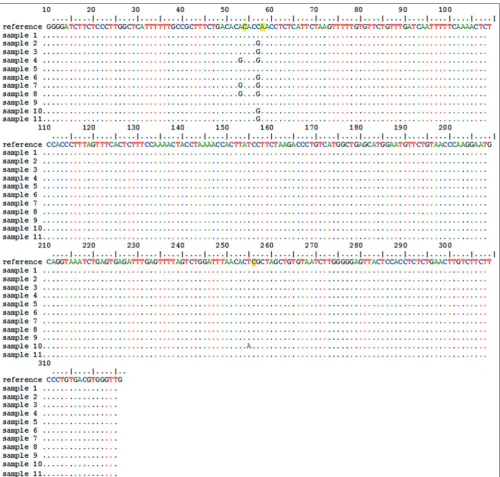
The results of UOMD promoter region polymorphisms revealed that the presence of four different conformational haplotypes appeared in patient and control groups, including haplotype with 4 bands, two haplotype patterns (a and b) containing 5 bands and haplotype with 6 bands. Whereas the sequencing results (Fig. 4) showed the presence of three SNPs determined the haplotypes of the UOMD promoter region
Fig. 1: The electrophoresis pattern of genomic DNA extracted from blood of patients with chronic kidney disease and end-stage
renal disease as well as healthy control groups. Lane 1-20 refers to extracted DNA from blood samples; electrophoresis conditions:
1% agarose, 75 V, 20 mA for 1 h (10 μl in each well).
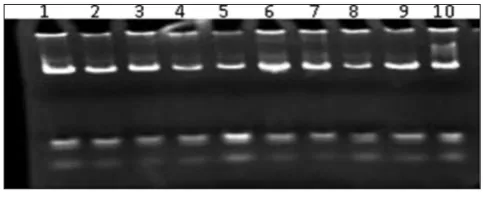
Fig. 2: Agarose gel electrophoresis of amplified products of UOMD
promoter region of patients with chronic kidney disease and end-stage renal disease and healthy control groups. M: DNA size
marker; lane 1-11 refers to the patterns of amplified products of UMOD promoter region (317 bp). Electrophoresis conditions:
1% agarose, 75 V, 20 mA for 120 min. The band staining with ethidium bromide
Fig. 3: DNA polymorphisms of the UOMD promoter region of patients chronic kidney disease (CKD), end-stage renal disease
(ESRD) and control using polymerase chain polymorphisms-single-strand conformation polymorphism technique. Lanes 2 and 9 represent the control group; lanes 1, 3-8, and 10 represent
the groups of patients (CKD and ESRD). Electrophoresis conditions: 8% polyacrylamide, power applied: 200 V-100 mA, for
depending on Primer3 plus reference sequences (ID: AY061638.1). These SNPs were C\G 45, A\G 49, and C\A 247 that distributed among CKD and ESRD patients. According to PCR-SSCP and sequencing results, there were three conformational haplotypes appeared among patient groups in comparison with control group (4-bands haplotype) (Fig. 5). There was A\G 49 conformational haplotype, which appeared 5 bands (3-7) in ESRD and CKD cases. The second was A\G 49 and C\A 247 conformation haplotypes, which showed the presence of 5 bands (2, 4-7) distributed in ESRD cases. The third was C\G 45 and A\G 49 conformational haplotype, which revealed the presence of 6 bands (1, 3-7) in ESRD cases. Furthermore, the results showed that there was no association between numbers of bands of PCR-SSCP with ESRD and CKD that indicates the SNPs were associated with both CKD and ESRD.
Table 3 refers to the present significant differences (p≤0.05) in
the serum levels of urea, creatinine, and calcium among PCR-SSCP
polymorphisms of the UMOD gene in ESRD group, while there are no significant differences in the concentrations in CKD group.
DISCUSSION
The consequences of the promoter region of the uromodulin encoding gene illustrated that four different haplotypes according to the number and location of the bands in the gel. These conformations including 4, 5 (two types 5a and 5b), and 6 bands. These variable conformations (5a, 5b, and 6 bands) may be due to the presence of three SNPs within the studied region which determined by the DNA sequencing results, whereas the haplotype with 4 bands in patient groups and control was not contained the detected SNPs, that may indicate the patient group containing other SNPs in other UMOD regions or other related genes because of the renal disease is multi-factorial. Conversely, these SNPs were detected between two groups of renal disease; in ESRD patient
Fig. 4: Sequences alignment ID: AY061638.1 results for Homo sapiens, UOMD gene promoter region by Bio Edit program version 7.2.5. Samples (1, 5, and 9) refer to control, samples (2, 3, 4, 6, 7, 8, 10, and 11) refer to patients, including end-stage renal disease (2, 3, 8, and
groups, the results indicate that there was no association between 4, 5, and 6 bands and CKD as compared with a control group. UMOD gene is transcribed utterly within the urinary organ as disclosed by Northern blot analysis. The transcription specificity of UMOD is about by its promoter sequence. The biological effectiveness of uromodulin is still rather mysterious, and it may have ability to conserve water/electrolyte balance inside the TAL depending on its gelification and physicochemical characteristics. In addition, it has protective effects against urinary tract infections (UTI) in Umod knockout mice [9]. This function is due to the ability of the uromodulin through its rich-mannose moiety to bind with the fimbria of bacteria such as Escherichia coli [10].
GWASs have successfully identified genomic loci comprising susceptibility variations related to the risk of complex characters and markers of renal function [11]. Particularly, common variants in the uromodulin encoding gene have been related to the risk of CKD, eGFR, and other complex characters, such as kidney stones and hypertension. One of the first GWASs on CKD applied on 20000 participants of European ancestry from unselected, population-based groups from the CHARGE association, investigated a high SNP (rs12917707) placed 3.4 upstream of uromodulin encoding gene [12]. However, the rs12917707 variant of UMOD was related to renal function indices which depending on the serum cystatin C and
Conformational haplotypes ESRD group number (%) Control group number (%) p value OR 95% CI
4 bandsa 18 (36) 23 (46) 0.25 1.47 0.28 - 1.61
5 bands 22 (44) 19 (38)
6 bands 10 (20) 8 (16) 0.29 1.59 0.52 - 4.87
5 bandsa 22 (44) 19 (38) 0.65 1.07 0.35 - 3.28
6 bands 10 (20) 8 (16)
Total number 50 50
aReference; *p≤0.05; OR=95% CI; ESRD: End-stage renal disease, PCR-SSCP: Polymerase chain polymorphisms-single-strand conformation polymorphism, OR: Odds
ratio, CI: Confidence interval
Conformational haplotypes CKD group number (%) Control group number (%) p value OR 95% CI
4 bandsa 19 (38) 23 (46) 0.50 1.33 0.46-2.61
5 bands 21 (42) 19 (38)
6 bands 10 (20) 8 (16) 0.32 1.51 0.49-4.59
5 bandsa 21 (42) 19 (38) 0.52 1.13 0.37-3.45
6 bands 10 (20) 8 (16)
Total number 50 50
aReference; *p≤0.05; OR=95% CI; CDK: Chronic kidney disease, ESRD: End-stage renal disease, PCR-SSCP: Polymerase chain polymorphisms-single-strand conformation
polymorphism, OR: Odds ratio, CI: Confidence interval
Table 3: The association of PCR-SSCP polymorphisms of UOMD gene in renal disease groups with physiological parameter PCR-SSCP haplotypes band
number (n) Mean±SEUrea (ng/ml) Creatinine (ng/ml) Calcium (ng/ml)
CKD
4 (n=18) 26.45±1.68 511.55±28.64 2.25±0.15
5 (n=22) 25.34±1.78 696.94±43.87 2.23±0.08
6 (n=10) 27.96±1.36 597.49±72.19 2.04±0.14
p value 0.62 0.01 0.55
ESRD
4 (n=19) 26.39±1.82 579.46±40.24 1.89±0.06
5 (n=21) 24.421.20 685.51±40.61 1.87±0.12
6 (n=10) 21.24±2.72 521.19±76.86 1.80±0.06
p value 0.19 0.069 0.84
n: Patient number, CKD: Chronic kidney disease, ESRD: End-stage renal disease,p≤0.05. The results represent as mean±SE (standard error), PCR-SSCP: Polymerase chain polymorphisms-single-strand conformation polymorphism
CONCLUSION
SSCP-PCR is a good screening method to detect genetic variations in an uromodulin promoter region.
Table 1: PCR-SSCP haplotype distribution of UMOD promoter region by the number of bands and their association with ESRD and control
groups
Table 2: PCR-SSCP haplotype distribution of UMOD promoter region by the number of bands and their association with CKD and control
groups
creatinine. This variant related to both higher eGFRcys and eGFRcreat and lower risk of the developing CKD. In line with a defensive result. As inevitable, the variants describe higher than make a case for a tiny, low shear (typically, lower than 1%) of the variation in eGFRcrea. Notably, there was no significant relationship between rs12917707 and hyperuricemia or arthritis [7].
1…...45...49 .............………...247...………
…………318bp
Control:...TGACACA[C]ACC[A]ACCTCTCATTCTATTTAACACT[C]GCTAGCT
GTGTAA
A\G 49: ....G............. .....................
A\G 49, C\A 247: ....G............. .......A.............
C\G 45 & A\G 49: ....G...G............. .....................
1 2 3 4
2 4
5
1 3
6 7
Fig. 5: Association of PCR-SSCP conformations and DNA-sequences of UMOD promoter region in patients with CKD and ESRD. Lane 1: Control conformation; 4 bands (3, 4, 5, and 7) of samples 2, 9, and 5. Lane 2: A\G 49 conformation (a); 5 bands (3, 4, 5, 6, and 7) of samples of ESRD (1) and CKD ( 4, 8, and 11). Lane 3: A\G 49 and C\A 247 conformation (b); 5 bands (2, 4, 5, 6, and 7) of sample 10
of ESRD. Lane 4: C\G 45 and A\G 49 conformation; 6 bands (1, 3,
ACKNOWLEDGMENT
The authors are thankful to College of Science, Babylon University and Dialysis unit at Morgan Hospital in Babylon Province and the faculties
for providing facilities needed for our work. The authors appreciate the agreements of patients and cooperation to provide the blood samples.
REFERENCES
1. Rampoldi L, Scolari F, Amoroso A, Ghiggeri G, Devuyst O. The rediscovery of uromodulin (Tamm-Horsfall protein): From tubulointerstitial nephropathy to chronic kidney disease. Kidney Int 2011;80:338-47.
2. Dahan K, Devuyst O, Smaers M, Vertommen D, Loute G, Poux JM,
et al. A cluster of mutations in the UMOD gene causes familial juvenile
hyperuricemic nephropathy with abnormal expression of uromodulin. J Am Soc Nephrol 2003;14:2883-93.
3. Sumitra K, Pragasam V, Sakthivel R, Kalaiselvi P, Varalakshmi P. Beneficial effect of Vitamin E supplementation on the biochemical and kinetic properties of Tamm-Horsfall glycoprotein in hypertensive and hyperoxaluric patients. Nephrol Dial Transplant 2005;20:1407-15. 4. Scolari F, Izzi C, Ghiggeri GM. Uromodulin: From monogenic to
modification diseases. Nephrol Dial Transplant 2015;30:1250-6. 5. Trudu M, Janas S, Lanzani C, Debaix H, Schaeffer C, Ikehata M,
et al. Common noncoding umod gene variants induce salt-sensitive
hypertension and kidney damage by increasing uromodulin expression. Nat Med 2013;19:1655-60.
6. Regele F, Jelencsics K, Shiffman D, Paré G, McQueen MJ, Mann JF,
et al. Genome-wide studies to identify risk factors for kidney disease
with a focus on patients with diabetes. Nephrol Dial Transplant 2015;30 Suppl 4:iv26-34.
7. Köttgen A, Glazer NL, Dehghan A, Hwang SJ, Katz R, Li M, et al. Multiple loci associated with indices of renal function and chronic kidney disease. Nat Genet 2009;41:712-7.
8. Reznichenko A, Böger CA, Snieder H, van den Born J, de Borst MH, Damman J, et al. UMOD as a susceptibility gene for end-stage renal disease. BMC Med Genet 2012;13:78.
9. Bates JM, Raffi HM, Prasadan K, Mascarenhas R, Laszik Z, Maeda N,
et al. Tamm-Horsfall protein knockout mice are more prone to urinary
tract infection: Rapid communication. Kidney Int 2004;65:791-7. 10. Serafini-Cessi F, Malagolini N, Cavallone D. Tamm-Horsfall
glycoprotein: Biology and clinical relevance. Am J Kidney Dis 2003;42:658-76.
11. Köttgen A. Genome-wide association studies in nephrology research. Am J Kidney Dis 2010;56:743-58.
12. Chambers JC, Zhang W, Lord GM, van der Harst P, Lawlor DA, Sehmi JS, et al. Genetic loci influencing kidney function and chronic kidney disease. Nat Genet 2010;42:373-5.