R E S E A R C H
Open Access
Adjustment of mobility parameters for traffic
steering in multi-RAT multi-layer wireless
networks
Pablo Muñoz
1*, Daniela Laselva
2, Raquel Barco
1and Preben Mogensen
2,3Abstract
Mobile broadband traffic has been increasing in the last years. To cope with such traffic demand, heterogeneous networks are an effective solution characterized by deploying networks with different cell sizes, radio access technologies (RATs) and carrier frequencies. Since the coverage area of these networks (or layers) is partially overlapped, users can be steered to a specific layer in order to improve network performance. In this work, two mechanisms of traffic steering are analyzed in a realistic high-speed packet access/long-term evolution deployment scenario, where the objective is to offload traffic from the macro-layer to pico-cells. In idle mode, i.e., the state in which no dedicated resources have been established for the user, a static adjustment of the layer priorities in the cell reselection algorithm is performed. In connected mode, where dedicated resources have been established, the parameters of the inter-RAT handover triggering condition are statically adjusted to offload the macro-layer. Simulation results show that further offloading can be achieved by modifying these algorithms so that user satisfaction is improved.
Keywords: Traffic steering, Heterogeneous networks, Handover, Cell reselection
1 Introduction
Heterogeneous networks (HetNets) will involve a diverse environment characterized by the presence of networks (layers) with different technologies, frequencies, cell sizes, etc. Future radio access technologies (RATs) such as long-term evolution (LTE) and LTE-advanced (LTE-A), which provide high data rates and good quality of ser-vice, will be deployed over the existing technologies such as Global System for Mobile Communications (GSM), Universal Mobile Telecommunications System (UMTS), high-speed packet access (HSPA) and WiFi. This need of extra capacity comes from the increasing complexity in the mobile terminals (presently called smartphones), the growing demand for online applications (such as video and music streaming services), and the increasing number of hotspots (small areas with high demand of traffic).
Both operators and users can select the preferred net-work layer among several candidates since the coverage
*Correspondence: [email protected]
1Communications Engineering Department, University of Málaga, Malaga 29071, Spain
Full list of author information is available at the end of the article
area of those network layers is partially or totally over-lapped in HetNets. This decision depends not only on the operator network deployment but also on the availabil-ity of technologies in the terminal. Each layer can also have a different cell size, which range from large sizes (macro-cells) to small sizes (pico- and femto-cells). Cells with smaller size are appropriate to provide higher capac-ity in areas with hotspots or remove coverage holes in urban areas. In addition, each network layer may operate at a different frequency that depends on the radio access technology and the radio spectrum license acquired by the operator.
The potential of steering a user connection towards a specific network layer in HetNets brings new challenges to the operators. This type of actions, known as traffic steering, attempts to use the resources in a more efficient way. Such a challenging task of selecting thebestnetwork due to the widespread deployment of overlapping wire-less networks has been addressed in the literature. In [1], a policy-enabled handover (HO) to express policies on what is the best wireless system is proposed. These policies allow to establish different trade-offs among indicators
related to cost, performance, power consumption, etc. In [2], an analytical approach to define a wide range of RAT selection policies, taking into account several allocation criteria such as service type and load, is proposed.
Users can also simultaneously use services through dif-ferent RATs. Such a problem is addressed in [3,4], where different strategies in a multi-RAT, multi-cellular, and multi-service scenarios are designed to indicate the suit-ability of selecting a specific RAT. Similarly, the problem of allocating multiple services onto different subsystems in multi-access wireless systems is addressed in [5], where some principles for how this service allocation should be done to maximize the resulting combined capacity are discussed.
There are also many references focused on particu-lar cases showing the benefits of traffic steering. For instance, a network layer suffering from a temporary traffic congestion can offload some users to a non-loaded layer (load balancing) [6,7]. High speed users can be connected to a so-called umbrella layer to avoid a frequent number of handovers [8]. Other factors con-tributing to the preferred choice of the access tech-nology are addressed in [9], where aspects such as coverage, securing QoS for the requested service, min-imizing the cost of delivering the service to the end user and maximizing the spectrum utilization by traffic packaging are considered to select the access technology. Potentials of dynamic traffic steering algorithms are also addressed in [10].
As shown in previous references, the specific objectives of traffic steering depend on operator policy, and they are achieved by utilizing mechanisms of mobility man-agement, which are usually standardized by organizations such as the 3rd Generation Partnership Project (3GPP) [11]. In idle mode, no dedicated resources have been established for the user equipment (UE), and the proce-dure for changing of camping cell is called cell reselection. A traffic steering policy can be used in this case to deter-mine the preferred layer for camping [3,12]. In connected mode, an HO is typically carried out when the UE moves between two cells to preserve the user connection. How-ever, this is not necessarily the only reason for triggering an HO. Since the coverage area of the layers is overlapped, a UE could trigger an HO due to traffic steering reasons [1,13]. An important issue that arises from using both cell reselection and HO procedures for traffic steering is the need of aligning these two mechanism to avoid ping-pong effects.
Most of the previous references are focused on selecting the preferred RAT disregarding the fact that heterogeneity of future networks also includes networks with different frequencies, cell sizes, etc. In addition, the RATs used as examples for assessing the traffic steering techniques typ-ically have been GSM, UMTS, and WLAN so that further
study on future networks such as LTE and LTE-A would be necessary.
This paper investigates traffic steering techniques by static adjustment of mobility parameters in HetNets. To find the optimal user distribution across the network lay-ers, a cell reselection algorithm considering different layer priorities and inter-RAT HOs is used for traffic steering purposes. More specifically, first, the problem of allocat-ing absolute priorities (APs) to network layers for cell reselection is analyzed. Second, a procedure to select the optimal thresholds of the 3GPP events that trigger the inter-RAT HOs is proposed. In this case, the prob-lem arising from the use of HO triggering events based on the signal level is addressed. When the events are based on the signal level instead of the signal quality, the thresholds involved in these events require a more precise adjustment, especially in multi-layer scenarios, where the location of low-power nodes within the macro-cell may determine the adjustment of the thresholds. The proposed techniques are assessed in a realistic scenario thoroughly deployed to cover hotspots with LTE pico-cells so that the traffic steering policy is to offload traffic to the pico-layers in order to use more efficiently the radio resources and improve service performance. The main contribu-tion of this work is the design of an algorithm to simplify the task of adjusting these thresholds for traffic steering. The impact of the LTE penetration in the mobile ter-minals is also studied in the LTE/HSPA scenario, where the LTE pico-cells are deployed in areas without LTE macro-coverage.
The rest of the paper is organized as follows. Section 2 is an overview of the deployment scenario and the mobility management algorithms used for traffic steer-ing. Section 3 describes the procedure for static adjust-ment of mobility parameters for traffic steering purposes. Section 4 discusses the simulation results, and Section 5 presents the main conclusions of the study.
2 Overview of mobility management
2.1 Deployment scenario
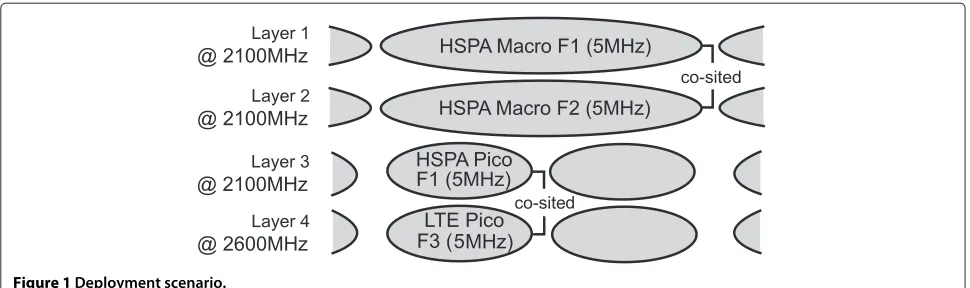
A key aspect to select the deployment scenario is the het-erogeneity expressed by the presence of different RATs, cell sizes, frequencies, hotspots, etc. in the network. How-ever, any combination of these factors is not always a relevant deployment so that the scenario must be also realistic. For these reasons, the multi-RAT macro-pico scenario described in Figure 1 has been adopted in this work. Such a scenario is also representative of multiple challenges arising from HetNet scenarios, as described in the following paragraphs.
Figure 1Deployment scenario.
to the cell size). An HSPA escape carrier, F2, has been included as another macro-layer, named layer 2, which is free of interference from other layers, and it is typ-ically used by operators to provide additional capacity to macro-users [14]. These two layers are co-sited (i.e., base stations are located in the same position). The pres-ence of hotspots forces the operators to provide more capacity in those areas by deploying cells of smaller sizes. Therefore, in the deployment scenario, LTE and HSPA pico-layers have been deployed in areas with hotspots, and these two layers are also co-sited. This configura-tion could be used in an early stage of LTE deployment in which LTE pico-cells have been deployed initially with-out LTE macro-coverage. In addition, there is no pico-cell clustering in the deployment scenario, i.e., pico-pico-cells are far enough away from each other. This means that traffic steering between non-co-sited pico-cells cannot be properly performed in this scenario. Another feature drawn from Figure 1 is that layers 1 and 3 are co-channel interferers. As a result, the interference induced by the co-channel layer would be large in the serving cell edge.
In the deployment scenario, mobility management is based on algorithms standardized by the 3GPP. Intra-/ inter- RAT cases and intra-/inter-frequency cases when the user changes of cell are all covered in [15-17]. The following paragraphs describe the mobility manage-ment algorithms used in this work for traffic steering.
2.2 AP-based cell reselection algorithm
In idle mode, the UE reselects a new cell to camp on it if the cell reselection criteria is fulfilled. Traditionally, the cell-ranking criterion R and the cell selection criterion S have been evaluated in this process [15]. However, in a context of different frequencies and RATs, AP may be provided to the UE for cell reselection.
APs is a feature that allows the operator to prioritize inter-frequency and inter-RAT network layers during the
cell reselection process. Firstly, the UE finds candidate cells by checking criterionS:
Srxlev=Qrxlevmeas−Qrxlevmin>0, (1)
and
Squal=Qqualmeas−Qqualmin>0, (2)
where Qrxlevmeas and Qqualmeas are the measured signal
level and signal quality, respectively, and Qrxlevmin and Qqualminare the minimum required values for each of the
previous measurements.
Once criterion S is fulfilled, the following condition depends on the cell priority. If the target cell has higher priority than the serving cell, the condition to be satisfied is as follows:
Squal,t>ThreshX,HighQ, (3)
where ThreshX,HighQis the threshold (in dB) used by the
UE on the target celltwhen reselecting towards a higher priority frequency or RAT. If the priority of the target cell is lower than or equal to the serving cell, then there are two conditions to be fulfilled:
Squal,s<ThreshServing,LowQ, (4)
and
Squal,t>ThreshX,LowQ, (5)
where ThreshServing,LowQ is the threshold (in dB) on the
serving cell s and ThreshX,LowQ is the threshold on the
higher priority will take precedence over a lower priority frequency or RAT. For intra-frequency and equal priority inter-frequency cases, criterionR is applied.R is a cell-ranking criterion based on either of signal quality or signal level.
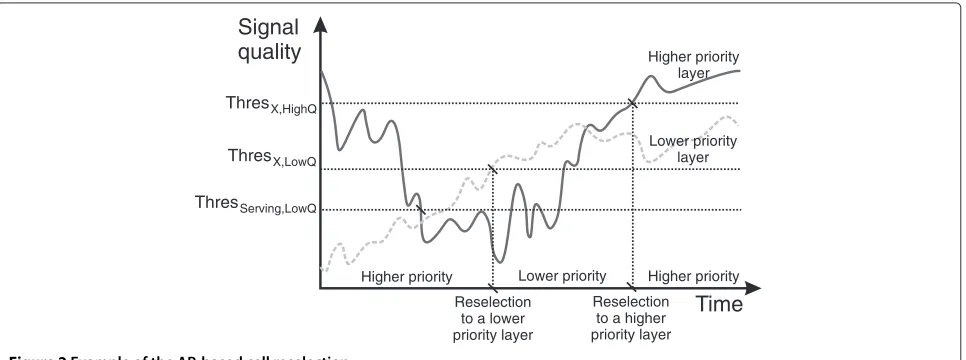
An example of the cell reselection when APs are used in LTE is shown in Figure 2, where the signal quality received by a UE from two cells with higher/lower priority is drawn. As it can be observed, the UE firstly reselects towards a cell of the lower priority layer. After this, the UE returns to the initial layer. Note that the conditions shown in this section must be fulfilled during a time interval named Treselection. In Section 3, the cell reselection priority levels
will be assigned to the network layers of the deployment scenario according to the traffic steering policy.
2.3 Inter-RAT HO algorithm based on theB2/3Aevents
Inter-RAT HOs refer to those HOs carried out between cells from different RATs when the UE is in connected mode. An HO from LTE to HSPA is performed when the B2 event is triggered, that is, the reference signal received
power (RSRP) of the LTE serving cell sbecomes worse
than the threshold B2_1 and the received signal code
power (RSCP) of the HSPA target cellt becomes better
than the thresholdB2_2 [16]:
RSRPs<B2_1 and RSCPt>B2_2. (6)
Similarly, an HO from HSPA to LTE is performed when the 3Aevent is triggered [17]. In this case, the thresholds 3A_1 and 3A_2 are used for evaluation:
RSCPs<3A_1 and RSRPt>3A_2. (7)
The previous measurements performed by the UE are based on the signal level. However, such measurements can be also referred to the signal quality so that the ref-erence signal received quality (RSRQ) and CPICH Ec/No
are used for measuring LTE and HSPA cells, respectively. From the operator’s perspective, working with observable measurements (e.g., the RSRP) is usually preferable since the concept of quality sometimes requires certain level of abstraction and complexity to draw inferences from the measurement analysis. For this reason, in this work, the measurement type for triggering HO events is based on the signal level instead of the signal quality. The main drawback is that the adjustment of the thresholds based on the signal level may depend on the specific network layer (e.g., the cell size). The next section discusses more about how to define these thresholds from traffic steering purposes.
3 Mobility management for traffic steering A reasonable traffic steering strategy is to take full advan-tage of the existing pico-cells by offloading as much traffic as possible from the macro-cells. Since the pico-cells have been thoroughly located in hotspots, most of the traffic in hotspots are carried by the pico-layer. However, mobility management can be used to further offload traffic from macro-cells to this layer, assuming that there is still some capacity remaining in the pico-cells. Thus, some parame-ters of the mobility management algorithms in both idle and connected modes can be modified for this purpose.
3.1 Traffic steering in idle mode
In idle mode, further offloading to pico-cells can be achieved by simply changing the APs of the network layers used for cell reselection. The objective is to enforce such a user distribution across the layers that the resource uti-lization is optimal. Since the HO has a signaling cost and a data transferring cost, it is important to achieve the opti-mal user distribution from the idle mode. A full alignment of user distributions in both idle and connected modes also avoids the ping-pong effect between these two states.
Higher priority layer
Thres
Time
Signal
quality
X,HighQ
ThresServing,LowQ ThresX,LowQ
Lower priority layer
Reselection to a lower priority layer
Reselection to a higher priority layer
Higher priority Lower priority Higher priority
To allocate APs to networks layers, several considera-tions must be taken into account. First, those network layers belonging to the same RAT and sharing the same frequency must have the same AP. Thus, in the deploy-ment scenario, layers 1 and 3, which share frequencyF1, cannot have different AP levels [15]. Another limitation imposed by the 3GPP is that two RATs sharing the same priority level is not supported. In the deployment sce-nario, this implies that the pico-layers cannot have the same priority so that one layer takes higher priority for the macro-offloading. As layer 1 causes co-channel interfer-ence with layer 3, the highest priority should be allocated to layer 4. Looking at the previous constraints together with the objective of offloading traffic from the macro-layers, two candidate sets of AP allocation are proposed. The difference lies in the relative priority between lay-ers 1 and 2, that is, whether the macro-escape carrier takes priority over the main carrier or it is just the oppo-site. Thus, given that 0 is the lowest priority level, the two proposed sets of APs for the deployment scenario are as follows:
AP1=[L1,L2,L3,L4]=[ 0, 1, 0, 2] ; AP2=[ 1, 0, 1, 2] ,
(8)
whereLX refers to layerX. In both cases, it is expected that a user located in a hotspot has higher probability of starting a connection from the LTE layer, according to the traffic steering policy.
3.2 Traffic steering in connected mode
When the UE is in connected mode, traffic steering can be performed by forced HOs, cell barring, or adjusting HO parameters. The latter is the simplest mechanism because it does not need to be user-specific and it is not as rigid as cell barring. In addition, it is possible to define differ-ent thresholds for the same HO triggering evdiffer-ent according to particular policies. For instance, radio-driven HOs are concerned with HOs carried out when the UE experiences poor signal quality, but HOs due to traffic steering pur-poses can be also defined. In the first case, UEs will be generally handed over to cells with better quality, by set-ting B2/3A thresholds. Conversely, in the second case, UEs will be generally handed over under good signal con-ditions. Since these two cases are complementary, two different sets of thresholds for a specific HO triggering event can be defined in the network.
Traffic steering is performed here by adjusting the thresholds of the (inter-RAT)B2 and 3Aevents in LTE and HSPA, respectively. As mentioned before, in the deploy-ment scenario,L4 has been selected to offload traffic from macro-cells because it does not receive interference from any other layer. It is noted that offloading between pico-cells is not considered as pico-pico-cells in the deployment
scenario are typically far enough away from each other. In addition, the number of inter-RAT HOs between co-sited pico-cells (layersL3 andL4) is expected to be negligible because of the difficulty of fulfilling both conditions (for the serving and the target cell) in Equations 6 and 7. Thus, this study is only focused on macro-pico HOs, disregard-ing the pico-pico case. Note that, if a larger deployment of pico-cells were considered in the scenario, a certain hysteresis region should be considered when adjusting the B2/3A thresholds in order to avoid ping-pong HOs between non-co-sited HSPA and LTE pico-cells due to user mobility.
A single set ofB2/3Athresholds defined in the network might be enough for traffic steering. However, it is also possible to have the thresholds defined per layer pair. The deployment scenario includes two macro-pico layer pairs as there is an additional macro-layer given by the HSPA escape carrier (F2). Unlike the HSPA main carrier (F1),F2 does not receive interference from any other layer. This means that the optimalB2/3Athresholds should not nec-essarily be the same for these layers. In this work,B2/3A thresholds are assumed to be defined per layer pair. The benefit derived from this consideration will be analyzed in Section 4.
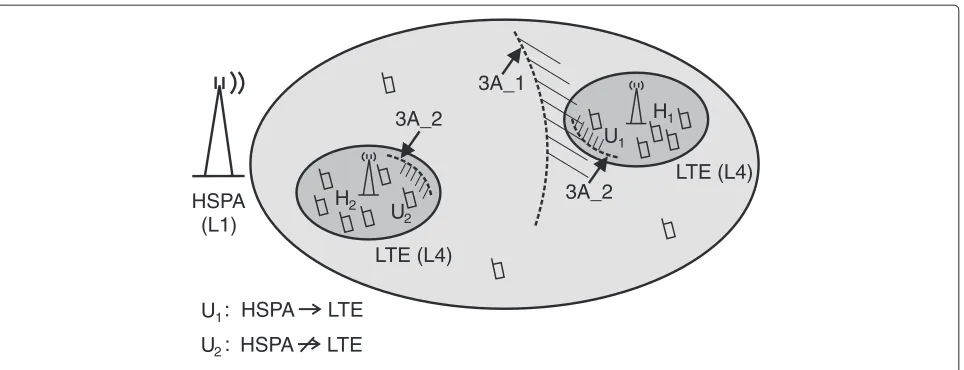
Another assumption made in Section 2 is that event measurements are based on the signal level instead of the signal quality. A problem arises when the signal level is used for the HO triggering condition and the deployment scenario includes cells of different sizes. Suppose that a userU1 is located in a hotspotH1 and connected to
the macro-layer, as shown in Figure 3. Due to the traffic steering policy, the thresholds 3A_1 and 3A_2 have been previously set so thatU1is handed over to the
neighbor-ing LTE pico-cell. However, userU2, located inH2(closer
to the macro-cell base station), probably will not perform an HO because the condition involving 3A_1 would not be fulfilled. Such a situation highlights that the adjustment of 3A_1 to offload the macro-cell depends on the pico-cell location. To avoid distance dependence, setting a very high value for 3A_1 is similar to the removal of the first condition in Equation 7. The same approach is applied to the case in which the UE is connected to LTE and is leav-ing a hotspot. To send the UE to the HSPA macro-cell, it is necessary to fulfill the second condition in Equation 6, regardless of the pico-cell location. Thus, setting a very low value forB2_2 would remove this dependence. How-ever, this configuration is certainly dangerous as the UE could be handed over to a cell with very low signal level. For this reason, Algorithm 1 is proposed to adjust the thresholds ofB2 and 3Aevents for traffic steering.
U
3A_2 3A_1
H1
H2
3A_2
1
U2
HSPA
LTE (L4)
LTE (L4)
HSPA LTE
U1:
U2: HSPA LTE
(L1)
Figure 3The impact of the measurement type in a multi-layer scenario.
comprises cells of different sizes and RATs. IfB2_2 and 3A_1 have been set to be always fulfilled,B2_1 and 3A_2 can be used to define the concerned area in both direc-tions, i.e., moving from LTE to HSPA and vice versa. In principle, these two parameters could have the same value, but a certain hysteresis () can be also applied to avoid the ping-pong effect between RATs. Step 2 consists of a sensitivity analysis ofB2_1 in order to select a value that optimizes the resource utilization. A set of values selected from the normal operating range of B2_1 is assessed by looking at the main key performance indicators in order to find the optimal value, and then B2_1 is set to this value. The remaining steps are devoted to optimizeB2_2 and 3A_1. In the case ofB2_2, there may exist a trade-off between keeping the optimal resource utilization achieved in step 2 and avoiding low values which jeopardize the connection quality.
Algorithm 1Adjustment ofB2/3Athresholds for traffic steering
1: Initially, set:
B2_2→ −∞,
3A_1→ +∞,
3A_2=B2_1+, Delta=4 dB [18]. 2: Sensitivity analysis ofB2_1
(find the optimal value according to performance indicators)
3: Set:
B2_1→optimal value. 4: Sensitivity analysis ofB2_2 5: Sensitivity analysis of 3A_1 6: Set:
B2_2→optimal value. 3A_1→optimal value.
In real networks, context factors such as the system load are varied frequently and dynamically. To avoid that such variations affect the analysis involved in Algorithm 1, the performance indicators should be collected using a measurement period long enough. For example, as there are typically two distinguished traffic patterns within a day (i.e., daily and nightly traffic patterns), the mea-surement period could be the hours during the day. Thus, a new control parameter setting would be tested every day during the same time interval to ensure sim-ilar conditions. Note that this optimization process can last several weeks, which is the typical duration of field trial campaigns performed by operators and man-ufacturers. The optimal settings can then be fixed in the network during months or even years. In addition, Algorithm 1 can be executed periodically to cope with long-term changes in the traffic patterns, e.g., the center of a city becomes crowded and a new shopping center is built.
4 Results
4.1 Simulation setup
this, the offered traffic in the network is calculated as follows:
Offered traffic= BR·SL
IAT , (9)
where BR is the service bit rate per session (in Mbps), SL is the session length (in seconds), and IATis the mean inter-call time (in seconds) in the concerned area calculated as follows:
IAT= IAT
Nusers
, (10)
where IAT is the mean inter-session time per mobile (in seconds) andNusers is the number of mobiles in the
concerned area. If the buffer at the UE is emptied, a re-buffering is needed and the video playout is interrupted. When the interruption time exceeds a specific threshold, the user is dropped out. The arrival rate of new connec-tions is exponentially distributed. Only the downlink is considered in the simulation as it is the most restrictive link with this type of service in next-generation wireless networks. The main simulation parameters are summa-rized in Table 1. For each parameter setting of the sen-sitivity analysis, an independent simulation of 150 s in duration has been carried out. Note that this simulation time is large enough to obtain reliable measurements for the network size, the traffic model, and the system load used in this work. In addition, network conditions remain fairly constant throughout the simulations. This situa-tion can emulate, e.g., the busy hour, the working hours in a business area, and the daytime in the downtown. If the system load varies dynamically throughout the day in the real network, firstly, the operator should identify the time frames in which the load remains fairly constant and then perform the optimization separately for each period. Alternatively, operators could set the parameters with the values optimized for the critical situation.
4.2 Simulation results of traffic steering in idle mode
The following allocations of APs are evaluated: AP0= [0 0
0 0], AP1= [0 1 0 2], and AP2= [1 0 1 2]. AP0is a
refer-ence setting allocating the same AP to the network layers and included for comparison with the proposed settings AP1and AP2. The settings ofB2/3Athresholds for
inter-RAT HOs are the following:B2_1= −104 dBm,B2_2=
−98 dBm, 3A_1 = −92 dBm, and 3A_2 = −100 dBm.
The reason for setting those values will be discussed in Section 4.3.
Figure 4 shows the total traffic carried per macro-cell area (i.e., two macro-cells and four pico-cells) as well as the traffic carried per network layer and macro-cell area. Note that in a macro-cell area, the offered traffic calcu-lated using Equation 9 with the parameter values shown
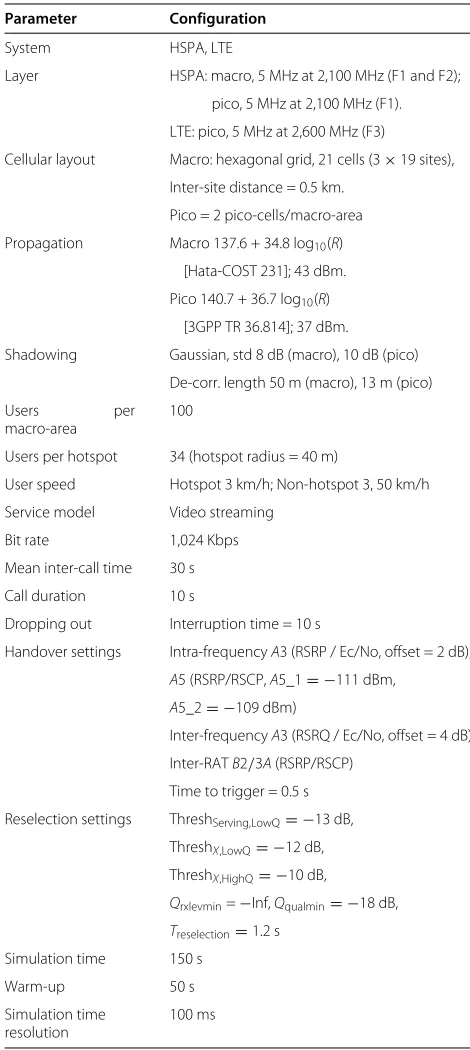
Table 1 Simulation parameters
Parameter Configuration
System HSPA, LTE
Layer HSPA: macro, 5 MHz at 2,100 MHz (F1 and F2);
pico, 5 MHz at 2,100 MHz (F1).
LTE: pico, 5 MHz at 2,600 MHz (F3)
Cellular layout Macro: hexagonal grid, 21 cells (3×19 sites),
Inter-site distance = 0.5 km.
Pico = 2 pico-cells/macro-area
Propagation Macro 137.6 + 34.8 log10(R)
[Hata-COST 231]; 43 dBm.
Pico 140.7 + 36.7 log10(R)
[3GPP TR 36.814]; 37 dBm.
Shadowing Gaussian, std 8 dB (macro), 10 dB (pico)
De-corr. length 50 m (macro), 13 m (pico)
Users per
macro-area
100
Users per hotspot 34 (hotspot radius = 40 m)
User speed Hotspot 3 km/h; Non-hotspot 3, 50 km/h
Service model Video streaming
Bit rate 1,024 Kbps
Mean inter-call time 30 s
Call duration 10 s
Dropping out Interruption time = 10 s
Handover settings Intra-frequencyA3 (RSRP / Ec/No, offset = 2 dB),
A5 (RSRP/RSCP,A5_1= −111 dBm,
A5_2= −109 dBm)
Inter-frequencyA3 (RSRQ / Ec/No, offset = 4 dB)
Inter-RATB2/3A(RSRP/RSCP)
Time to trigger = 0.5 s
Reselection settings ThreshServing,LowQ= −13 dB,
ThreshX,LowQ= −12 dB,
ThreshX,HighQ= −10 dB,
Qrxlevmin=−Inf,Qqualmin= −18 dB,
Treselection=1.2 s
Simulation time 150 s
Warm-up 50 s
Simulation time resolution
100 ms
L1 L2 L3 L4 Total 0
10 20 30
Carried
Traffic
[Mbps]
(a)
50% LTE penetration AP0AP1 AP2
L1 L2 L3 L4 Total
0 10 20 30
Carried
Traffic
[Mbps]
(b)
100% LTE penetration AP0AP1 AP2
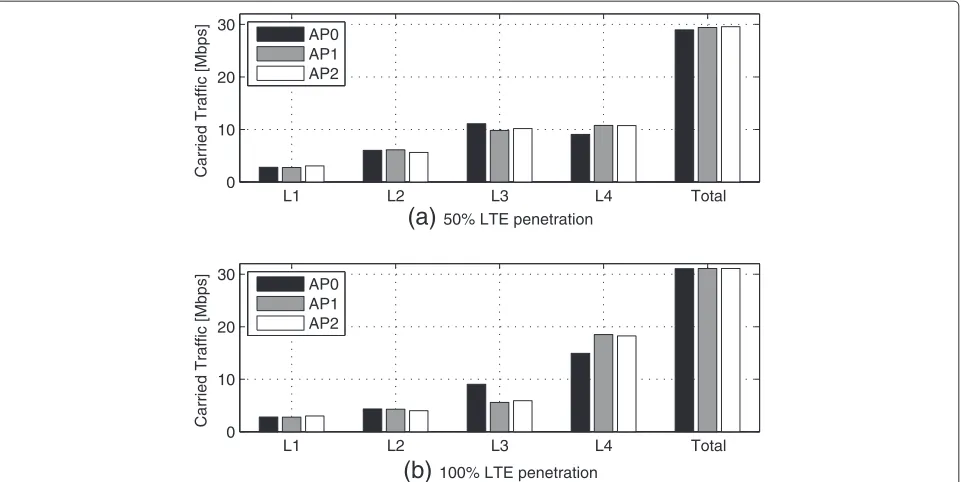
Figure 4Carried traffic per macro-cell area for different settings of APs.(a) 50% LTE penetration. (b) 100% LTE penetration.
(compared to macro-cells) is expected. In addition, asL1 andL3 are co-channel interferers, lower capacity for those layers (compared toL2 andL4) is expected.
Regarding the AP settings, with 50% LTE penetration, more traffic (approximately 1.7 Mbps) is carried by L4 when AP1and AP2are used. This is because further UE
offloading toL4 is achieved using the AP-based cell rese-lection. It is also noted that AP2leads to a lower carried
traffic in L2 since the priority allocated to this layer is lower. In addition,L3 andL4 carry similar traffic volumes since the LTE penetration is only partial. Conversely, with 100% LTE penetration,L4 carries considerably more traf-fic since there are more LTE-compatible UEs which can be transferred toL4. In addition, more traffic (approximately
3 Mbps) is carried by L4 when AP1 and AP2 are used
instead of the reference case AP0. Note also that most of
this traffic comes from the co-sited pico-layer (L3), which means that macro-offloading (i.e., traffic from macro- to pico-cells) is very limited.
On the other hand, regarding the total carried traffic in Figure 4, note that the differences between the AP settings are due to the dropped calls, which means that less traffic is carried by the network. The relationship between the carried traffic and the dropping ratio (i.e., the number of dropped calls to the total number of carried calls) is given by the following expression:
Carried traffic=Offered traffic×(1−Dropping ratio). (11)
The dropping ratio is related in this paper to resource availability rather than to bad radio conditions, i.e., a lower value for this indicator means that enough resources are available to play out the video sessions with no or few interruptions. Thus, a better optimization of mobility parameters means a lower dropping ratio. The dropping ratio measured for the previous AP settings and LTE pen-etration levels is shown in Table 2. Note also that the dropping ratio is closely related to the blocking ratio. A user is blocked when it attempts to start a session but no resources are available. However, as the number of users in the simulation is fixed, all the users are accepted by the system (i.e., no measurements related to call blocking are performed). Thus, the benefits of reselection optimization will not impact on lower call blocking or better acces-sibility (i.e., higher number of served users) but on user satisfaction in terms of lower dropping ratio.
With 50% LTE penetration, AP0 leads to lower total
carried traffic since the dropping ratio is higher. This is because the traffic distribution within the pico-layers for AP0 is different from AP1 and AP2, as AP0 carries
Table 2 Key performance indicators for different AP settings in idle mode
Configuration nRes/s nHO/s HO PP RLF Dropping
AP LTE penetration (%) ratio ratio ratio
AP_0 50 102.7 31.6 7.2 4.3 15.0
AP_1 50 122.1 31.8 6.5 4.1 13.5
AP_2 50 126.3 30.6 6.5 4.5 13.2
AP_0 100 137.1 38.6 10.0 3.0 6.1
AP_1 100 189.8 36.8 9.0 3.2 6.0
AP_2 100 194.4 35.9 9.7 3.6 6.1
Total number of UEs = 2,100. nRes/s, number of reselections per second; nHO/s, number of HOs per second; HO PP ratio, HO ping-pong ratio; RLF ratio, radio link failure ratio.
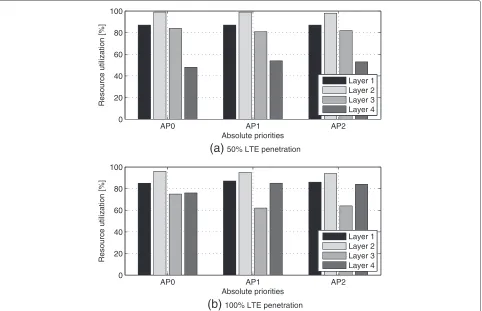
(macro-offloading is higher). This effect is drawn from the resource utilization (percentage of the total amount of resources that are being used) depicted in Figure 5, where it is shown that the resource utilization in L4 is approximately 50% with 50% LTE penetration and approximately 80% with 100% LTE penetration (i.e., approximately 30% increased). With 50% LTE penetra-tion, the increased dropping ratio is due in part to an excessive resource utilization (99%) in L2. In this case, the limited macro-offloading performed by set-tings AP1 and AP2 increases the resource utilization in
L4 by only approximately 6%. With 100% LTE
pene-tration, this value reaches approximately 9%. In
addi-tion, the resource utilization in L3 is decreased by
approximately 12%.
The previous analysis shows that, in general, the user distribution between two layer pairs with coverage areas that are fully overlapped (e.g., co-sited layers) can be effec-tively modified by allocating different APs. In this case, APs can be used, for example, to reduce the interference generated over other intra-frequency layers by decreas-ing the percentage of UEs attached to the interferdecreas-ing layer
AP0 AP1 AP2
0 20 40 60 80 100
Absolute priorities
Resource
utilizatio
n[
%
]
(a)
50% LTE penetrationLayer 1 Layer 2 Layer 3 Layer 4
AP0 AP1 AP2
0 20 40 60 80 100
Absolute priorities
Resource
utilizatio
n[
%
]
(b)
100% LTE penetrationLayer 1 Layer 2 Layer 3 Layer 4
(e.g.,L1 andL3). Such a reduction of interference would mean a lower dropping ratio in the network. Conversely, the macro-offloading performed by extending the cell edge area of small cells (e.g., pico-cells) is rather limited.
Finally, Table 2 includes some other key performance indicators related to signaling and radio features. In par-ticular, the number of reselections per second (nRes/s), the number of HOs per second (nHO/s), the HO ping-pong ratio (HO PP ratio) and the radio link failure ratio (RLF ratio) are shown. The main difference in signaling cost between the proposed settings (AP1 and AP2) and
the reference case (AP0) is that the number of
reselec-tions is increased by approximately 20% and 40% with 50% and 100% LTE penetrations, respectively. Regarding the radio aspect, there is no appreciable difference between settings, only that the RLF ratio is decreased by approx-imately 1% when the LTE penetration changes from 50% to 100%.
4.3 Simulation results of traffic steering in connected mode
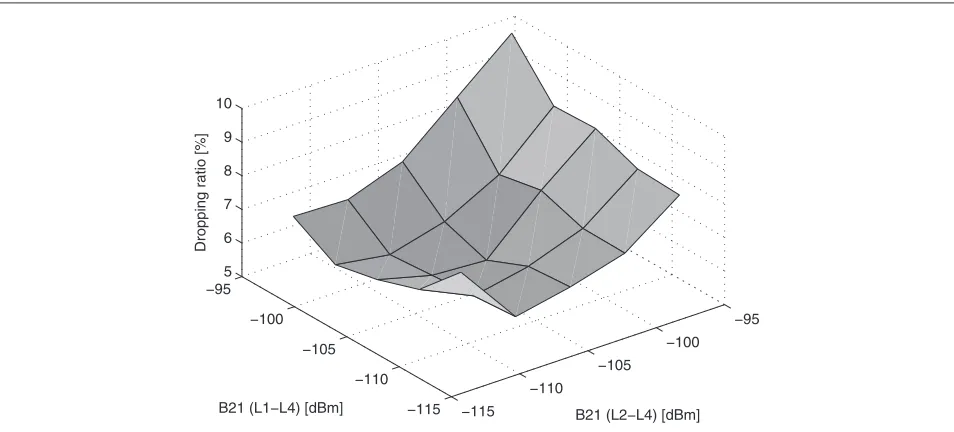
In connected mode, the parameter adjustment for traf-fic steering described in Algorithm 1 involves sweeping of B2/3A thresholds. This study has been carried out with AP2and 100% LTE penetration. Figure 6 shows the
dropping ratio drawn from sweepingB2_1. Following the 3GPP specifications, the ranges of valid values for LTE and
HSPA are from −140 to −44 dBm [20] and from −120
to−25 dBm [21], respectively. However, in this paper, the represented ranges have been bounded since values out-side the represented range lead to undesired values of the indicators. As the B2/3Athresholds are assumed to be defined per layer pair, in principle, there are two different
sets of parameters defined for macro-pico HOs. The x-axis refers to the layer pair involving layers 1 and 4 (L1, L4), while they-axis corresponds to the layer pair formed by layers 2 and 4 (L2, L4). It is observed that high val-ues ofB2_1 increase the dropping ratio sinceL4 carries out less traffic (doing the opposite of macro-offloading). On the other hand, low values ofB2_1 also increase the dropping ratio since more UEs connected toL4 stay in the cell edge experiencing very bad quality. The optimal value regarding the dropping ratio (i.e., the minimum value) is achieved by two settings: (−104,−104 dBm) and (−100, −108 dBm). To select a single setting, the signaling cost in terms of total number of HOs in the overall network is depicted in Figure 7. It is noted that (−96,−112 dBm) leads to the highest signaling cost since UEs are handed over from L2 to L4, and then, they are moved from L4 to L1, producing a strong ping-pong effect. The differ-ence between the two selected points, (−104,−104 dBm) and (−100,−108 dBm), is that the former gives a reduc-tion of 25% in signaling cost. For this reason, the optimal value is (−104, −104 dBm). It is noted that both layer pairs have the same optimal value (B2_1= −104 dBm) so that a single thresholdB2_1 (defined per network) could be used in this case. In addition, since the adjustments ofB2_2 and 3A_1 have a minor impact from the macro-offloading perspective, these parameters are also assumed to be defined per network to simplify the optimization process (less sensitivity analysis are needed).
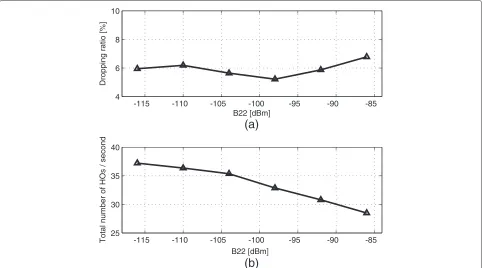
The following step from Algorithm 1 is the sweep-ing of B2_2. Figure 8 shows the dropping ratio and the total number of HOs derived from this analysis. It is observed that increasingB2_2 does not significantly affect the dropping ratio. This is because the inter-RAT HOs
−115
−110
−105
−100 −95
−115 −110 −105 −100 −95
5 6 7 8 9 10
B21 (L2−L4) [dBm] B21 (L1−L4) [dBm]
Dropping ratio [%]
−115
−110 −105
−100 −95
−115 −110 −105 −100 −95
30 40 50 60 70 80
B21 (L2−L4) [dBm] B21 (L1−L4) [dBm]
Total number of HOs / second
Figure 7Total number of handover per second versus thresholdB2_1.
to bad cells are being limited while macro-offloading is also being restricted so that both effects are counter-acted, keeping the dropping ratio around 6%. However,
there is a minimum located at B2_2 = −98 dBm.
Since an acceptable signaling cost is achieved at this
point (see Figure 8), B2_2 = −98 dBm is selected in
this work.
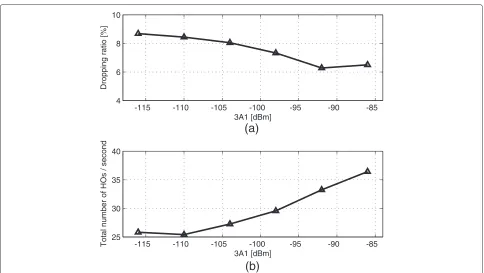
Figure 9 shows the dropping ratio and the signaling cost referred to the sweeping of 3A_1. It is noted that decreas-ing 3A_1 leads to an increment in the dropping ratio as a result of restricting the macro-offloading (the number of inter-RAT HOs is decreased), especially in pico-cells close to the macro-cell base station. For this reason, 3A_1= − 92 dBm is the selected value since the macro-offloading is
-115 -110 -105 -100 -95 -90 -85
4 6 8 10
B22 [dBm]
Dropping
ratio
[%]
-115 -110 -105 -100 -95 -90 -85
25 30 35 40
B22 [dBm]
Total
number
of
HOs
/
second
(b)
(a)
-115 -110 -105 -100 -95 -90 -85 4
6 8 10
3A1 [dBm]
Dropping
ratio
[%]
-115 -110 -105 -100 -95 -90 -85
25 30 35 40
3A1 [dBm]
Total
number
of
HOs
/
second
(a)
(b)
Figure 9Performance evaluation of sweeping3A_1.(a) Dropping ratio versus 3A_1. (b) Total nHO/s versus 3A_1.
not affected (dropping ratio does not increase) and a 10% signaling reduction (compared to+∞) is obtained.
Once theB2/3Athresholds have been optimized, per-formance is assessed and compared with reference cases. The first reference case implements inter-RAT HOs based on the 3GPPA3 event (neighbor cell becomes offset bet-ter than serving cell) with an offset equal to 4 dB and the measurement type for triggeringA3 is based on the signal level. It is noted that A3 event has been typically used for intra-RAT HOs. To useA3 event for inter-RAT HOs as a reference case, the transmitted power is assumed
to be the same for both HSPA and LTE in the simula-tions. The second reference case also uses theA3 event for inter-RAT HOs, but the measurement type is based on the signal quality. Figure 10 shows the carried traffic per layer and macro-cell area. As observed, the use ofA3 event leads to lower system capacity (i.e., higher dropping ratio) since more traffic is carried through L3 instead of L4. AsL1 causes co-channel interference withL3, these con-figurations lead to worse performance. More specifically, the worst case leading to the lowest macro-offloading is ‘A3 level’. If the signal quality (RSRQ / Ec/No) is used
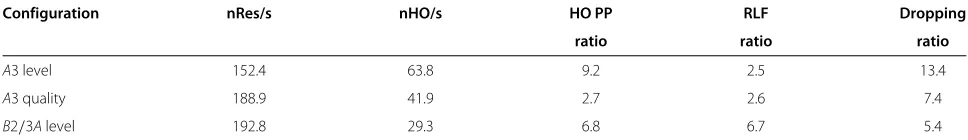
Table 3 Key performance indicators for different HO settings in connected mode
Configuration nRes/s nHO/s HO PP RLF Dropping
ratio ratio ratio
A3 level 152.4 63.8 9.2 2.5 13.4
A3 quality 188.9 41.9 2.7 2.6 7.4
B2/3Alevel 192.8 29.3 6.8 6.7 5.4
Total number of UEs = 2,100. nRes/s, number of reselections per second; nHO/s, number of HOs per second; HO PP ratio, HO ping-pong ratio; RLF ratio, radio link failure ratio.
instead, the macro-offloading is higher (especially forL2) since this measurement type is load-sensitive, i.e., due to the RSRQ and Ec/No definition, such indicators also depend on the load in the serving cell so that pico-cells automatically perform cell range extension when many resources are available. Conversely, the proposed set-ting provides the highest carried traffic since theB2/3A thresholds have been thoroughly adjusted to offload
traf-fic towards L4. It is noted that not only the
macro-offloading is higher (e.g.,L2 carries less traffic) but also the traffic distribution between pico-layers is different, i.e., less traffic is carried byL3 to avoid interfering withL1.
Table 3 shows the main key performance indicators to compare the proposed configuration (B2/3Alevel) with the reference cases. As a result of a better UE distribution across the layers, the proposed configuration achieves the lowest dropping ratio. Regarding the signaling cost, it is noted that the number of HOs is greatly decreased (30%) compared to the second reference case, while the number of reselections is slightly increased (2%). Thus, the proposed configuration significantly reduces the sig-naling cost in connected mode, where sigsig-naling is more critical. Lastly, regarding the radio aspect, it is observed that the proposed configuration increases the RLF ratio as a result of the pico-cell range extension, which increases the number of UEs in the cell edge, where the connection quality is worse.
5 Conclusions
This paper has analyzed two traffic steering techniques in an HSPA/LTE multi-layer wireless network. The purpose of these techniques is to offload as much traffic as possible from the macro-layer to the pico-layer since extra capac-ity is available in pico-cells. To achieve this objective, the absolute priorities of the cell reselection algorithm in idle mode and the thresholds ofB2/3Aevents for inter-RAT HOs in connected mode have been statically modified to further offload the macro-layer. In addition, an algorithm to simplify the task of adjusting the B2/3A thresholds when the measurement type is based on the signal level has been proposed.
Simulation results show that user distributions in idle and connected mode can be controlled by adjusting the APs, although the macro-offloading performed is very
limited, even with 100% LTE penetration in the UEs. The user distributions between the two co-sited pico-layers are more sensitive to APs, which means that more traffic (approximately 1.7 Mbps) can be transferred from HSPA to LTE with 50% LTE penetration and approximately 3 Mbps with 100% LTE penetration. The main benefit of adjusting APs is that the HSPA pico-layer generates lower interference to the co-channel HSPA macro-layer, decreasing the dropping ratio in the network. This is espe-cially observable with 50% LTE penetration, where the LTE pico-cells are typically less loaded.
In the case of performing traffic steering in connected mode, the proposed algorithm for adjusting the B2/3A thresholds allows to control the user distribution in a more accurate way than the reference cases based on the A3 event, which means that further offload traffic from macro-cells can be achieved. In addition, a significant amount of traffic can be transferred from HSPA pico-cells to the LTE pico-layer, thus, reducing the interference that the HSPA pico-layer causes to the macro-layer and increasing the total carried traffic. More specifically, the benefits of this technique are lower dropping ratio (up to 8% decrease) and lower signaling cost (30% decrease). The main drawback is an increase of the radio link failure (4%), as a result of the cell range extension.
Abbreviations
3GPP: 3rd Generation Partnership Project; AP: absolute priority; GSM: Global System for Mobile Communications; HetNet: heterogeneous network; HO: handover; HO PP: handover ping-pong; HSPA: high-speed packet access; LTE: long-term evolution; LTE-A: long-term evolution-advanced; nHO: number of handovers; nRes: number of reselections; RAT: radio access technology; RLF: radio link failure; RSCP: received signal code power; RSRP: reference signal received power; RSRQ: reference signal received quality; UE: user equipment; UMTS: Universal Mobile Telecommunications System.
Competing interests
The authors declare that they have no competing interests.
Acknowledgements
This work has partially been supported by Junta de Andalucía (Excellence Research Program, project P08-TIC-4052).
Author details
1Communications Engineering Department, University of Málaga,
Malaga 29071, Spain.2Nokia Siemens Networks, Aalborg, Denmark.3Aalborg
University, Aalborg 9220, Denmark.
References
1. HJ Wang, RH Katz, J Giese, inProceedings of IEEE Workshop on Mobile Computing Systems and Applications (WMCSA ’99). Policy-enabled handoffs across heterogeneous wireless networks (IEEE Piscataway, 1999), pp. 51–60
2. X Gelabert, J Pérez-Romero, O Salient, R Agustí, inProceedings of IEEE 64th Vehicular Technology Conference (VTC). 4-dimensional Markov model for the evaluation of radio access technology selection strategies in multiservice scenarios (IEEE Piscataway, 2006), pp. 1–5
3. L Giupponi, R Agustí, J Pérez-Romero, O Salient, A framework for JRRM with resource reservation and multiservice provisioning in
heterogeneous networks. Mobile Netw. Appl.11, 825–846 (2006) 4. L Giupponi, R Agustí, J Pérez-Romero, O Salient, inProceedings of the 6th
IEEE International Conference on 3G and Beyond. A fuzzy neural joint radio resource management in a multi-cell scenario supporting a multiservice architecture (IEEE Piscataway, 2007), pp. 1–5
5. A Furuskar, J Zander, Multiservice allocation for multiaccess wireless systems. IEEE Trans. Wireless Commun.4, 174–184 (2005) 6. R Nasri, A Samhat, Z Altman, inProceedings of IEEE International
Symposium on a World of Wireless, Mobile and Multimedia Networks. A new approach of UMTS-WLAN load balancing; algorithm and its dynamic optimization (IEEE, 2007), pp. 1–6
7. A Pillekeit, F Derakhshan, E Jugl, A Mitschele-Thiel, inProceedings of IEEE 60th Vehicular Technology Conference (VTC), vol. 6. Force-based load balancing in co-located UMTS/GSM networks (IEEE Piscataway, 2004), pp. 4402–4406
8. S Horrich, S Ben Jamaa, P Godlewski, inProceedings of the Third International Conference on Wireless and Mobile Communications (ICWMC). Adaptive vertical mobility decision in heterogeneous networks (IEEE, 2007), p. 44
9. D Turina, A Furuskar, inProceedings of the 8th International Conference on Telecommunications (ConTEL), vol. 1. Traffic steering and service continuity in GSM-WCDMA seamless networks (IEEE Piscataway, 2005), pp. 77–82 10. NTK Jorgensen, D Laselva, J Wigard, inProceedings of IEEE 73rd Vehicular
Technology Conference (VTC). On the potentials of traffic steering techniques between HSDPA and LTE (IEEE Piscataway, 2011) 11. 3GPP. Evolved Universal Terrestrial Radio Access (E-UTRA) and Evolved
Universal Terrestrial Radio Access Network (E-UTRAN); Overall description; Stage 2, version 9.1.0 (2009-09). TS 36.300 (3GPP Valbonne , 2009) 12. I de la Bandera, S Luna-Ramírez, R Barco, F Ruiz, M Toril, M
Fernández-Navarro, inProceedings of the 5th International Conference on Broadband Communications and Biomedical Applications, IB2COM. Inter-system cell reselection parameter auto-tuning in a joint-RRM scenario (IEEE Piscataway, 2010), pp. 1–6
13. S Luna-Ramírez, M Toril, F Ruiz, M Fernández-Navarro, inProceedings of the 14th IEEE Mediterranean Electrotechnical Conference, MELECON.
Adjustment of a fuzzy logic controller for IS-HO parameters in a heterogeneous scenario (IEEE Piscataway, 2008), pp. 29–34
14. S Hamalainen, H Sanneck, C Sartori,LTE Self-Organising Networks (SON): Network Management Automation for Operational Efficiency. (Wiley, Hoboken, 2012)
15. 3GPP. Evolved Universal Terrestrial Radio Access (E-UTRA) User Equipment (UE) procedures in idle mode, version 10.3.0 (2011–09), TS 36.304 (3GPP Valbonne , 2011)
16. 3GPP. Evolved Universal Terrestrial Radio Access (E-UTRA) Radio Resource Control (RRC); Protocol specification, version 9.0.0 (2009–09), TS 36.331 (3GPP Valbonne, 2009)
17. 3GPP. Technical Specification Group Radio Access Network; Radio Resource Control (RRC); Protocol Specification, version V11.0.0 (2011-12). TS 25.331 (3GPP Valbonne, 2009)
18. M Halgamuge, H Vu, K Ramamohanarao, M Zukerman, A call quality performance measure for handoff algorithms. Int. J. Commun. Syst.24, 363–383 (2011)
19. I Viering, M Döttling, A Lobinger, inProceedings of International Conference on Communications (ICC ’09). A mathematical perspective of
Self-Optimizing Wireless Networks (IEEE Piscataway, 2009), pp. 1–6 20. 3GPP. Evolved Universal Terrestrial Radio Access (E-UTRA); Requirements
for support of radio resource management, version 9.1.0 (2009-09), TS 36.133 (3GPP Valbonne , 2009)
21. 3GPP. Requirements for support of radio resource management (FDD), version 11.3.0 (2012-12), TS 25.133 (3GPP Valbonne, 2012)
doi:10.1186/1687-1499-2013-133
Cite this article as:Muñozet al.:Adjustment of mobility parameters for traf-fic steering in multi-RAT multi-layer wireless networks.EURASIP Journal on Wireless Communications and Networking20132013:133.
Submit your manuscript to a
journal and benefi t from:
7Convenient online submission 7 Rigorous peer review
7Immediate publication on acceptance 7 Open access: articles freely available online 7High visibility within the fi eld
7 Retaining the copyright to your article