Crust and uppermost mantle structure beneath central Japan inferred from
receiver function analysis
Toshihiro Igarashi1, Takashi Iidaka1, Takaya Iwasaki1, Takuo Shibutani2, Tomotake Ueno2∗, and Japanese University Group
of the Joint Seismic Observation at the Niigata-Kobe Tectonic Zone
1Earthquake Research Institute, University of Tokyo, 1-1-1 Yayoi, Bunkyo-ku, Tokyo 113-0032, Japan 2Disaster Prevention Research Institute, Kyoto University, Gokasho, Uji, Kyoto 611-0011, Japan
(Received January 29, 2008; Revised June 23, 2009; Accepted August 6, 2009; Online published December 21, 2009)
We apply the receiver function method to estimate the structure of the crust and the uppermost mantle at an area that traverses central Japan including the Niigata-Kobe Tectonic Zone (NKTZ). The resultant receiver function images show clear seismic discontinuities, such as the subducting Philippine Sea plate, the Moho in the overriding plate, and other discontinuities inside the crust around the NKTZ. We also address station corrections for shallow structures using a synthetic receiver function. Crustal discontinuities seem to be complicated at the south side from the northern limit of the NKTZ. The dip of the discontinuities changes around the Atotsugawa active fault located in the NKTZ. The Moho discontinuity in the overriding plate is continuous and gradually dips to the south. The depths of the Moho discontinuity in the receiver function image exceed 40 km at the southern part of the profile line, and are 5–10 km deeper than that indicated by an explosion analysis of the same profile line. It seems that the differences between the estimated depths obtained by the two methods indicate complicated structures around the Moho discontinuity.
Key words:Crustal structure, the Niigata-Kobe Tectonic Zone, receiver function analysis.
1.
Introduction
Inland earthquakes occurring at active faults near ur-ban areas threaten our safety, even if their magnitudes are middle-sized. Predicting these earthquakes is important to mitigate future disasters. However, it is difficult to observe one cycle of active faults because their recurrence intervals are long, probably extending from several hundreds to sev-eral thousands of years. Thus, the mechanism is understood less than the mechanism of plate boundary earthquakes.
The Niigata-Kobe Tectonic Zone (NKTZ) is a high strain rate zone extending from Niigata to Kobe, which was re-cently identified from analyses using a spatially dense GPS network (e.g., Sagiyaet al., 2000) (Fig. 1). This suggests that the zone plays important roles in concentrating and accumulating strains in the land area of the Japanese Is-lands as well as other major tectonic lines. Many models have been proposed to explain the causes of the high strain rate at the NKTZ (e.g., Shimazaki and Zhao, 2000; Iioet al., 2002; Hyodo and Hirahara, 2003; Yamasaki and Seno, 2005). This zone is interpreted to be the inland plate bound-ary of the Japanese Islands (e.g., Heki and Miyazaki, 2001; Miyazaki and Heki, 2001) or an internal deformation zone forming the Japanese Islands (Mazzottiet al., 2000; Iioet al., 2002; Yamasaki and Seno, 2005). In spite of such dif-ferences of interpretation, most researchers think viscosity
∗Now at National Research Institute for Earth Science and Disaster
Prevention, 3-1 Tennodai, Tsukuba, Ibaraki 305-0006, Japan.
Copyright cThe Society of Geomagnetism and Earth, Planetary and Space Sci-ences (SGEPSS); The Seismological Society of Japan; The Volcanological Society of Japan; The Geodetic Society of Japan; The Japanese Society for Planetary Sci-ences; TERRAPUB.
heterogeneities located deeper than the seismogenic zone contribute to the high strain rates. Therefore, understanding the structure at the NKTZ is important to identify the mech-anism of strain accumulation in the Japanese inland area.
The Atotsugawa fault is a right-lateral strike-slip fault lo-cated in the NKTZ. This fault is one of the most active in Japan. Seismic activities along this fault are not uniformly distributed along the fault (e.g., Ito and Wada, 2002). They are active at the eastern and western part of the fault. On the other hand, the shallow part of the central area of the fault has low seismic activity. A M7 class earthquake also oc-curred along this fault in 1858. Furthermore, it is reported that creep-like movements of about 1.0 to 1.5 mm/yr were detected at the middle of the Atotsugawa fault (Geological Survey Institute, 1997). Katoet al.(2006, 2007) identified a large heterogeneous structure in the uppermost crust using the seismic tomography method and discussed the relation-ships between local crustal heterogeneity and seismic and geodetic activities. The heterogeneous structure and het-erogeneous distribution of seismicity are the keys to under-stand the stress and strain concentration process. This area is also important for identifying the generation mechanisms of inland earthquakes.
Geophysical joint observations, which include seismic, geodetic, and electromagnetic observations, at the NKTZ including the Atotsugawa fault have been conducted by the Japanese University Groups since 2004 (The Japanese Uni-versity Group of the Joint Seismic Observations at NKTZ, 2005). The purpose of seismic observations and research in this project is to understand seismicity and seismic struc-ture. The groups installed 73 seismic stations—63 stations
Fig. 1. Locations of seismic stations with a telemetry system in and around the Niigata-Kobe Tectonic Zone (NKTZ in the inset). The short-period and middle-period seismic stations deployed by the Japanese University Group of the Joint Seismic Observation are shown by blue squares and red circles, respectively. Telemetered short-period and broadband seis-mic stations, which were deployed by Earthquake Research Institute, University of Tokyo, National Research Institute for Earth Science and Disaster Prevention, and Japan Meteorological Agency, are shown by plus symbols and green circles, respectively. The Atotsugawa fault is indicated by a brown line. The research area is shown in the inset.
using a telemetry system and 10 stations using a portable recorder. The seismic stations are distributed within a 100-km rectangle that includes the Atotsugawa fault (Fig. 1).
In this study, we use the dense seismic stations and apply the receiver function method using teleseismic waveform data to determine the structure of the crust and the upper-most mantle at the NKTZ. Receiver functions calculated by the multiple-taper correlation method can resolve up to sev-eral Hz (e.g., Park and Levin, 2000). The receiver functions with the high frequency band image fine seismic structures with short wavelengths of several kilometers. Therefore, we investigate not only geometries of the subducting Philippine Sea plate and the Moho in the overriding plate discussed in previous studies (Yoshimotoet al., 2004; Shiomiet al., 2008) but also seismic discontinuities in the crust.
Other groups in the Joint Seismic Observations at the NKTZ are studying seismicity, seismic tomography (Nakajima and Hasegawa, 2007), source mechanism, re-flection and scattering studies, shear-wave splitting (Iidaka
et al., 2009), low-frequency earthquake, and attenuation structure using data obtained by this project. The results of these analyses will contribute greatly to reveal the mech-anisms of inland earthquakes.
Fig. 2. Hypocenter distribution used in this study. Colors change by hypocenter depth.
2.
Data and Method
Seismic stations with telemetry systems operated by the Japanese University Groups of the Joint Seismic Obser-vations, and Earthquake Research Institute, University of Tokyo (ERI), National Research Institute for Earth Science and Disaster Prevention (NIED), and Japan Meteorological Agency (JMA) are used. The time period of data at the networks of ERI, NIED, and JMA is from August 2002 to April 2007. Seismic data from the network operated by the Japanese University Groups of the Joint Seismic Observa-tions are used for the period from January 2005 to April 2007. At most of the seismic stations, short-period seismo-graphs (natural frequency is 1 Hz) are used. Middle-period seismometers (frequency band is 0.033 Hz to 50 Hz) and broadband seismometers (lower limit of frequency band is 0.01 Hz or less) are set up at several seismic stations, which are shown by red and green circles, respectively (Fig. 1). We used events with magnitudes larger or equal to 5.5 and epicentral distances between 30 and 90 degrees reported in the PDE or QED catalogue by the United States Geolog-ical Survey (USGS). Furthermore, we selected waveform records with a good signal-to-noise ratio around the direct
Pwave and its reverberation from events. The total number of events used in this study is 961 (Fig. 2).
Fig. 3. (a) An example of the observed (thick black line) and synthetic receiver function (thin gray line) of E.ASOI station located near the Toyama plain. Both traces are normalized by peak amplitudes of direct
Pwave. (b) Structure models from this synthetic trace and JMA2001 (Uenoet al., 2002) are also shown by solid lines and dashed lines, respectively. Thick and thin lines indicatePwave andSwave velocity, respectively.
tapers for the multiple-taper to be 2.5 and 3, respectively. Receiver function traces were converted from differential time to depth at each station after low-pass filtering with a squared cosine-taper with a cut-off frequency of 3 Hz. The observed dominant frequency of the traces is roughly 1– 1.5 Hz. We checked the similarities among different types of sensor at this frequency, although broadband seismome-ters are useful for analyzing at frequencies lower than 1 Hz. The traces are stacked at 20-degree bin in back-azimuth with moving windows overlapping at 10-degree intervals. The amplitude data of stacked-traces are projected at the cross-section of the averaged incident angle and direction. In the time-depth conversion process, the one-dimensional velocity model JMA2001 (Uenoet al., 2002; dashed line in Fig. 3(b)) was used.
3.
Station Correction for Depth Conversion
We applied station correction to compensate for the alti-tude of seismic stations and the effects of the low-velocity sediment layer beneath each station.
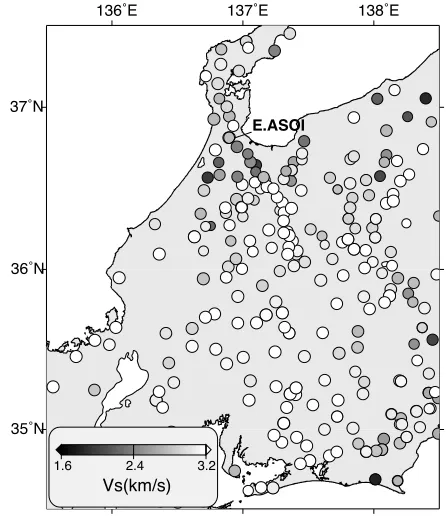
Fig. 4. AverageS-wave velocities from ground surface to a depth of 5 km used for station correction of receiver functions are shown by a gray scale.
To correct for the latter effect, we estimated simple ve-locity structures beneath each station presented by Igarashi (2009). First, we calculated many synthetic receiver func-tion traces using the reflectivity algorithm (Levin and Park, 1997) in advance. Multiple reflected phases are considered for this calculation. The structural models consist of four layers (three seismic discontinuities), representing sediment layer, upper crust, lower crust, and homogeneous mantle. Seismic velocities of the sediment layer gradually increase from the ground surface to the top of the crustal layer. Ve-locities in crustal layers are constant. P wave velocities in the top of the sediment layer and two crustal layers were set to 1.0–6.0 km/s, 5.0–7.0 km/s, and 6.0–7.5 km/s at 0.5 km/s intervals, respectively. The P wave velocity was fixed in the mantle at 8.0 km/s. Vp/Vs ratio assumed was to be
1.73. Boundary layers were changed at 1-km intervals. We considered positive velocity step, and adapted structures with an average P wave velocity of 6.0–7.0 km/s from the ground surface to a depth of 60 km. The epicentral distance for the calculation was assumed at 45 degrees, which is the average distance of events used in this study.
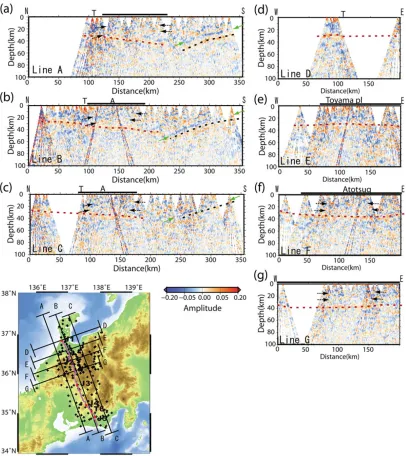
northwest-southeast lines, are shown (Fig. 5(d–f)). Positive and negative amplitudes of receiver functions indicate ve-locity increase and decrease downward, respectively. They are shown by red and blue colors in this study. We can de-tect many discontinuities from these cross-sections.
First, distinct overlying blue and underlying red lines that dip northwest are shown in the distance range of 230– 340 km and depths of 10–50 km (green arrows and black dashed lines in Fig. 5(a–c)). We interpret these to be the upper boundary of the subducting Philippine Sea plate and the oceanic Moho of the plate upon comparing them to the results of previous studies (e.g., Iidakaet al., 2003; Kodaira
et al., 2004). The layers are characterized by overlying low-velocity oceanic crust and high-low-velocity mantle.
Next, we estimated the Moho discontinuity in the over-riding plate. It is indicated from positive amplitude phases on stacked receiver function traces (red dashed lines in Fig. 5). The discontinuity is consistent with information of the crust-mantle boundary estimated from four-layered structure in Section 3 and the results of Zhaoet al.(1992). The discontinuity is continuous and undulating. The depth is estimated to be about 25 km at the northern part and about 43 km at the southern part of the profile lines.
We also detected several discontinuities in the crust. The boundaries appear at the south side from the northern limit of the NKTZ (black arrows in Fig. 5). There are continuous phases with depths of 13–20 km and 25–30 km. A shal-lower discontinuity is just beneath the seismogenic zone of crustal earthquakes. On the other hand, a deeper disconti-nuity, which seems to be located in the distance range from 100 km to 200 km with depths of 25–30 km at the cross-sections of Lines A and B (Figs. 5(a) and 5(b)), is clear. The boundary is shown by an orange color. The location is consistent with the area from the north end of the NKTZ
to the south end of the NKTZ. The boundary is not flat; rather, it is bent. Depth decreases from the north end of the NKTZ to the central part of the NKTZ where the Atot-sugawa fault is located. On the other hand, the depth is uniform from the Atotsugawa fault to the south end of the NKTZ. It seems to connect to the southern discontinuity above the Philippine Sea plate (Fig. 5(a)). Furthermore, we can see red and blue stripes dipping northwestward above the Philippine Sea plate (Fig. 5(a–c)).
The cross-section along the Atotsugawa fault is shown in Fig. 5(f). Many horizontal boundaries are found along the Atotsugawa fault. The boundaries are continuous within short distance ranges. The seismic structure in this area obtained by seismic tomography studies is heterogeneous (Kato et al., 2006, 2007). The area seems to have a het-erogeneous structure. We will reveal a fine structure from a comparison of seismic tomography and hypocenter distri-bution in further analyses.
5.
Discussion
Several studies propose the possibility that the NKTZ is a plate boundary (e.g., Heki and Miyazaki, 2001). However, we do not interpret the NKTZ to be the plate boundary. It seems to be an internal deformation zone because the continuous Moho and heterogeneous crust are found over the whole area. The high strain rate at the NKTZ might cause the concentration and accumulation of strain in these crustal structures—east-west compression.
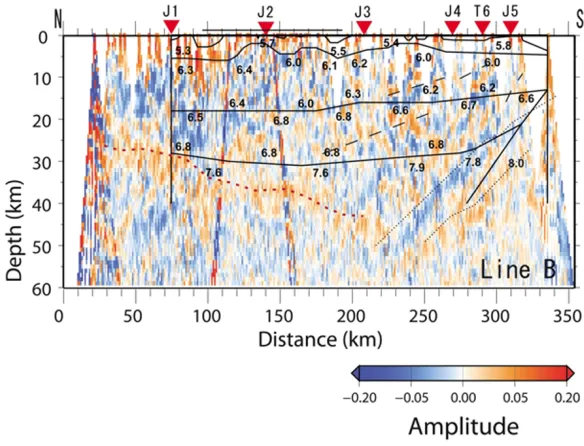
Iidakaet al.(2003, 2004) surveyed the crustal structure in the Tokai-Chubu region, central Japan, from an explosion analysis using controlled sources. Figure 5(b) is located along the survey line. We compared their seismic structures to the cross-section of receiver function traces (Fig. 6). The boundaries estimated from this study are substantially
westward, dipping with a dip angle of about 26 degrees from Iidakaet al.(2003, 2004) or about 17 degrees from Kodairaet al. (2004). The effects of depth errors of the receiver function on the dipping boundary were evaluated by Shiomiet al.(2004). The conversion depths were about 3 to 7 km shallower than that of the flat structure model at a depth range of 30 to 50 km in the case of these dip angles. However, the dipping angle, which we estimated from Fig. 5(b), is about 18 degrees, and our image of the plate boundary corresponds to that of Kodairaet al.(2004). The difference in the depth of the subducting Philippine Sea plate between our results and Kodairaet al.(2004) is about 2 km at maximum. It seems that differences in the relative locations and the dip angle of the boundary plane are small because the conversion points move southeastward at the same time. The conversion points of the Moho discontinu-ity in the overriding plate might be changed to the similar extent for this effect. However, the depth error is not so large.
Next, we calculated receiver functions from the one-dimensional velocity structure based on the structures of Iidakaet al.(2003, 2004) and converted the receiver func-tion traces to the depth secfunc-tion using the JMA2001 one-dimensional structure model. As a result, the maximum dif-ference between the two projections was about 2 km at the Moho discontinuity. The obtained Moho is deeper than that of the explosion analysis model. The depth error caused by the assumed velocity model is not sufficient to explain the observed discrepancy.
It seems that the differences between the depths esti-mated by the two methods indicate complicated structures around the Moho discontinuity. Our receiver function anal-ysis basically estimated S wave structures using Ps con-verted waves with a dominant frequency of about 1 Hz, while the explosion analysis uses reflected and/or refracted
Pwaves from controlled sources at the near ground surface with a dominant frequency of about 10 Hz. The used wave-length and its wave type differ from those of the receiver function analysis. The explosion analysis may be sensitive to the top portion of the Moho discontinuity. The disagree-ment regarding Moho depth is also explained by their sharp-ness. The existence of a weak positive phase corresponding to the Moho discontinuity from the explosion analysis is mainly obtained from the increase of the P wave velocity. It seems that the velocity discontinuities of theP wave are not in accord with those of theS wave. Further studies of the velocity transitions near the crust-mantle boundary will
The Moho discontinuity is found continuously at every cross-section. It dips gradually and is located at a depth of about 25 km at the northern part and about 43 km at the southern part of the profile lines. The depth is 5–10 km greater than that obtained by the explosion analysis. The re-sults of this study are important to understand the structure from the ground surface to the uppermost mantle beneath central Japan. The heterogeneous structures in the NKTZ will give us important constraints to identify the mecha-nisms of strain accumulation in the Japanese island area and the mechanisms of inland earthquakes.
Acknowledgments. We thank the National Research Institute for Earth Science and Disaster Prevention, and Japan Meteorological Agency for allowing us to use waveform data collected at each online station. We use unified hypocenter data from the JMA and hypocenter catalogues of USGS. Constructive comments by two anonymous reviewers have significantly improved the paper. Most of the figures were created using GMT (Wessel and Smith, 1995). This study was partly supported by a grant offered under the Earthquake Prediction Research program of the Ministry of Education, Culture, Sports, Science and Technology of Japan.
References
Ammon, C. J., The isolation of receiver effects from teleseismicP wave-forms,Bull. Seismol. Soc. Am.,81, 2504–2510, 1991.
Heki, K. and S. Miyazaki, Plate convergence and long-term crustal defor-mation,Geophys. Res. Lett.,28, 2313–2316, 2001.
Hyodo, M. and K. Hirahara, A viscoelastic model of interseismic strain concentration in Niigata-Kobe Tectonic Zone of central Japan,Earth Planets Space,55, 667–675, 2003.
Geological Survey Institute, Crustal movements in the Chubu and Hokuriku districts,Rep. Coord. Comm. Earthq. Predict. Jpn.,57, 520– 524, Tsukuba, 1997.
Igarashi, T., The seismic velocity discontinuities in the crust and the up-permost mantle beneath the Kanto district, central Japan, from receiver function imaging and repeating earthquakes activities,Gondwana Res., doi:10.1016/j.gr.2009.03.005, 2009.
Iidaka, T., T. Iwasaki, T. Takeda, T. Moriya, I. Kumakawa, E. Kurashimo, T. Kawamura, F. Yamazaki, K. Koike, and G. Aoki, Configuration of subducting Philippine Sea plate and crustal structure in the central Japan region,Geophys. Res. Lett.,30, doi:10.1029/2002GL016517, 2003. Iidaka, T., T. Takeda, E. Kurashimo, T. Kawamura, Y. Kaneda, and T.
Iwasaki, Configuration of subducting Philippine Sea plate and crustal structure in the central Japan region,Tectonophysics,388, 7–20, 2004. Iidaka, T., Y. Hiramatsu, and The Japanese University Group of the Joint
Seismic Observations at NKTZ, Shear-wave splitting analysis of the upper mantle at the Niigata-Kobe Tectonic Zone with the data of the Joint Seismic Observations at NKTZ,Earth Planets Space,61, 227– 235, 2009.
Iio, Y., T. Sagiya, Y. Kobayashi, and I. Shiozaki, Water-weakened lower crust and its role in the concentrated deformation in the Japanese Is-lands,Earth Planet. Sci. Lett.,203, 245–253, 2002.
of the fault, inSeismogenic Process Monitoring, edited by Ogasawara, H., Y. Yanagidani, and M. Ando, Balkema, pp. 229–243, Tokyo, 2002. Kato, A., E. Kurashimo, N. Hirata, T. Iwasaki, and T. Iidaka,
Imag-ing crustal structure around the western segment of the Atotsug-awa fault system, central Japan, Geophys. Res. Lett., 33, L09307, doi:10.1029/2006GL025841, 2006.
Kato, A., T. Iidaka, E. Kurashimo, S. Nakagawa, N. Hirata, and T. Iwasaki, Delineation of probable asperities on the Atotsugawa fault, central Japan, using a dense temporary seismic network,Geophys. Res. Lett., 34, L09318, doi:10.1029/2007GL029604, 2007.
Kodaira, S., T. Iidaka, A. Kato, J.-O. Park, T. Iwasaki, and Y. Kaneda, High pore pressure may cause silent slip in the Nankai Trough,Science,304, 1295–1298, 2004.
Langston, C. A., Structure under Mount Rainier, Washington, inferred from teleseismic body waves,J. Geophys. Res.,84, 4749–4762, 1979. Levin, V. and J. Park, P-SH conversions in a flat-layered medium with
anisotropy of albitrary orientation,Geophys. J. Int.,131, 253–266, 1997. Mazzotti, S., X. Le Pichon, and P. Henry, Full interseismic locking of the Nankai and Japan-west Kurile subduction zones: An analysis of uniform elastic strain accumulation in Japan constrained by permanent GPS,J. Geophys. Res.,105, 13,159–13,177, 2000.
Miyazaki, S. and K. Heki, Crustal velocity field of southwest Japan: Sub-duction and arc-arc collision,J. Geophys. Res.,106, 4305–4326, 2001. Nakajima, J. and A. Hasegawa, Deep crustal structure along the
Niigata-Kobe Tectonic Zone, Japan: Its origin and segmentation,Earth Planets Space,59, e5–e8, 2007.
Nishida, K., H. Kawakatsu, and K. Obara, Three-dimensional crustal S wave velocity structure in Japan using microseismic data recorded by Hi-net tiltmeters,J. Geophys. Res.,113, doi:10.1029/2007JB005395, 2008.
Park, J. and V. Levin, Receiver functions from multi-taper spectral analysis of high-frequency seismograms,Bull. Seismol. Soc. Am.,90, 1507– 1520, 2000.
Sagiya, T., S. Miyazaki, and T. Tada, Dislocation model for strain accu-mulation in a plate collision zone,Earth Planets Space,52, 1091–1094, 2000.
Senna, S., H. Fujiwara, S. Kawai, S. Aoi, T. Kunugi, T. Ishii, M. Hayakawa, N. Morikawa, R. Honda, K. Kobayashi, M. Oi, Y. Yasojima, and N. Okumura, A study on strong-motion maps for scenario earthquakes in Tonami plain fault zone,Tech. Note Nat. Res. Inst. for Earth Sci.
Disaster Prev., 263, 2005 (in Japanese).
Shimazaki, K. and Y. Zhao, Dislocation model for strain in a plate collision zone,Earth Planet. Sci. Lett.,52, 1091–1094, 2000.
Shiomi, K., H. Sato, K. Obara, and M. Ohtake, Configuration of subducting Philippine Sea plate beneath southwest Japan revealed from receiver function analysis based on the multivariate autoregressive model,J. Geophys. Res.,109, B04308, doi:10.1029/2003JB002774, 2004. Shiomi, K., M. Matsubara, Y. Ito, and K. Obara, Simple relationship
between seismic activity along Philippine Sea slab and geometry of oceanic Moho beneath southwest Japan,Geophys. J. Int.,173, 1018– 1029, 2008.
Sutou, H., Y. Kitaguchi, K. Yamamoto, and Y. Kono, Gravity anomaries and basement structures in southern part of the Noto peninsula,J. Seis-mol. Soc. Jpn.,56, 363–378, 2004 (in Japanese with English abstract). The Japanese University Group of the Joint Seismic Observations at
NKTZ, The Japanese University Joint Seismic Observations at the Niigata-Kobe Tectonic Zone,Bull. Earthq. Res. Inst.,80, 133–147, 2005 (in Japanese with English abstract).
Ueno, H., S. Hatakeyama, T. Aketagawa, J. Funasaki, and N. Hamada, Im-provement of hypocenter determination procedures in the Japan Mete-orological Agency,Q. J. Seismol.,65, 123–134, 2002 (in Japanese with English abstract).
Wessel, P. and W. H. F. Smith, New version of the Generic Mapping Tools Released,Eos Trans. AGU,76, 329, 1995.
Yamasaki, T. and T. Seno, High strain rate zone in central Honshu resulting from the velocity heterogeneities in the crust and mantle,Earth Planet. Sci. Lett.,232, 13–27, 2005.
Yoshimoto, K., H. Fujisawa, T. Okada, N. Umino, A. Hasegawa, K. Obara, K. Shiomi, H. Tsukahara, S. Okamoto, T. Kawanaka, H. Sato, T. Nishimura, H. Sato, and M. Ohtake, Moho and Philippine Sea plate structure beneath central Honshu Island, Japan, from teleseismic re-ceiver functions,Earth Planets Space,56, 1271–1277, 2004. Zhao, D., S. Horiuchi, and A. Hasegawa, Seismic velocity structure of the
crust beneath the Japan Islands,Tectonophysics,212, 289–301, 1992.