Gravity waves in the equatorial thermosphere and their relation to lower
atmospheric variability
Yasunobu Miyoshi1and Hitoshi Fujiwara2
1Department of Earth and Planetary Sciences, Faculty of Sciences, Kyushu University, 6-10-1, Hakozaki, Fukuoka, Japan 2Department of Geophysics, Faculty of Science, Tohoku University, Sendai, Japan
(Received September 27, 2007; Revised June 23, 2008; Accepted June 24, 2008; Online published May 14, 2009)
Using a general circulationmodel that contains the region fromthe ground surface to the upper thermosphere, we have examined characteristics of gravity waves in the equatorial thermosphere. At an altitude of 150 km, the dominant periods of gravity waves for zonal wave number 20 (zonal wavelengthλx ≈2000 km), 40 (λx
≈ 1000 km) and 80 (λx ≈500 km) are 3, 1.5 and 1 h, respectively. For individual zonal wave numbers,
the corresponding dominant period becomes shorter at higher altitudes due to dissipation processes in the thermosphere, such as molecular viscosity and ion drag force, indicating that gravity waves with a larger horizontal phase velocity (larger vertical wavelength) can penetrate into the thermosphere. The longitudinal variation of gravity wave activity in the equatorial thermosphere and upward propagation of gravity waves from
the lower atmosphere were also studied. The longitudinal distribution of gravity wave activity in the thermosphere is quite similar to that of gravity wave activity in the lower atmosphere and the cumulus convective activity in the tropical troposphere. Our results indicate that the strong energy flux due to gravity waves fromthe enhanced cumulus convective activity propagates upward into the upper thermosphere. The relation between the wind fluctuation associated with gravity waves and the ionospheric variation is discussed. Fluctuations of the neutral zonal wind with periods of 1–2 h are significant in the 200- to 300-kmheight region, and its amplitude sometimes exceeds 50 ms−1. These results suggest that upward propagating gravity waves can affect the ionospheric
variation in theF-region.
Key words:Gravity waves, equatorial thermosphere, upward propagation, wind fluctuation, ionospheric
varia-tion.
1.
Introduction
Gravity waves play an important role in the general cir-culation of the atmosphere in the stratosphere and m eso-sphere. Matsuno (1982) and Lindzen (1981) showed that the closing ofmesospheric jets and the reversal of the zonal wind direction in themesopause region weremaintained by the gravity wave drag. Radar observations have revealed the behavior of gravity waves in themesosphere and lower thermosphere (MLT). The vertical flux of zonalmomentum
due to gravity waves (uw) (u,wdenote the zonal and ver-tical wind fluctuation components, respectively) was found to be 1–5m2s−2 at a height of 80–90 kmover themiddle
latitudes and thatuwwas eastward (westward) in summer (winter) (Reid and Vincent, 1987; Vincent and Fritts, 1987; Tsudaet al., 1990).
Using the GFDL SKYHI general circulation models (GCMs) with horizontal resolutions of N90 (a grid spacing of 1.0◦latitude×1.2◦longitude) and N150 (0.6◦×0.72◦), Hayashiet al.(1989, 1997) and Joneset al.(1997) investi-gated the characteristics of gravity waves in the stratosphere and mesosphere and the global distribution of uw ( denotes the zonalmean) due to gravity waves. Satoet al.
Copyright cThe Society of Geomagnetismand Earth, Planetary and Space Sci-ences (SGEPSS); The Seismological Society of Japan; The Volcanological Society of Japan; The Geodetic Society of Japan; The Japanese Society for Planetary Sci-ences; TERRAPUB.
(1999) investigated the global distribution and characteris-tics of small vertical-scale gravity waves in the troposphere and lower stratosphere using a GCM with high resolution in both the horizontal and vertical directions. Thus, GCMs are quite useful tools for investigating characteristics of gravity waves and theirmomentumfluxes. However, the num eri-cal studies carried out to date using a GCM have focused on gravity waves in the height range fromthe troposphere to themesopause region. Using a GCM that contains the region fromthe ground surface to the upper thermosphere, Miyoshi and Fujiwara (2008; hereafter MF08) recently in-vestigated the characteristics of gravity waves in the
ther-mosphere and upward propagation of gravity waves from
the lower atmosphere to the thermosphere. MF08 showed that upward propagating gravity waves played an important role in the general circulation of the thermosphere.
Due to an insufficient number of global observations of the wind, the behavior of gravity waves is not well known in the thermosphere. In fact, gravity waves in the therm o-sphere are observed indirectly as fluctuations of the iono-spheric plasma (traveling ionospheric disturbance, TID). The horizontal scale of the observed TIDs ranges from
several hundred kilometers to several thousand kilometers. Most of TIDs at high latitudes are considered to be gener-ated by Joule heating, Lorentz force and/or auroral particle precipitation. In contrast, Waldock and Jones (1987) ray-tracedmost of the gravity waves back into the ground level
472 Y. MIYOSHI AND H. FUJIWARA: GRAVITY WAVES IN THE EQUATORIAL THERMOSPHERE
and showed a weak positive correlation between these grav-ity waves and tropospheric jet speed. Simultaneous wind
measurements that cover the region fromthe troposphere to the thermosphere are impossible, thereby limiting the amount of knowledge available on the upward propagation of gravity waves fromthe troposphere to the thermosphere. Vadas and Fritts (2004, 2006) and Horinouchiet al.(2002) investigated the upward propagation of gravity waves gen-erated by cumulus convection into the thermosphere using a regionalmodel. Vadas (2007) recently reported the results of her investigation of the dissipative filtering of upward propagating gravity waves with 10- to 2000-km horizon-tal wavelengths. However, to date, there have only been a few theoretical studies on the upward propagation of gravity waves into the thermosphere.
Using GPS/MET (meteorology) radio occultation, Hocke and Tsuda (2001) investigated the longitudinal distributions of gravity wave activity in the stratosphere and E-region plasma irregularities (80- to 120-kmheights). TheE-region plasma irregularities are probably generated by atmospheric waves of the neutral atmosphere through the ion-neutral coupling process. As such, they clearly demonstrated that the longitudinal distribution of plasma irregularities in the MLT region was similar to that of the water vapor pressure in the tropics, indicating the dynamical coupling between the troposphere and the MLT region through the upward propagation of gravity waves. However, the longitudinal distribution of gravity wave activity above the MLT region and its relation to plasma irregularities in the F-region are not known. Therefore, in our study, we used a GCM that contains the region fromthe ground surface to the upper thermosphere to investigate the behavior of gravity waves in the equatorial thermosphere and the upward propagation of gravity waves fromthe lower atmosphere to the upper thermosphere. We focused our attention on the longitudi-nal variation in gravity wave activity in the equatorial
ther-mosphere and its relation with the cumulus convection in the tropical troposphere. Asmentioned above, fluctuations of the wind due to gravity waves in the thermosphere in-fluence the variability of the ionospheric parameters (e.g., Hocke and Schlegel, 1996). Here, we discuss the wind fluc-tuation associated with gravity waves in the thermosphere and its relation to ionospheric variability. The descriptions of the GCM used in this study and the numerical sim ula-tion are presented in Secula-tion 2. The results and discussion are presented in Sections 3 and 4, respectively. A summary follows in Section 5.
2.
Descriptions of the GCM and Numerical
Sim-ulations
The GCM used in this study is an extension of themiddle atmosphere GCM developed at Kyushu University (Miya-haraet al., 1993; Miyoshi, 1999). Themodel is the same as the GCM used by MF08. The horizontal resolution is T85 (maximumhorizontal wave number=85), which cor-responds to a grid spacing of 1.4◦ latitude × 1.4◦ longi-tude, and the vertical resolution is 0.4 scale height above the tropopause. The GCM has 75 vertical levels and con-tains the region fromthe ground surface to the upper
ther-mosphere. It solves the full nonlinear equations of eastward
momentum, northward momentum and thermodynamics. The vertical velocity (ω) at a constant pressure level is cal-culated by solving the continuity equation, and the verti-cal wind velocity (w) is estimated from the vertical ve-locity (ω) at a constant pressure level. The GCM has a full set of the physical processes appropriate for investi-gating the troposphere, stratosphere,mesosphere and
ther-mosphere (Miyoshi, 2006; Miyoshi and Fujiwara, 2006). Amore detailed description of these physical processes is found in Miyoshi and Fujiwara (2003).
The GCM includes schemes for hydrology, a boundary layer, radiation, eddy diffusion andmoist convection. The distributions of water vapor and cloud are predicted in the GCM, and the cumulus parameterization by Kuo is used. Effects of the surface topography and land-sea contrast are also taken into account. Themonthlymean of zonally sym
-metric distribution of O3 is prescribed. The gravity wave
parameterization developed by McFarlane (1987) is used for orographic gravity waves, while the parameterization for non-orographic gravity waves is not included.
The continuity equation of themassmixing ratio for the
major species, N2, O2 and O, are solved taking into
ac-count the photodissociation of O2 and oxygen chemistry.
The concentrations of CO2 and NO are prescribed for
cal-culations of the infrared cooling. Schemes for the infrared cooling, absorption of solar extreme ultraviolet (EUV) and ultraviolet (UV) radiations are included in the GCM. The electron density global distribution producedmainly by so-lar radiation is represented by the Chiu’s empiricalmodel (Chiu, 1975). As well as electrons obtained by the Chiu’s
model, those produced by auroral particles are also taken into account (Fuller-Rowell and Evans, 1987), and the iono-spheric conductivity tensor is calculated assuming ion com -position at each time step. We also utilize the empirical
magnetic convection electric field. Although this GCM does not predict the global distributions of electrons and ions, effects of the ionosphere on the neutral atmosphere, such as the ion drag force, Joule heating and auroral pre-cipitation heating, are taken into account. Themolecular diffusions ofmomentumand heat are also introduced in the uppermesosphere and thermosphere.
Time variations of solar UV and EUV fluxes and
geo-magnetic activity are frequently observed, and these influ-ence the general circulation in themiddle and upper atm o-sphere. In order to exclude the effects of variations of solar EUV and UV fluxes and geomagnetic activity, the num eri-cal simulation is conducted under solar cycleminimumand geomagnetically quiet conditions. The solarF10.7cmflux is fixed at 70×10−22Wm−2Hz−1during the numerical sim
-ulation. The data are sampled at 10-min intervals from1 June to 14 June. Thus, gravity waves having wave periods longer than 20min are included in the analyzed data.
3.
Results
3.1 Zonal mean field and gravity waves in MF08
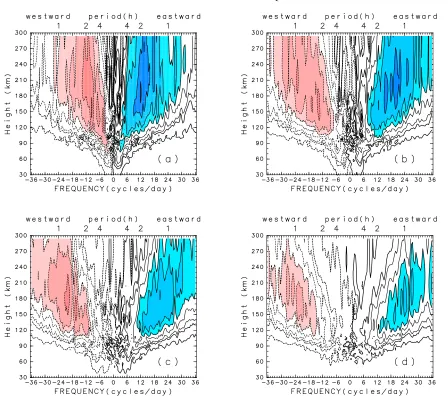
Fig. 1. (a) Frequency-height distribution of the cospectral density ofuw near the equator (0.4◦N) for zonal wave number 20 (s =20, the zonal wavelengthλx ≈2000 km) averaged over the period from1 June to 14 June. Values of contours are±0.01, 0.1, 0.2, 0.5, 1, 2, 5, 10, 20, 50×
10−2m2s−2day. Solid and broken lines indicate positive and negative values, respectively. Red colors (blue colors) show the region where values are less than−1 (larger than 1). (b) As in Fig. 1(a) except fors=40 (λx≈1000 km). (c) As in Fig. 1(a) except fors=60 (λx≈650 km). (d) As in
Fig. 1(a) except fors=80 (λx≈500 km).
field.
MF08 compared the simulated gravity waves in the stratosphere and mesosphere with the observations and showed that themagnitude of the vertical flux of zonalm
o-mentumdue to gravity waves in themesopause was similar to that obtained by the radar observations. The effect of gravity wave drag on the zonalmean zonal wind (the EP flux divergence) was also estimated in figure 2 of MF08. It was found that the contribution of the zonal wind acceler-ation associated with gravity waves to the zonalmeanm
o-mentumbalance was significant not only in themesosphere but also in the lower thermosphere.
3.2 Gravity waves in the thermosphere
A space-time Fourrier analysis by Hayashi (1971) was performed to investigate the frequency and zonal wave number distribution of gravity waves. Figure 1(a) presents the frequency-height distribution of the cospectral density ofuwnear the equator (0.4◦N) for zonal wave number 20 (s =20, the zonal wavelength λx ≈2000 km) averaged
over the period from1 June to 14 June. Positive (negative)
uwis dominant for eastward (westward)moving com
po-nents, indicating an upward energy propagation of gravity waves. The dominant periods of gravity waves at heights of 60, 100 and 150 kmare 8, 6 and 3 h, respectively, and gravity waves with periods of about 2 h are dominant above a height of 180 kmheight. Thus, the dominant periods of gravity waves decrease with height. For thes=20 com po-nents, the zonal phase velocities of gravity waves with peri-ods of 6, 3 and 2 h are 93, 185 and 278ms−1, respectively.
Thismeans that gravity waves with a zonal phase velocity of about 100ms−1 dissipate around a height of 120 km,
while gravity waves with a zonal phase velocity larger than 200ms−1can penetrate into the zone at a height of 200 km.
Figure 1(b–d) illustrates the frequency-height distribu-tions of the cospectral density of uw for s = 40 (λx ≈
1000 km), 60 (λx ≈650 km) and 80 (λx ≈500 km),
grav-474 Y. MIYOSHI AND H. FUJIWARA: GRAVITY WAVES IN THE EQUATORIAL THERMOSPHERE
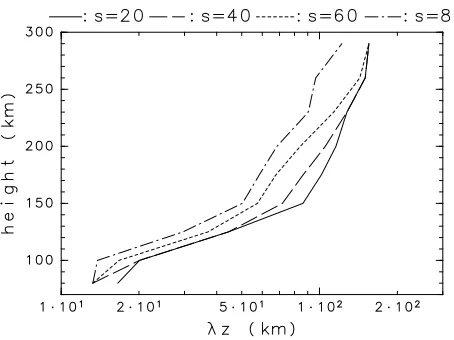
Fig. 2. Height distributions of the vertical wavelength of dominant gravity waves withs =20, 40, 60 and 80. Solid, broken, dotted and chain lines indicates the vertical wavelength withs =20, 40, 60 and 80, respectively. Units are in kilometers.
ity waves in the thermosphere from molecular viscosity and thermal diffusivity and showed dissipation altitudes of grav-ity waves with 10- to 1200-kmhorizontal wavelengths in the thermosphere. Figures 4 and 5 of Vadas (2007) clearly show that gravity waves with a zonal phase velocity smaller than 100ms−1dissipate around heights of 125 km, while gravity waves with larger zonal phase velocity can penetrate into the upper thermosphere. This result is consistent with the results of our present investigation.
Figure 2 shows the height distributions of the dominant vertical wavelength of gravity wave withs=20, 40, 60 and 80, respectively. The dominant vertical wavelength (λz) is
15–35 kmat a height of 100–120 kmand 50–80 kmat a height of 150 km. The dominantλzis about 100 kmaround
a height of 200 km. Thus, the dominantλzincreases
expo-nentially with height. For the individual heights, the cor-responding dominantλzdecreases (increases) with the
hor-izontal wave number (the horizontal wavelength). For ex-ample, the dominantλzat a height of 150 kmis 80, 60 and
50 kmfors =20 (λx ≈2000 km),s=60 (λx≈650 km)
ands=80 (λx≈500 km), respectively. Using radar
obser-vation, Djuthet al.(2004) and Oliveret al.(1997) estimated the dominant vertical wavelength of gravity waves. Fig-ure 10 of Oliveret al.(1997) shows an exponential increase inλzwith increasing height. Our results are in good
agree-ment with this observation, although Oliveret al.(1997) did not estimate the horizontal wavelength of the gravity wave. Vadas and Fritts (2005) derived the exact gravity wave anelastic dispersion relation in the presence of themost im -portant forms of dissipation in the thermosphere for high-frequency gravity waves, molecular dissipation and
ther-mal conductivity. They also showed that those gravity waves with a larger vertical wavelength and frequency dis-sipated at higher altitudes in the thermosphere because they were not as readily dissipated (partially because of their larger vertical group velocity) as those gravity waves with a smaller vertical wavelength and frequency. Vadas and Fritts (2006) and Vadas (2007) investigated the vertical propaga-tion of gravity waves into the thermosphere using the ray tracingmethod. They showed that the short-period,
long-vertical wavelength portions of gravity waves generated by convection could propagate into the thermosphere and that there was an exponential increase inλzwith height.
3.3 Longitudinal distribution of gravity wave activity
The longitudinal distribution of gravity wave activity in the equatorial thermosphere and upward propagation of gravity waves fromthe lower atmosphere to the upper
ther-mosphere were also investigated. The short-period gravity waves are dominant in the thermosphere, so that the wind and temperature components with a period varying from1 to 4 h can be extracted using a band-pass filter. Figure 3(a) presents the longitudinal distribution of the total (kinetic plus potential) energy associated with the short-period grav-ity waves near the equator (averaged over 10◦N to 10◦S) at a height of 300 kmduring the period from 1 June to 14 June. The significantmaximumof the total energy is lo-cated around 150–180◦E, and there is a faint enhancement of the energy around 10–40◦E. The positions and shapes of the peaks at a height of 200 km(Fig. 3(b)) are quite similar to those at 300 km. The longitudinal distribution of the total energy near the equator at a height of 100 kmis shown in Fig. 3(c). The peaks of the energy associated with the short-period gravity waves around 150–180◦E and 10–40◦E are found in the height range from100 to 300 km. In contrast, the peak of the total energy around 250–280◦E appears at a height of 100 km, but this peak becomes unclear in the 200-to 300-kmheight region.
Figure 3(d) shows the longitude-height section of the to-tal energy for the short-period gravity waves near the equa-tor. There are threemaxima of gravity wave energy in the
mesosphere: 10–30◦E, 120–150◦E and 260–290◦E. The en-ergy peak around 120–150◦E is two- to threefold larger than those at 10–30◦E and 260–290◦E. The maximumaround 120–150◦E moves eastward with increasing height, while themaxima around 10–30◦E and 260–290◦Emoves slightly westward with increasing height. However, the longitudi-nal variation in the energy due to the short-period gravity waves in the stratosphere andmesosphere are similar to that in the thermosphere. Figure 3(e) presents the longitudinal distribution of the rainfall rate averaged over 10◦N to 10◦S. The longitudinal distribution of the energy due to the short-period gravity waves in the stratosphere andmesosphere is closely related with the longitudinal location of the large rainfall rate near the equator. This correlation is explained by the fact that the gravity wave ismainly generated by
cu-mulus convection.
enhance-Fig. 3. (a) Longitudinal distribution of the total (kinetic plus potential) energy associated with the short-period gravity waves near the equator (averaged over 10◦N to 10◦S) at a height of 300 kmduring the period from1 June to 14 June; units are×10−8kgm2s−2. (b) As in Fig. 3(a) except for a height of 200 km; units are×10−7kgm2s−2. (c) As in Fig. 3(a) except for a height of 100 km; units are×10−4kgm2s−2. (d) Longitude-height section of the total (kinetic plus potential) energy as-sociated with the short-period gravity waves near the equator (averaged over 10◦N to 10◦S); values of contours are 4, 6, 8, 10, 20, 40, 60, 80, 100×10−3kgm2s−2. Lightly (darkly) shades are the regions where the energy>10×10−3(40×10−3). (e) Longitudinal distribution of the rainfall rate near the equator (averaged over 10◦N to 10◦S) during the period from1 June to 14 June; units aremillimeters per day.
ment of upward energy flux around 150◦E is also found in the stratosphere and mesosphere. Upward energy flux due to the short-period gravity waves in the stratosphere andmesosphere is significant over those regions where the cumulus convection is enhanced (10–30◦E, 90–180◦E and 260–290◦E). As mentioned above, the dominant vertical wavelength of the short-period gravity waves is 50 kmat a height of 150 kmand exceeds 100 kmabove a height of 200 km, indicating that the vertical group velocity associ-ated with the short-period gravity waves is very large. Thus, our results indicate that the strong energy flux due to grav-ity waves from the enhanced cumulus convective activity can penetrate into the upper thermosphere.
Using GPS/MET radio occultation, Hocke and Tsuda (2001) and Tsuda and Hocke (2004) investigated the lon-gitudinal distribution of plasma irregularity in the MLT re-gion (the E-region) and stratospheric gravity wave activity at low latitudes. These researchers found that themaxima of enhanced stratospheric gravity waves activity and plasma irregularity in the MLT region were located over the region where cumulus convective activity was enhanced. This re-sult is consistent with our rere-sult. However, our rere-sults show
Fig. 4. (a) Longitudinal distribution of vertical flux of energy for the short-period gravity waves (1–4 h) averaged over 14 days at a height of 300 km(1–14 June); units are×10−5kgm−1s−1. (b) As in Fig. 4(a), except for a height of 200 km. (c) As in Fig. 4(a), except for a height of 100 km. (d) Longitude-height section of vertical flux of energy for the short-period gravity waves (1–4 h); values of contours are 10, 20, 40, 60, 80, 100, 200, 400×10−5kgm−1s−1. Lightly (darkly) shades are the regions whereρφw>40×10−5(100×10−5).
that the longitudinal variation of the gravity wave energy in the upper thermosphere is also closely related to that of the convective activity and the stratospheric gravity wave activity.
4.
Discussion
4.1 Seasonal variations in gravity wave activity in the
thermosphere
We have shown that the short-period gravity waves were dominant in the thermosphere and that upward propagation fromthe lower atmosphere occurred. In particular, the lon-gitudinal variation in the gravity wave energy in the equa-torial thermosphere was correlated with that of the strato-spheric gravity wave energy and the convective activity in the tropical troposphere. The analysis carried out in the previous section was conducted during the period from 1 June to 14 June. To be able to determine seasonal varia-tion in gravity wave activity in the equatorial thermosphere, we also performed a preliminary analysis during the period from21 March to 31 March.
476 Y. MIYOSHI AND H. FUJIWARA: GRAVITY WAVES IN THE EQUATORIAL THERMOSPHERE
Fig. 5. (a) Longitudinal distribution of the total (kinetic pus potential) energy associated with the short-period gravity waves near the equator (10◦N–10◦S) at a height of 300 kmaveraged over the period from21 March to 31 March; units are×10−8 kgm2 s−2. (b) As in Fig. 5(a) except for a height of 200 km; units are×10−7kgm2s−2. (c) As in Fig. 5(a) except for a height of 60 km; units are×10−3kgm2s−2.
a height of 60 km except for the region around 0–30◦E. The energy peak around 0◦E does not appear at a height of 60 km. Another peak is located at 20–30◦E at a height of 60 km, and this peakmoves westward with height, cor-responding to the peak around 0◦E at heights of 200 and 300 km. The longitudinal variation in the total energy below a height of 60 kmis similar to that at a height of 60 km(not shown). Thus, the longitudinal variation in gravity wave activity in the thermosphere is affected by the variation in gravity wave activity in the lower atmosphere. The shapes and peaks of the gravity wave energy distribution in March are quite different fromthose in June. The longitudinal dis-tribution of themoist convection center in the tropical tro-posphere also varies with season. These results indicate that seasonal variation of gravity wave activity in the equato-rial thermosphere is influenced by seasonal variation of the gravity wave energy distribution in the lower atmosphere that is generated by seasonal variation of the longitudinal distribution of themoist convection activity in the tropical troposphere. We performed the analysis in June and March, but the analysis period (the 14-day dataset in June and the 10-day dataset in March) is too short to examine seasonal variations in gravity wave activity in the equatorial therm o-sphere. A 1-year dataset is desirable to study seasonal vari-ation.
In GCMs,moist convection is not resolved explicitly be-cause of its sparse horizontal resolution. In our study, Kuo’s cumulus parameterization was used; however, in other GCMs, various types of cumulus parameterizations, such as moist convective adjustment and Arakawa-Schubert’s scheme, were used. Horinouchiet al. (2003) investigated the effects of cumulus parameterization on the variability of
rainfall rate and simulated waves in the equatorialmiddle atmosphere. They showed that the choice of cumulus pa-rameterization had an impact on the vertically propagating waves in the equatorialmiddle atmosphere. Thus, a series of GCM experiments with other cumulus parameterizations
may be necessary.
4.2 Relation with ionospheric variability
In this subsection, we discuss fluctuations of the horizon-tal wind due to gravity waves and their relations with iono-spheric variability. One of themore significant phenomena in the equatorial ionosphere is the presence of plasma bub-bles. Plasma bubbles are generated in the bottomside of the
F-region after sunset through the Rayleigh-Taylor instabil-ity. One of the candidates for triggering the Rayleigh-Taylor instability is gravity waves in the equatorial thermosphere (e.g., Kellyet al., 1981; Linet al., 2005). Gravity waves can produce a sinusoidal oscillation of the altitude of the bottomside of the F-region (Singhet al., 1997). Ogawaet al.(2005) found wavy plasma structures (a few hundreds to 1000 kmacross) within the northern and southern equato-rial anomaly crest. Gravity waves are considered to play an important role in the seeding process of plasma bubbles.
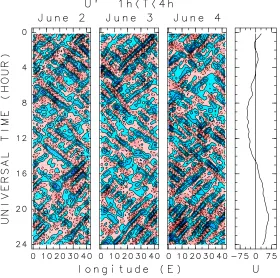
To demonstrate the zonal wind fluctuation due to the short-period gravity waves, in Fig. 6 we show longitude (0–45◦E)-time sections of the zonal wind fluctuation with a period of 1–4 h near the equator (0.4◦N) during 3 days (June 2–4) at a height of 250 km. The diurnal variation in the zonal wind at 0.4◦N and 0◦E averaged over the pe-riod from1 June to 14 June is also illustrated in the right panel of Fig. 6. Wavy structures with the zonal scale of a several hundred kilometers to 1000 are clearly seen. Fluc-tuations with periods of 1–2 h are significant, and the am -plitudes sometimes exceed 50 ms−1. Westward moving
waves are dominant during the night time when the back-ground zonal wind is eastward, although eastwardmoving waves are sometimes found after sunset. The amplitude of the fluctuations of the zonal wind has day-to-day variations. Namely, wave activity after sunset is stronger in 4 June than in 2 June. These results suggest that the short-period grav-ity waves in the neutral atmosphere induce the wavy plasma structures andmay induce the Rayleigh-Taylor instability. In the GCM used in the present study, however, the global distributions of electrons and ions are prescribed by using an empiricalmodel—and are therefore not predicted. As the electrons and ions are affected by the neutral gasmotion, we suggest that fluctuations associated with gravity waves influence the seeding process of plasma bubbles. In order to investigate the effects of gravity waves on the ionospheric variability in detail, a GCM that solves themomentumand energy equations of electrons and ions needs to be devel-oped. A new GCM will be able to predict the fluctuations of the ionosphere induced by the variations in the neutral atmosphere.
Fig. 6. Longitude (0–45◦E)-time sections of the zonal wind fluctuation with a period from1 to 4 h near the equator (0.4◦N) during 3 days (June 2–4) at a height of 250 km. Contour intervals are 25ms−1. Negative values (dotted lines) indicate a westward wind. Red (blue) colors show westward (eastward) wind components. The right panel shows the diurnal variation of the zonal wind at 0.4◦N and 0◦E averaged over the period from1 June to 14 June.
activity. We suggest that the longitudinal variation of the gravity wave activity in the thermosphere induces the lon-gitudinal variation of the ionosphere.
5.
Summary
Using a GCM that contains the region fromthe ground surface to the upper thermosphere, we have examined the behavior of gravity waves in the thermosphere. The hor-izontal resolution in the GCM was roughly equivalent to a grid spacing of 140 km. At a height of 100 km, the dominant periods of gravity waves for zonal wave num -ber 20 (λx ≈2000 km), 40 (λx ≈1000 km) and 80 (λx
≈500 km) are 6, 3 and 1.5–2 h, respectively. The dominant period (zonal phase velocity) of gravity waves decreases (increases) with height. Gravity waves with a zonal phase velocity of 100ms−1dissipate around a height of 120 km,
while gravity waves with a zonal phase velocity larger than 200ms−1can penetrate to a height of 200 km. The dom
i-nantλzis 15–35 km, 50–80 kmand about 100 kmat heights
of 100–120, 150 and 200 km, respectively. The dominant
λzincreases exponentially with height.
We examined the longitudinal distribution of gravity wave activity in the equatorial thermosphere and the upward propagation of gravity waves fromthe lower atmosphere. The longitudinal variation of gravity wave activity in the equatorial thermosphere is quite similar to that of the grav-ity wave activgrav-ity in the stratosphere andmesosphere and the convective activity in the tropical troposphere. Upward en-ergy flux due to the short-period gravity waves in the strato-sphere andmesosphere is significant over the regions where the cumulus convection is enhanced. Our results indicate
that the strong energy flux due to gravity waves fromthe enhanced cumulus convective activity can penetrate into the upper thermosphere.
We have also discussed fluctuations of the horizontal wind associated with gravity waves and its relation to the ionospheric variation. The short-period gravity waves that are generated in the lower atmosphere and propagate into the thermosphere induce wavy structures of the zonal wind in the upper thermosphere. Fluctuations due to the short-period gravity waves with short-periods of 1–2 h are significant, and its amplitudes sometimes exceed 50ms−1. These
re-sults suggest that gravity waves in the neutral atmosphere can produce the wavy plasma structures and may induce plasma bubbles. However, in the GCM used in our investi-gation, the global distributions of electrons and ions are pre-scribed using an empiricalmodel—and are not predicted. In order to investigate the effects of gravity waves on the iono-spheric variability in detail, it will be necessary to develop a GCM that solves themomentumand energy equations of electrons and ions. A new GCM will be able to predict the fluctuations of the ionosphere induced by the neutral atm o-spheric variation.
Acknowledgments. We are grateful to the reviewers for their
478 Y. MIYOSHI AND H. FUJIWARA: GRAVITY WAVES IN THE EQUATORIAL THERMOSPHERE
References
Chiu, Y. T., An improved phenomenologicalmodel of ionospheric density,
J. Atmos. Terr. Phys.,37, 1563–1570, 1975.
Djuth, F. T., M. P. Sulzer, S. A. Gonzales, J. D. Mathews, J. H. Elder, and R. L. Walterscheid, A continuumof gravity waves in the Arecibo therm o-sphere?,Geophys. Res. Lett.,31, L16801, doi:10.1029/2003GL019376, 2004.
Fuller-Rowell, T. J. and D. S. Evans, Height-integrated Pedersen and Hall conductivity patterns inferred fromthe TIROS-NOAA satellite data,J. Geophys. Res.,92, 7606–7618, 1987.
Hayashi, Y., A generalizedmethod of resolving disturbances into progres-sive and retrogresprogres-sive waves by space Fourier and time cross-spectral analyses,J. Meteor. Soc. Jpn.,49, 125–128, 1971.
Hayashi, Y., D. G. Golder, J. D. Mahlman, and S. Miyahara, The effect of horizontal resolution on gravity waves simulated by the GFDL SKYHI general circulationmodel,PAGEOPH,130, 421–443, 1989.
Hayashi, Y., D. G. Gloder, and P. W. Jones, Tropical gravity waves and super clusters simulated by high-horizontal resolution SKYHI general circulationmodel,J. Meteor. Soc. Jpn.,75, 1125–1139, 1997. Hocke, K. and K. Schlegel, A review of atmospheric gravity waves and
traveling ionospheric disturbances:1982–1995,Ann. Geophys.,14, 917– 940, 1996.
Hocke, K. and T. Tsuda, Gravity waves and ionospheric irregularities over tropical convection zones observed by GPS/MET radio occultation,
Geophys. Res. Lett.,28, 2815–2818, 2001.
Horinouchi, T., T. Nakamura, and J. Kosaka, Convectively generated
mesoscale gravity waves simulated throughout themiddle atmosphere,
Geophys. Res. Lett.,29(21), 2007, doi:10.1029/2002GL016069, 2002. Horinouchi, T., S. Pawson, K. Shibata, U. Langematz, E. Manzin, M. A.
Giorgetta, F. Sassi, R. J. Wilson, K. Hamilton, J. Grandpre, and A. A. Scaife, Tropical cumulus convection and upward-propagating waves in
middle-atmosphere GCMs,J. Atmos. Sci.,60, 2765–2782, 2003. Jones, P. W., K. Hamilton, and R. J. Wilson, A very high resolution general
circulationmodel simulation of the global circulation in austral winter,
J. Atmos. Sci.,54, 1107–1116, 1997.
Kelly, M. C., M. F. Larsen, C. M. Swenson, and T. F. Wheeler, Gravity wave initiation of equatorial spreadF: A case study,J. Geophys. Res., 86, 9087–9100, 1981.
Lin, C. S., T. J. Immel, H. C. Yeh, S. B. Mende, and J. L. Burch,
Si-multaneous observations of equatorial plasma depletion by IMAGE and ROCSAT-1 satellites, J. Geophys. Res., 110, A06304, doi:10. 1029/2004JA010774, 2005.
Lindzen, R. S., Turbulence and stress owing to gravity wave and tidal breakdown,J. Geophys. Res.,86, 9707–9714, 1981.
Matsuno, T., A quasi one-dimensionalmodel of themiddle atmosphere circulation interacting with internal gravity waves,J. Meteor. Soc. Jpn., 60, 215–226, 1982.
McFarlane, N. A., The effect of orographically excited gravity wave drag on the general circulation of the lower stratosphere and troposphere,J. Atmos. Sci.,44, 1775–1800, 1987.
Miyahara, S., Y. Yoshida, and Y. Miyoshi, Dynamic coupling between the lower and upper atmosphere by tides and gravity waves,J. Atmos. Terr. Phys.,55, 1039–1053, 1993.
Miyoshi, Y., Numerical simulation of the 5-day and 16-day waves in the
mesopause region,Earth Planets Space,51, 763–772, 1999.
Miyoshi, Y., Temporal variation of nonmigrating diurnal tide and its rela-tion with themoist convective activity,Geophys. Res. Lett.,33, L11815, doi:10.1029/2006GL026072, 2006.
Miyoshi, Y. and H. Fujiwara, Day-to-day variations ofmigrating diurnal tide simulated by a GCM from the ground surface to the exobase,
Geophys. Res. Lett.,30, 1789, doi:10.1029/2003GL017695, 2003. Miyoshi, Y. and H. Fujiwara, Excitationmechanismof intraseasonal
oscil-lation in the equatorialmesosphere and lower thermosphere,J. Geophys. Res.,111, D14108, doi:10.1029/2005JD006993, 2006.
Miyoshi, Y. and H. Fujiwara, Gravity waves in the thermosphere sim u-lated by a general circulationmodel,J. Geophys. Res.,113, D01101, doi:10.1029/2007JD008874, 2008.
Ogawa, T., E. Sagawa, Y. Otsuka, K. Shiokawa, T. J. Immel, S. B. Mende, and P. Wilkinson, Simultaneous ground- and satellite-based airglow observations of geomagnetic conjugate plasma bubbles in the equatorial anomaly,Earth Planets Space,57, 385–392, 2005.
Oliver, W. L., Y. Otsuka, M. Sato, T. Takami, and S. Fukao, A clim atol-ogy of F region gravity waves propagation over themiddle and upper atmosphere radar,J. Geophys. Res.,102, 14499–14512, 1997. Reid, I. M. and R. A. Vincent, Measurements ofmesospheric gravity wave
momentumfluxes andmean flow accelerations at Adelaide, Australia,
J. Atmos. Terr. Phys.,49, 443–460, 1987.
Sato, K., T. Kumakura, and M. Takahashi, Gravity waves appearing in a high-resolution GCM simulation,J. Atmos. Sci.,56, 1005–1018, 1999. Singh, S., F. S. Johnson, and R. A. Power, Gravity wave seeding of
equa-torial plasama bubbles,J. Geophys. Res.,102, 7399–7410, 1997. Tsuda, T. and K. Hocke, Application of GPS radio occultation data for
studies of atmospheric waves in themiddle atmosphere and ionosphere,
J. Meteor. Soc. Jpn.,82, 419–426, 2004.
Tsuda, T., Y. Murayama, M. Yamamoto, S. Kato, and S. Fukao, Seasonal variation ofmomentumflux in themesosphere observed with the MU radar,Geophys. Res. Lett.,17, 725–728, 1990.
Vadas, S. L., Horizontal and vertical propagation and dissipation of gravity waves in the thermosphere fromlower atmospheric and thermospheric sources,J. Geophys. Res.,112, A06305, doi:10.1029/20056JA011845, 2007.
Vadas, S. L. and D. C. Fritts, Thermospheric responses to gravity waves arising from mesoscale convective complexes, J. Atmos. Sol.-Terr. Phys.,66, 781–804, 2004.
Vadas, S. L. and D. C. Fritts, Thermospheric responses to gravity waves: Influences of increasing viscosity and thermal diffusivity,J. Geophys. Res.,110, D15103, doi:10.1029/2004JD005574, 2005.
Vadas, S. L. and D. C. Fritts, Influences of solar variability on gravity wave structure and dissipation in the thermosphere fromtropospheric convec-tion,J. Geophys. Res.,111, A10S12, doi:10.1029/2005JA011510, 2006. Vincent, R. A. and D. C. Fritts, A climatology of gravity wavemotions in themesopause region at Adelaide, Australia,J. Atmos. Sci.,44, 748– 760, 1987.
Waldock, P. J. and T. B. Jones, Source regions ofmedium-scale traveling disturbances observed atmid-latitudes,J. Atmos. Terr. Phys.,49, 105– 114, 1987.