39 | P a g e
Microarray Informatics Approach Used In Identification of
Potential Drug Targets for Prostate Cancer
Shilpa Shiragannavar
1, Shivkumar B Madagi
21,2
Department of Bioinformatics, Akkamahadevi Women’s University Vijayapura (India)
ABSTRACT
The present work was carried out to find out the novel drug target in Prostate Cancer using DNA microarrays. The
Microarray data analysis helps to get the gene expression profiles of Prostate Cancer. In the experiment,
microarray dataset of GSE29079 i.e. the gene expression profiles of 48 normal and 47 prostate tumor tissue
samples in human were extracted from database. For pre-processing data normalization was performed using the
Reliability, Maintainability, and Availability (RMA) algorithm in the R (v-3.2.3) package of the Bioconductor. The
normalized data was further processed by MeV(Muliple expression Viewer) for gene ontology and gene set
enrichment analysis. Followed by Cytoscape, an open source bioinformatics platform which is used to study the
molecular interaction networks and also visualizing of biological pathways. The current study was focused on
obtaining a drug target for the cancer. The study reveals that DEGs obtained by the pathway analyses and
molecular interaction networks filtered the genes that had principle pathways targeting Prostate Cancer.
Keywords: Prostate Cancer, Microarray
I. INTRODUCTION
In DNA gene expression microarrays, thousands of gene expression levels are measured simultaneously. Microarray
data may provide insight into gene to gene interactions, gene function, and pathway identification. The identification
of differentially expressed genes is to find genes whose expression changes in response to different biological
conditions [1]. To identify genes potentially important in cancer, scientists have compared the global gene
expression profiles of cancer tissue and corresponding normal tissue. Such analyses usually generate hundreds of
genes differentially expressed in cancer relative to normal tissue, making it difficult to distinguish the genes that
play a critical role in the neoplastic phenotype from those that are spuriously differentially expressed [2]. Prostate
cancer is the most common cancer in men apart from skin cancer. The incidence of Prostate cancer has shown
significant variation across the globe. Though the prevalence and characteristics of this disease have been
extensively studied in many countries, data regarding the true incidence of Prostate cancer in India is limited [3].
Biological data analysis with advance computing technologies such as in computational biology approach provides
diverse platforms to analyze the biomedical data for predicting differential expression level of genes in various
40 | P a g e
organism under different conditions within a single experimental setup. The analysis of such data is performed usingBioconductor in R environment, which as a matter of fact has become the standard in the field of biomarker
discovery and target identification for the effective treatment. With the emergence of microarray technology, gene
expression can be measured on a genome-wide scale in cancer research by supplying tools and techniques to identify
187 significant differences in diseases[4]. This technology utilizes differential gene expression patterns in diseased
and normal cells of various subtypes of cancer to identify the genes that are over-expressed and under-expressed[5].
However, this analysis produces a large amount of data, which is challenging to interpret. With the employment of
modern computational and statistical analysis packages in Bioconductor and other bioinformatics tools, the data
analysis has been greatly flexible in the recent years based on diverse experiments. The microarray technology has
been applied to a range of applications, including discovering novel disease subtypes, developing new diagnostic
tools, and identifying underlying mechanisms of disease or drug response[6]. We successfully identify potential
drug targets which are strongly related to the well known drugs for prostate cancer treatment and also discover more
potential drug targets which raise the attention to biologists at present. We denote that it is hard to discover drug
targets based only on differential expression changes due to the fact that those genes used to be drug targets may not
always have significant expression changes [7]. The set of expressed microRNAs in a given cell type, or
“miRNome”, can be explored under many different aspects. Many studies report modulations of the miRNome in a
wide variety of cancers. Papillary thyroid cancer is the most prevalent type of endocrine cancer [8]. The datasets
were downloaded in.CEL format and were analyzed on R environment (3.2.3). Most of the functionality in R is in
the well-established extension packages. Most of the MA analysis packages can be found on Bioconductor
(https://www.bioconductor.or g/) it is the largest growing platform for the biological data analysis and
comprehension of high-throughput genomic data. R statistical programming language supports most of all the
Bioconductor packages and is open source for its development [9]. Only genes meeting the selection criteria of
adjusted P value <.05 were considered DEGs[10]. MultiExperiment Viewer (MeV) is a Java-based desktop
application that allows advanced analysis of gene expression data through an intuitive graphical user interface[11].
Cytoscape is an open source software project for integrating biomolecular interaction networks with high-throughput
expression data and other molecular states into a unified conceptual framework. Although applicable to any system
of molecular components and interactions, Cytoscape is most powerful when used in conjunction with large
databases of protein-protein, protein-DNA, and genetic interactions that are increasingly available for humans and
model organisms[12].
II METHODOLOGY
The objective of the research was to identify novel targets and ligands for Prostate cancer through Microarray data
analysis and structure based virtual screening.
41 | P a g e
2.1
Analysis of Microarray Data
1.1 Data collection from Gene Expression Omnibus(GEO-NCBI)
1.2 Normalisation in R(Bioconductor Package)
1.3 Statistical tests(T-test) using Multi Expression Viewer(MeV)
2. Target identification and Virtual Screening of compound library for finding good ligand
2.1 Building a network in cytoscape
2.2 Finding a good lead by screening library of compounds (Lipinki’s screening) Various online, offline tools
s
Figure1. Schematic diagram of the flow chart for drug target identification and ligand binding, docking studies of
target and ligands
Analysis of Microarray Data
Collection of gene expression profiles investigated in 48 normal and 47 prostate tumor tissue from NCBI-GEO database
Normalization of raw microarray data in R(Bioconductor Pacakage) Results are observed on Box Plot
Checking of normalized data for Statistical t-test using Multi Expression Viewer (MeV) results can be vieved as heat maps
Building a network in cytoscape and obataining good target based on gene annotations and network of interactions
Best ligand selected
potential drug targrt
Docking studies
Virtual screening by Lipinski’s rule of 5
42 | P a g e
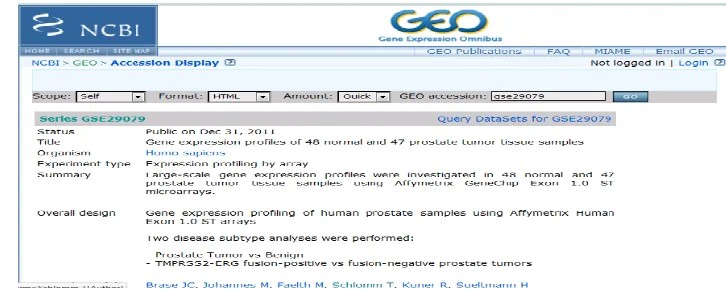
1.1-Data collection from Gene Expression Omnibus (NCBI-GEO) - GSE29079
The gene expression datasets were downloaded from NCBI’s GEO database. The dataset GSE29079 downloaded
consisted of samples taken from normal cells and cancer patients. The data consists large-scale gene expression
profiles investigated in 48 normal and 47 prostate tumor tissue samples using Affymetrix GeneChip Exon 1.0 ST
microarrays[8]. The datasets were downloaded in .cell format and were analyzed on R environment.
1
.2-Normalization of raw microarray data in R(Bioconductor Pacakage)
Most of the Microarray analysis packages can be found on Bioconductor it is the largest growing platform for the
biological data analysis and comprehension of high-throughput genomic data. To check the quality and detect the
outlier within the samples in the dataset, diagnostic plots such as box plots were plotted. These plots give a quick
view of the normalized log2 intensities[9]. In the current work, the data normalization was performed using
Reliability, Maintainability, and Availability (RMA). RMA, consist of several steps: background correction,
normalization of probes, and summarization where individual probes are combined into a probe set. RMA is useful
for highly precise estimates of expression. To identify the differentially expressed genes DEGs in normal and cancer
cell lines an adjusted P-Value ≤ 0.05 was used as cut-off criteria [10].
1.3-Checking of normalized data for Statistical t-test using Multi Expression Viewer (MeV)
-MeV is a desktop application for the analysis, visualization and data-mining of large-scale genomic data. It is a
versatile microarray tool, incorporating sophisticated algorithms for clustering, visualization, classification,
statistical analysis and biological theme discovery [11]. A huge array of alrogithms are included in MeV modules,
and are available at a button-click, such as K-means clustering, Hierarchical clustering, t-Tests, Significance
Analysis of Microarrays, Gene Set Enrichment Analysis, and EASE. It generates information of gene expressions
and annotation data from single or multiple experiments.
2.2. Lead and Target identification
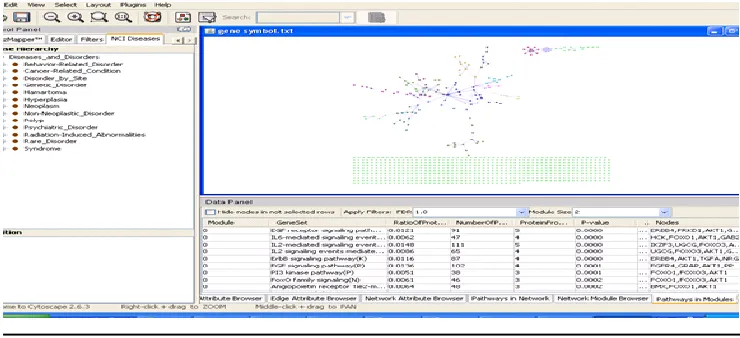
2.1- Network building with cytoscape
Cytoscape is a open source bioinformatics software platform forviewing networks of molecular interaction and
biological pathways and integrating these networks with annotations, gene expression profiles and other state data.
The coexpression network of these DEGs was then visualized using Cytoscape (version 3.2.0, U.S. National
Institute of General Medical Sciences, http://cytoscape.org/), an open source software for integrating biomolecular
interaction networks. In the network, a “node” represents a gene or protein, and a “line “represents an interaction
between 2 nodes. The degree of each node equals the number of nodes that interact with it [12]. Cytoscape is a
general platform for complex network analysis and visualization. Genes were studied for the uniqueness in the
43 | P a g e
2.2 Building a compound library and Finding a good lead by screening library of compounds, Virtual
screening to determine best leads(ligand) to target:
A compound library was made which had around 200 anti-cancerous compounds and 3D structure was downloaded
from Pubchem, and Chemspider as SDF or Mol files. The target selected for Prostate Cancer in the study was
GAPDH [Glyceraldehyde 3-Phosphate Dehydrogenase] based on annotations from cytoscape network.
Virtual screening was done to determine the best lead which binds at appropriate sites with target. Virtual screening
is a computational technique used in drug discovery research. With computers, it quickly searches a large libraries of
chemical structures to identify the structures which are most likely to bind to a drug target, typically a protein
receptor or enzyme. The aim of virtual screening is to identify molecules of novel chemical structure that bind to the
macromolecular target of interest [13]. Lipinski’s screening based on Lipinski’s rule of 5 for 200 anti-cancerous
compounds was done the obtained scores like Molecular Weight. H-Bond Donor, H-Bond Acceptor, XLogP were
screened for further analysis. The molecular weight of the compound selected should be less than 500g/mol, H-bond
donor should be less than H-acceptor should be less than 10, & Xlog P should not be more than 5[14].
These screened leads were used for Auto Docking. Using AutoDock Vina all compounds were docked one by one
with the target and grid box with particular dimensions was set by preparing conf.txt file. Select the ligand and
torsions and save the file as .pdbqt files. According to the existing drug dock score for the disease, the best dock
scores were selected. Docking scores for each ligand were noted. And based on the existing drug docks scores, the
best dock scores were selected[15]. The online tool preADME was used to study ADMET properties and toxicity of
selected compounds[16]. Results of all tools are attached in results section. The structures of the leads are included in
the results section.
III RESULTS AND DISCUSSION
The current work describes a microarray approach for identification of a suitable drug target. The data from prostate
cancer was collected from NCBI-GEO.the following figure gives an idea of microarray data collection.
Figure 2. Retrival of dataset of gene expression profiles of normal and prostate cancer tissue cells from
44 | P a g e
The quality control analysis involves the assessment of the data and detection of the outliers. In the work, thenormalization of the data was performed using Reliability, Maintainability, and Availability (RMA). The typical
preprocessing method, RMA consist of several stepswhich were performed serially- background correction,
normalization of probes and summarization where individual probes are combined into a probe set. The boxplot of
the raw data represents the distribution of log2 intensities across all the samples. The boxplot of normalized signal
intensities across all samples was carried out and the fig shows the normalized data.
Figure 3. The boxplot showing the summarized log2 intensities on the y-axis and the distribution of 2 Normal
cells and 3 Prostate cancer/ tumor cell line samples for the raw data.
The DEGs were identified by MeV the package was used to build the model matrix with defined contrasts and an
adjusted false discovery rate to analyze the gene. Expression analysis profiles of normal and Prostate cancer dataset
led to identification of DEGs, that were found to be differentially expressed with an adjusted an P ≤ 0.05 based on t-test on the normalized resultant data.
45 | P a g e
The clustering and pathway enrichment of DEGs The functional classification of the obtained DEGs wasperformed with the online biological classification Cytoscape. After performing Mev analyzing the network of
pathways in Cytoscape Glyceraldehyde 3-phosphate dehydrogenase (GAPDH) is the target as selected. Molecular
Docking of the Proteins. The current study was further reinforced by performing comparative docking studies of
the novel proteins with the ligands from ligand library. The molecular docking study was performed on protein
target name and a set of 10 chemical compounds retrieved from pubchem database using both Autodock vina. For
creation of gpf, grid parameter file and dpf, docking parameter file using Autodock, the polar hydrogen atoms,
Kollman charges parameters were set. For ligand the preparation before docking were done like detecting and
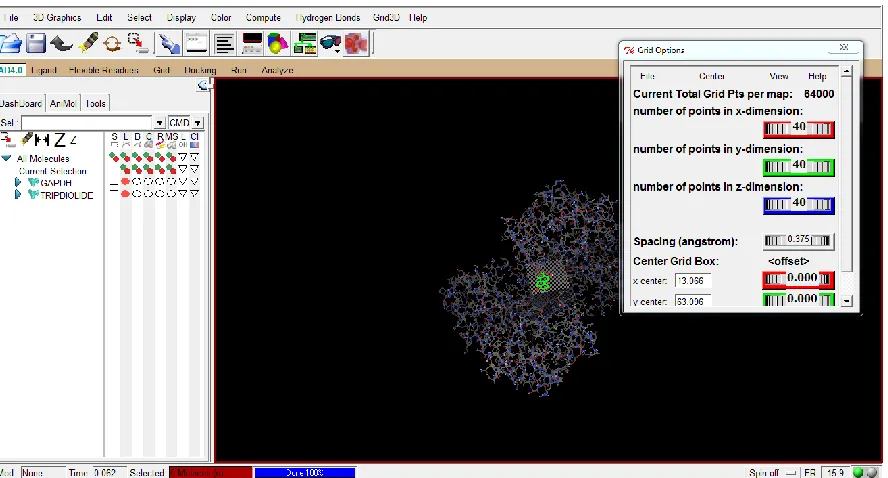
choosing tortion tree.Grid setting plays an important role in docking because here one can decide the XYZ
coordinates of the amino acids in the target for ligand binding. Binding affinities from docking were compared
between target protein and against the corresponding chemical compound are tabulated in the table 1. Top docking
pose, consider the binding energy (lowest) E-total,and the affinity interactions with active site of the protein. Since
the E-total of the compound Id CID 294491 is -0.01, i.eTripdiolide with molecular weight 376.405 g/mol was the
effective ligand obtained. The grid box was set with X-centre : 13.066, Y-centre : 63.096 , and Z-centre : 16.472
as shown in the figure 5 below. The lead obtained is suitable to bind to the target GAPDH in order to prevent the
prostate cancer.
Figure 5. Grid box setting for target and ligand to prepare protein and place it in a fixed position for the
46 | P a g e
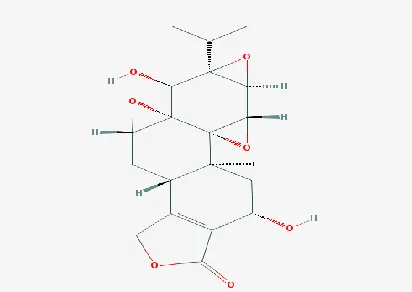
Table 1: The affinity and binding energy scores obtained for the selected 10 ligands for docking with the target.Figure 6. Structure of tripdiolide with Pubchem ID CID 294491
Number of studies state the role of GAPDH in Prostate cancer. Glyceraldehyde-3-phosphate dehydrogenase
enhances transcriptional activity of androgen receptor in prostate cancer cells [17]. Studies have reported that the
tripdiolide provides a method of effecting immunosuppression, and a method of inducing apoptosis in a cell, which
is useful in antiproliferative therapy, especially anticancer therapy [18].
IV CONCLUSION
Generally, microarrays have expression levels for several thousand genes, and it is required to filter out those that
are not significant. It is an important step before any further processing, such as clustering, to identify genes that
are differentially expressed. The work focused on finding the best gene target, which can give better prediction
Compound id Affinity E-total
cid_294491 -10.3 -0.01
cid_5351344 -10.2 -0.04
cid_83843 -10.2 -345.28
cid_105111 -10.2 -221.65
cid_ 54678486 -9.0 -552.60
cid_4042 -8.3 -21.49
cid_8530 -7.9 -306.81
cid_9064 -7.2 -262.81
cid_382831 -6.9 -306.81
47 | P a g e
accuracy for Prostate cancer. The best target as selected based on its role of cancer development was GAPDH i.eGlyceraldehyde 3-phosphate dehydrogenase. Finally, the work provides the best lead to the target by performing
Virtual Screening of the natural anti cancer compounds.
Glyceraldehyde 3-phosphate dehydrogenase (GAPDH) is the target as obtained after performing Mev and
Cytoscape. Tripdiolide with molecular weight 376.400g/mol which is suitable to bind to the target GAPDH in order
to prevent the prostate cancer. The present study has thus led to the identification of protein that can be targeted for
effective drug design and vaccine development against prostate cancer.
REFERENCES
[1.] Marton, M. J. et al. Drug target validation and identification of secondary drug target effects using DNA
microarrays. Nat Med.4, 1293–301 (1998).
[2.] Vogelstein B, Kinzler KW: Cancer genes and the pathways they control.
[3.] Nat Med 2004, 10(8):789-99.
[4.] Carlsson, S., and Vickers, A. 2015. Spotlight on Prostate cancer: the latest evidence and current controversies.
BMC Medicine, 13(1), 60.
[5.] Nevins, J. R., and Potti, A. 2007. Mining gene expression profiles: expression signatures as cancer
phenotypes. Nature Reviews Genetics, 8(8), 601-609.
[6.] Kihara, D., Yang, Y. D., and Hawkins, T. 2006. Bioinformatics resources for cancer research with an emphasis
on gene function and structure prediction tools. Cancer Informatics, 2, 25-35.
[7.] Shih-Heng Yeh, Hsiang-Yuan Yeh and Von-Wun Soo A network flow approach to predict drug targets from
microarray data, disease genes and interactome network - case study on prostate cancer2012, 2:1
[8.] Saiselet M, Gacquer D, Decaussin-Petrucci M, Spinette A, Craciun L, Andry G, Detours V, Maenhaut CNew
global miRSeq analysis of “miRNome”: the example of PTC and nodal metastases Dec 01, 2015
[9.] Mujeeb Rahiman Thayyil Kunhumuhammed, Ashvini Desai, Inamul Hasan Madar and Iftikhar Aslam Tayubi
Differential Gene Expression Analysis of Prostate Cancer for Biomarkers and Potential Drug Targets
Identification ISSN: 2319-7706 Volume 6 Number 9 (2017) pp. 185-193
[10.] Yuping Han, MM, Xuefei Jin, MD, Hongyan Li, MD, Kaichen Wang, MD, Ji Gao, MD, Lide Song, MM,
[11.] Yanting Lv, MM Microarray analysis of copy-number variations and gene expression profiles in prostate
cancer
[12.] Eleanor A. Howe,Raktim Sinha, Daniel Schlauch, and John Quackenbush RNA-Seq analysis in MeV 2011
Oct 3209–3210. [PMC free article] [PubMed]
[13.] Benedikt Rauscher, Florian Heigwer, Luisa Henkel, Thomas Hielscher, Oksana Voloshanenko, Michael
Boutros Toward an integrated map of genetic interactions in cancer cells 2018 Feb 21.
[14.] Vivek VYAS *, Anurekha JAIN, Avijeet JAIN, Arun GUPTA Virtual Screening: A Fast Tool for Drug
48 | P a g e
[15.] Lipinski CA (December 2004). "Lead- and drug-like compounds: the rule-of-five revolution". Drug DiscoveryToday: Technologies 1 (4): 337–341. doi:10.1016/j.ddtec.2004.11.007
[16.] Stefano Forli, Ruth Huey, Michael E. Pique, Michel Sanner, David S. Goodsell, and Arthur J. Olson
Computational protein-ligand docking and virtual drug screening with the AutoDock suite 2016 Apr
.[PubMed]
[17.] Hou T. ADME evaluation in drug discovery. 8. the prediction of human intestinal absorption by a support
vector machine. J. Chem. Inf. Model. 2007;47:2408–2415. [PubMed]
[18.] Harada N, Yasunaga R, Higashimura Y, Yamaji R, Fujimoto K, Moss J, Inui H, Nakano Y. Glyceraldehyde-
[19.] 3-phosphate dehydrogenase enhances transcriptional activity of androgen receptor in prostate cancer cells.
[20.] D Dai, JH Musser Halogenated triptolide derivatives as immunomodulators and anticancer agents US Patent