Development of a Gaseous Proton-Recoil Detector
for neutron flux measurements
between 0.2 and 2 MeV neutron energy
P. Marini1,∗, ∗∗, L. Mathieu1, M. Aïche1, T. Chiron1, P. Hellmuth1, J.-L. Pedroza1, G. Kessedjian2,S.Czajkowski1,B.Jurado1, andI.Tsekhanovich1
1CENBG, CNRS/IN2P3-Université de Bordeaux, Chemin du Solarium B.P. 120, 33175 Gradignan,
France
2LPSC, Université Grenoble-Alpes, CNRS/IN2P3, F-38026 Grenoble Cedex, France
Abstract.Absolute measurements of neutron fluence are an essential prerequi-site of neutron-induced cross section measurements, dosimetric investigations and neutron beam lines characterisation. Independent and precise neutron flux measurements can be performed with respect to the H(n,p) elastic cross section. However, the use of silicon proton recoil detectors is not straightforward below incident neutron energy of 1 MeV, due to a high background in the detected proton spectrum. A new gaseous proton-recoil detector has been designed to answer the challenge. The detector is described in details and results of the commissioning tests are presented.
1 Introduction
A precise absolute measurements of neutron flux is essential for neutron-induced cross sec-tion measurements as well as for neutron-beam lines characterisasec-tion and dosimetric inves-tigations. In particular, high quality heavy-nuclei neutron-induced cross section data are needed for the development of Generation IV nuclear systems [1, 2]. However, despite the experimental efforts, large discrepancies and uncertainties exist nowadays on these data in the actinide region [1, 3].
The neutron flux is typically determined with respect to fission standard reactions (235U(n,f), 238U(n,f), 237Np(n,f)), whose accuracy ranges from 0.5% to 10% [4, 5]. Independent and
more accurate measurements can be carried out with respect to the1H(n,p) elastic scattering cross section, which is evaluated with a precision better than 0.5% from 1 meV to at least 20 MeV [4, 5]. If silicon-based proton-recoil telescopes are the preferred method for absolute determination of monoenergetic neutron flux for neutron energies above 1−2 MeV [6, 7], the extension of theσ(n,p)-based method at energies relevant for the development of Generation IV nuclear systems, namely between 100 keV to 1 MeV [8], is not trivial. Indeed it requires the detection of low energy protons (.1 MeV) in a neutron andγ-dense environment, thus a clean discrimination of the signal from the detector background, which is technically difficult [9].
∗e-mail: paola.marini@cea.fr
Ref.[9] has shown that the most significant contributions to the low energy background arises from scattered neutrons impinging on H-contaminated surrounding materials, and from Compton electrons scattered by low energyγ-rays produced by the neutron source. Proton-recoil detectors based on silicon detectors are very sensitive to these low energy background sources and thus not suited for measurements on a large dynamical range below 1 MeV.
Plastic scintillators using time-of-flight technique [10] and proton-recoil proportional counters [11–13] are typically used in this low energy region. They present, however, signifi-cant limitations: scintillators light output is known to be non-linear, the detector efficiency is difficult to calculate accurately (better than 1−2%) and12C(n,x) reactions must be discrimi-nated from (n,p) reactions [14–17]. On the other hand, proportional counters must relying on simulations to account for the dependence on the ionizing particle energy of the gas ionizing potential, Quenching corrections, important wall effects and interferences from photons and carbon recoils [11, 18, 19].
A double-stage gas-based telescope, Gasseous Proton Recoil Telescope (GPRT), for neu-tron flux measurments at energies below 1 MeV was therefore developed by the ACEN group of CENBG. In Secs.2 and 3 the design of the detector and its performances are presented. Sec.4 concludes with the perspectives for further developments of the GPRT.
2 Detector design
The lay-out of the GPRT telescope is shown in Fig.1. The detector is constituted by a H-rich deposit (polypropylene, mylar foil or tristearine deposit), and a segmented∆E-E ionization chamber (4x4x12 cm3), read by a 64 pads Micromegas-based detection plane (Fig.1).
Figure 1.Schematic layout of the detector (left) and of the detection plane (right). The sample disk is shown separately for clarity purpose.
Seven different H deposit with different thicknesses can be mounted on a turning disk. The possibility to select the sample thickness adapted to the neutron incident energy is crucial to obtain precise measurements at low neutron energy since it allows to keep the proton energy loss in the H-foil below 10% and thus to reduce their energy spread. An empty slot is available for background measurements.
The detection plane is a Micromegas, segmented in 64 pads, as shown in Fig.1. The aim is to reduce the electronic noise associated to the pad capacitance, and to perform a raw track analysis in order to reject false coincidences with abnormal trajectories.
The chamber is filled with gas (CF4or N2−CO2) at an adjustable pressure, from few tens of mbar to few tens of 100 mbar, to reduce as much as possible the detector sensitivity to Compton electrons. Indeed the proton range is adapted to the detector length, which, on the contrary, corresponds to a very small fraction of electrons range. The coincidence between the∆E and E sides of the ionization chamber allow a first discrimination between direct and scattered neutrons. A field cage placed among the electrods (not shown in Fig.1) assures the uniformity of the electric field applied to the ionization chamber.
Special care was devoted during the project phase to minimize as much as possible the amount of materials to reduce neutron scattering. Finally, the gas and the ceramic materials have been chosen for their very low or absent hydrogen content, so that no additional protons can be emitted by the gas or the detector structure.
More details on the detector design can be found in Refs.[20, 21]. A detailed description of the detector associated electronics, based on the GET system [22], will be presented in a forthcoming publication [23].
3 Performances
Measurements to evaluate the detector performances were performed at the AIFIRA facility [24] with quasi-monoenergetic neutron beam, with energies from 0.3 to 1 MeV. Both CF4 and N2−CO2 (70% N2 and 30%CO2) gasses were used during the tests. The gas pressure was varied from 100 to 30 mbar, depending on the neutron energy, and the applied voltage was adapted consequently. Tests were also performed with and without the field cage to study its impact.
Measurements were performed to:
• Evaluate the direct vs scattered neutron discrimination. Direct and scattered neutrons could be discriminated i) imposing a∆E-E coincidence, ii) via trajectory reconstruction. In Fig.2 are shown the signal amplitudes measured on each hit pad by a proton generated by 1 MeV incident neutron, and its reconstructed 2D trajectory. It should be noted that the energy calibration of the detector is not straightforward, since the charge collection strongly depends on the gas pressure and on the applied voltage. The direct vs scattered neutron discrimination is therefore based on the analysis on the lenght of the trajectory: scattered neutrons have lower energy than direct ones, inducing a shorter track of the recoil proton. A further improvement in the discrimination could be obtained if a 3D trajectory reconstruction is possible. This could be achieved using a gas with a slower mobility than CF4, as the N2−CO2gas, provided that background events have a small rate. An example of 3D trajectory reconstruction is shown in Fig.2, where the drift time of electrons on each pad was measured.
Figure 2.Signal amplitudes for a given event on the different pads (left), and 2D (top) and 3D (bottom) tracks reconstruction for two proton events generated by 1 MeV neutrons (right). The values on the 3D track reconstructions are expressed in cm and represents the proton evolution in the z-axis.
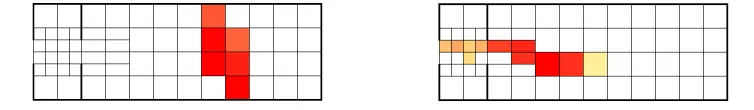
• Evaluate the lowest neutron energy. Proton traces at neutron energies as low as 200 keV have been obtained during the test using N2−CO2gas, as shown in Fig.3, fixing the lowest neutron energy at which the detector can be used. Efforts are ongoing to lower this limit.
Figure 3.Trajectory reconstruction of a cosmic ray event (left) and of a proton scattered by a 300 keV neutron.
• Validate the pressure-voltage working regimeElectrostatics discharges were observed for gas pressure of few tens of mbar and grid voltages of the order of−500 V during the measurements. Indeed, according to Paschen’s law, this regime corresponds to a lowering of the breakdown voltage for the used gasses [25]. To work with (p,V) values close to the breakdown voltage requires a very good control over the gas pressure in the detector, i.e. reduced pressure fluctuations, and a very low oxygen contamination, i.e. a very good detector chamber sealing.
• Evaluate the uniformity of the electrostatic field. Two main issues were encountered during the tests without the field cage. First of all, smaller amplitude signals were observed on the external pads of the detection plane. This effect, strongly suppressed when using the field cage, was investigated with the code OPERA [26], where the whole detector was simulated, as shown in Fig.4.
In Fig.5 the equipotential lines obtained without and with the field cage are shown. In the first case, the field is distorted at the entrance and at the exit of the detector, due to the presence of grounded structures (motor axis, reaction chamber...), translating in a degraded charge collection for the external pads of the detection plane. Simulations with a field cage show a better uniformity of the electric field, as confirmed by the experimental results.
Figure 4.Detector geometry implemented in OPERA simulations.
Figure 5. Equipotential lines simulated with the OPERA code. The setup accounts for the two colli-mators and the field cage (bottom) and no field cage (top).
shown in Fig.6, where the signal amplitude of the first raw of pads is plotted as a function of the irradiation time. The electrostatic charge is partially removed and one third of the signal amplitude recovered by connecting the collimator to the cathode and grounding it.
0 2 4 6 8 10 12 14 Time of irradiation (min)
0 500 1000 1500 2000 2500 3000
Max Amplitude of pad #17 (a.u.)
entrance collimator not linked entrance collimator linked to cathode and grounded
Figure 6.Evolution of the signal amplitude of a pad in the∆E region with irradiation time (left). (Right) As fig.5, a static charge of−2 nC is added on the entrance collimator.
Tests with the field cage and grounded collimators show no signal amplitude reduction during the irradiation, indicating that the effect is now strongly suppressed.
4 Conclusions and perspectives
Accurate neutron flux measurements via the elastic scattering1H(n,p) reaction is challenging for neutron energies below 1 MeV.γ-rays produced by the neutron production target generate electrons which induce a strong background in silicon detectors, preventing an accurate deter-mination of the neutron flux. To overcome this issue, a new gaseous proton recoil telescope constituted by a double ionisation chamber was designed and experimentally tested at the CENBG with monoenergetic neutrons. Tests confirmed its low electron sensitivity, making it well suited for neutron energies down to 200 keV in aγs and electrons dense environment. The∆E-E coincidences, coupled to a 3D proton track analysis, enables the disentanglement between direct and scattered neutrons.
Electrostatic simulations showed that the electric field is slightly distorted by surrounding materials, and heavily distorted by the space charge accumulation on ceramic pieces of the detector when the field cage is removed. The use of a field cage is therefore mandatory. Under the present experimental conditions, it was not possible to measure the proton detection efficiency of the detector, and in particular that every acceptable recoiling proton is actually detected. A quantitative experiment, using a proton microbeam is planned in the short term (middle 2019).
References
[1] M. Chadwick, M. Herman, P. Obložinský, M. Dunn, Y. Danon, A. Kahler, D. Smith, B. Pritychenko, G. Arbanas, R. Arcilla et al., Nuclear Data Sheets112, 2887 (2011) [2] G. Aliberti, G. Palmiotti, M. Salvatores, T. Kim, T. Taiwo, M. Anitescu, I. Kodeli,
E. Sartori, J. Bosq, J. Tommasi, Ann. of Nucl. En.33, 700 (2006)
[3] M. Salvatores,Uncertainty and target accuracy assessment for innovative systems using recent covariance data evaluations, Vol. 26 (Nuclear energy agency, 2008), www.oecd-nea.org
[4] J.C. Hopkins, G. Breit, Nuclear Data Tables A9, 137 (1971)
[6] S.J. Bame Jr., E. Haddad, J.E. Perry Jr., R.K. Smith, Rev. of Sc. Instr.28, 997 (1957) [7] T. Ryves, Nucl. Instr. and Meth.135, 455 (1976)
[8] NEA,Nuclear data high priority request list(2018), http://www.nea.fr/html/dbdata/hprl [9] P. Marini, L. Mathieu, L. Acosta, M. Aïche, S. Czajkowski, B. Jurado, I. Tsekhanovich,
Nucl. Instr. and Meth. A841, 56 (2017)
[10] R. Beyer, E. Grosse, K. Heidel, J. Hutsch, A. Junghans, J. Klug, D. Légrády, R. Nolte, S. Röttger, M. Sobiella et al., Nucl. Instr. and Meth. A575, 449 (2007)
[11] T.H.R. Skyrme, P.R. Tunnicliffe, A.G. Ward, Rev. of Sc. Instr.23, 204 (1952) [12] E.F. Bennett, Rev. of Sc. Instr.33, 1153 (1962)
[13] E.F. Bennett, T.J. Yule, Rad. Res.50, 219 (1972)
[14] M.W. Wu, T.C. Guung, C.C. Pei, T.N. Yang, W.S. Hwang, D.J. Thomas, Nucl. Instr. and Meth. A422, 79 (1999)
[15] B. Daub, V. Henzl, M. Kovash, J. Matthews, Z. Miller, K. Shoniyozov, H. Yang, Nucl. Instr. and Meth. A701, 171 (2013)
[16] M. Kovash, B. Daub, J. French, V. Henzl, K. Shoniyozov, J. Matthews, Z. Miller, H. Yang, inAdvancements in Nuclear Instrumentation Measurement Methods and their Applications (ANIMMA), 2011 2nd International Conference(2011), pp. 1–3
[17] D. Schmidt, B. Asselineau, R. Böttger, H. Klein, L. Lebreton, S. Neumann, R. Nolte, G. Pichenot, Nucl. Instr. and Meth. A476, 186 (2002)
[18] R. Babut, V. Gressier, Jour. of Instr.2, P01005 (2007)
[19] R. Nolte,Detection of neutrons, inEcole Joliot-Curie 2014(2014),http://ejc2014. sciencesconf.org
[20] P. Marini, L. Mathieu, M. Aiche, T. Cheron, P. Hellmuth, J. L. Pedroza, S. Czajkowski, B. Jurado, I. Tsekhanovich, EPJ Web Conf.146, 03015 (2017)
[21] P. Marini, et al., arXiv:1811.01005 [physics.ins-det] (2018)
[22] E. Pollacco, S. Anvar, H. Baba, P. Baron, D. Bazin, C. Belkhiria, B. Blank, J. Chavas, P. Chomaz, E. Delagnes et al., Phys. Proc. 37, 1799 (2012), proceedings of the 2nd International Conference on Technology and Instrumentation in Particle Physics (TIPP 2011)
[23] P. Marini, et al., to be submitted for publication
[24] S. Sorieul, P. Alfaurt, L. Daudin, L. Serani, P. Moretto, Nuclear Instruments and Meth-ods in Physics Research Section B: Beam Interactions with Materials and Atoms332, 68 (2014)
[25] N. Škoro, J. of Phys.: Conf. Series399, 012017 (2012)