UCL
Electrochemistry in the Gas Phase
by
Sean P. M cCormack
All rights reserved
INFORMATION TO ALL USERS
The quality of this reproduction is dependent upon the quality of the copy submitted. In the unlikely event that the author did not send a complete manuscript and there are missing pages, these will be noted. Also, if material had to be removed,
a note will indicate the deletion.
uest.
ProQuest U642827
Published by ProQuest LLC(2016). Copyright of the Dissertation is held by the Author. All rights reserved.
This work is protected against unauthorized copying under Title 17, United States Code. Microform Edition © ProQuest LLC.
ProQuest LLC
789 East Eisenhower Parkway P.O. Box 1346
the gas phase. This was achieved by considering a flame, which is a weak plasma,
as the electrolyte. All plasmas contain ions, electrons, excited species and neutral
atoms and molecules. A dual burner was designed and built which had the
capability to deliver two different gas streams to the burner head to produce one
flame, with two discreet halves. Using the flame created with this burner as
background electrolyte and aspirated solutions o f metal salts added to the flame to
alter the ion concentration; traditional two and three electrode electrochemistry
experiments were applied to this system.
This report discusses gas phase electrochemistry where ions in the gas phase
comprise the electrode compartments and complete the electrical circuit. This thesis
presents firstly a review o f the literature pertaining to ions in flames, which includes
natural flame ions and the ions created when metal salts are added to a flame.
Electrochemical cells are also introduced and ions in solution are compared to ions
in the gaseous phase. Diffusion potentials in a gaseous electrolyte will be
introduced and discussed and the first evidence for there existence presented.
Another important discovery will also be introduced and discussed namely the first
This thesis is based on research carried out at University College London from
September 2000 - September 2 0 0 2 .1 wish to thank my colleagues and the personal
o f the Department o f Chemistry for the pleasant atmosphere. I would also like to
thank the Engineering and Physical Sciences Research Council (EPSRC) and
Angela and Tony Fish for financial support.
I would also like to thank Professor Richard Compton (Oxford University) for his
help especially with the diffusion potential work and for his support through
Electrochemistry Communications.
I would also like to thank Professor David Williams (U.C.L.) for his help with the
redox potential work; I would not have made this discovery without his help.
Many thanks are also due to Professor Williams students, Camilla Forssten, Dimitra
Georganopoulou, Hanna Rajantie and All Morshed, with whom I shared a lab and
many ups and downs.
Last but not least I would like to thank my parents Frank and Rita and the rest o f
my family and friends for their support during my studies.
London, April 2003
List o f figures... 7
List o f tables... 9
List o f symbols... 10
1.0 Introduction... 13
1.1 Ions in flam es... 14
1.1.2 Ionisation in hydrocarbon flam es... 15
1.1.3 Ionisation in Hydrogen flam es...17
1.1.4 Ionisation o f metals added to flames... 18
1.1.4.1 Thermal ionisation o f metals added to flam es...18
1.1.4.2 Ionisation o f metals in flames by proton transfer... 19
1.1.4.3 Ionisation o f metals in flames by hot electrons...21
1.1.4.4 Ionisation o f metals in flames by excited state species...22
1.1.5 Different metallic ion species created in a flam e... 23
1.1.6 The absence o f di- or tri- cations in atmospheric flam es... 23
1.1.7 The total concentration o f ions in a flam e... 24
1.2 Electrochemical cells...24
1.2.1 The origins o f electrode potentials... 24
1.2.2 Electrolytic cells...26
1.2.3 Equilibrium electrochemistry...26
1.2.4 Voltaic cells... 27
1.2.5 The Nem st equation... 28
1.2.6 Activities o f gas phase ions... 28
1.2.7 Junction potentials... 29
1.3 Similarities between ions in the gaseous and liquid phases... 33
1.4.2 The effect on the VAC o f introducing metal ions into a flam e 39
1.4.3 Calculation o f the concentration o f ions in a flam e...41
1.5 Deposition o f metal species from the gas phase... 45
1.5.1 The combustion torch... 45
1.5.2 Plasma spray deposition... 46
1.5.3 Physical vapour deposition...46
1.5.3.1 Ion Plating/Plasma-Based...46
1.5.3.2 Ion Implantation... 46
1.6 Summary o f introduction...47
2.0 Experimental... 48
2.1 M aterials...48
2.2 Instruments...48
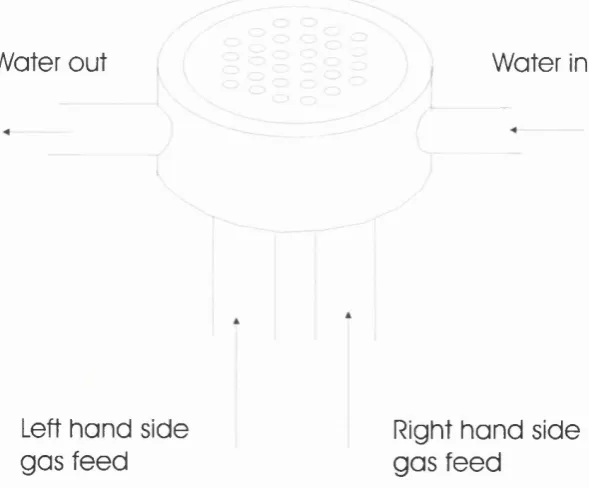
2.3 The Burner...49
2.3.1 The Burner top plate... 50
2.4 The burner manifold...51
2.4.1 Addition o f metal salts to the flam e... 52
2.4.2 The gas mixing chambers... 53
2.5 A description o f the flame created with this burner... 55
2.6 The choice o f electrodes in a high temperature electrochemical cell... 57
2.7 Electrode assembly and positioning...59
2.8 Operation o f the cell...60
3.0 Electrochemical measurements in a gaseous electrolyte... 61
3.1 Attempts at Dynamic Electrochemistry... 61
3.2 The relationship between temperature, stiochiometry and conductivity...64
3.3 Ion current versus concentration o f salt solution added to the flam e...69
3.3.1 Conductivity across the gas/gas interface... 70
3.3.2 The salt concentration versus the floating potential (Vf)... 71
3.4 Adsorption/absorption o f flame borne species by platinum electrodes...73
4.0 Electrochemical Diffusion potential in a gaseous electrolyte...81
4.1 Potential difference versus time traces (with different additives ... 81
4.2 Potential difference versus cesium solution concentration... 86
4.3 Change in temperature... 91
4.4 Total gas exit velocity... 93
4.5 Concentration profile o f ions in the vertical direction... 94
4.6 Conclusions... 96
5.0 Evidence for electrochemical redox potentials in the gas phase... 97
5.1 The cell reaction... 98
5.1.1 Formulation o f a gas phase cell potential... 99
5.2.1 The electrode set-up for concurrent measurements... 101
5.3 The change in ion current versus changes in the concentration...101
5.4 The change in potential difference versus changes in the concentration...102
5.5 The potential difference versus ion concentration for different species.... 102
5.6 The potential differences measured for different species...105
5.7 Conclusions...106
F ig u re 1.2. Shows the potential drop at the junctions in a cell... 30
Figure 1.3 A schematic diagram o f the gas/gas interface...33
Figure 1.4 Schematic diagram o f a metal/solution interface... 34
Figure 1.5 Schematic diagram o f a metal/plasma interface... 35
F ig u re 1.6 Schematic o f a Langmuir probe...37
Figure 1.7 The volt-ampere characteristic obtained in a flame... 38
Figure 1.8 The increase in ion and electron currents in the V A C ... 40
Figure 1.9 A schematic diagram o f the capture area o f the probe... 43
Figure 2.1 Shows a Meker type burner...49
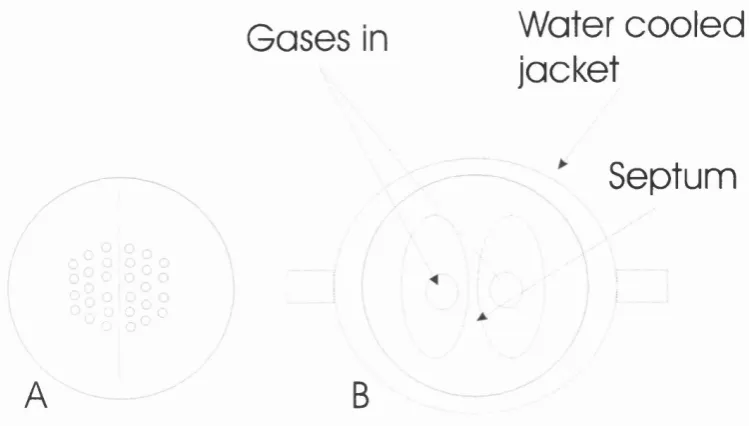
Figure 2.2 Schematic o f the burner top plate and the internal chambers...51
F igure 2.3 A schematic o f the burner... 52
F ig u re 2.4 A schematic o f the round bottomed flask... 53
Figure 2.5 Shows the gas-mixing chamber...54
Figure 2.6 A photo o f the two flames that comprise the flame cell... 55
F igure 2.7 A thermal image o f two platinum wire electrodes... 58
F ig u re 3.1 A current voltage scan in a natural unseeded flame...62
Figure 3.2 The increase in ion and electron currents in a C V ... 63
F ig u re 3.3 Plot o f flame temperature versus the oxygen/hydrogen ratio... 65
Figure 3.4 Plot o f ion current versus the oxygen/hydrogen ratio... 66
F igure 3.5 Plot o f potential difference versus the oxygen/hydrogen ratio... 67
Figure 3.6 Plot o f the VAC’s at different distances into the flam e... 68
Figure 3.7 A plot o f ion current versus concentration o f KCl solutions...69
Figure 3.8 Plot o f conductivity versus position...70
F igure 3.9 Comparison o f the different ion current response... 72
F igure 3.10 The distribution o f copper through a Pt electrode...74
F igure 3.11 The distribution o f copper through four Pt electrodes... 76
Fig u re 3.12 Elemental images o f Pt electrodes... 77
Figure 4.4 Flot o f potential difference versus the concentration o f C sC l... 87
Figure 4.5. Flot o f potential difference versus ln([CsCl^/[CsCl]^)...90
Figure 4.6 Potential difference at different temperatures...92
Figure 4.7 Plot o f potential difference versus gas exit velocity...93
Figure 4.8 Plot o f potential difference versus height above the burner...94
Figure 4.9 Plot o f concentration versus height above the burner...95
Figure 5.1 Schematic diagram o f the electrode set-up... 97
Table 1. Percentages o f metallic ions observed in a hydrocarbon flam e...23
Table 2. Comparison a standard cell (aqueous) and a gas phase cell (1800 K )...36 Table 3. Parameters associated with the experimental set up used in this w ork. ...44
LIST OF SYMBOLS a-x, ^products ^reactants C d e e" _ * e
/
f j k k] in n Hi He P qi r t u X y z z activityare the activities o f the products
are the activities o f the reactants
concentration
probe diameter
the elementary charge
an electron
a hot electron
electrostatic force between the point charges
the gas flow rate
flux
Boltzmann constant
rate constant
natural log
number o f electrons
number o f ions
number o f electrons
pressure
point charge
inter charge separation
tims / s
mobility
cartesian co-ordinate
cartesian co-ordinate
cartesian co-ordinate
number o f transferring electrons
A
D
capture area
E Measured cell potential
E® Standard Electrode Potential
Eceii cell potential
Ej ionisation energy
F The Faraday Constant
AGhydrayion, free energy o f hydration
AGionisation free energy o f ionisation
AGsoivation free energy o f solvation
AHionisation, enthalpy o f ionisation
ASionisation, entropy o f ionisation
I current
Mi® is the standard state
Na Avogadro constant
Nj number o f ions
No number atoms
R gas constant
T temperature
Vp plasma potential
VF. floating potential
c relative permittivity
So vacuum permittivity
s/eq dielectric constant
^ electrical potential
(|)s solution electrical potential
(|)m metal electrode electrical potential
A(j)in/s potential drop across the electrode/solution interface
AOdiftbsion j unction or diffusion potential.
y activity coefficient
Xo Debye length
Xfp free path length
p electrochemical potential
cj collisional cross section
Aspirated Metal salt Thermal Spray Deposition (AMTSD)
Chemical Vapour Deposition (CVD)
Counter Electrode (CE)
Electrostatic Spray Assisted Vapour Deposition (ESAVD)
Flame Ionisation Detector (FID)
Ionisation Energy (IE)
Low Density Poly Ethylene (LDPE)
Personal Computer (PC)
Primary Reaction Zone (PRZ)
Reference Electrode (RE)
Secondary Reaction Zone (SRZ)
Volt-Ampere Characteristic (VAC)
Working Electrode (WE)
left hand side (LHS)
electro motive force (e.m.f)
right hand side (RHS)
1.0 Introduction
The ultimate aim o f this project was to apply liquid phase electrochemical
methodology to the gas phase. This was achieved by considering a flame, which is a
weak plasma, as an electrolyte. All plasmas contain ion and electrons\ In a flame
the ions and electrons are created thermally in the primary reaction zone. A dual
burner was designed and built which had the capability to deliver two different gas
streams to the burner head to produce one flame, with two discreet halves. Using
the flame created with this burner as background electrolyte and aspirated solutions
o f metal salts added to the flame to alter the ion concentration; traditional two and
three electrode electrochemistry experiments were applied to this system.
The literature has references to “Electrochemistry in the gas phase”^ and
“Voltammetry in gas phase environments”^. These gas phase experiments however
rely on droplets o f liquids or vapours condensing from the gas phase onto an
insulator between a microelectrode and a reference electrode in order to complete
the electrical circuit. This report presents gas phase electrochemical measurements
where thermally generated atomic or molecular ions in a gaseous electrolyte
complete the electrical circuit. Other gas phase electrochemical measurements that
utilise gas phase ions include the conductivity in flames experiments made by
Goodings'^ and the plasma electrochemical growth processes where gaseous ions are
deposited under electrochemical control onto ion conducting layers^,^,^.
This thesis presents firstly a review o f the literature pertaining to ions in flames,
which includes natural flame ions and the ions created when metal salts are added
to a flame. Electrochemical cells will also be introduced and ions in solution will be
compared to ions in the gaseous phase. In chapter 2 the experimental set up and
procedures used to perform the experiments will be described. Chapter 3 will
describe how the conductivity in a flame changes with different parameters and the
effect o f inserting the electrode into the flame is discussed. Electrochemical
introduced and discussed in Chapters 4 and 5. Finally in Chapter 6 there will be a
summary o f the project and conclusions are drawn.
1.1 Ions in flames
The existence o f ions in the gas phase (a flame), which are thermally generated, has
been well documented^. A flame can be considered as weak plasma containing ions,
electrons, excited species and neutrals with varying concentrations depending on
what fuel, oxidant and carrier gases are being used. The ratios o f the gas mixtures is
important in determining the degree o f ionisation, i.e. the flame can be fuel rich
(PR), [FUEL] > [OXIDANT], or fuel lean (FL), [FUEL] < [OXIDANT] or
stoichiometric [FUEL] = [OXIDANT]. W hether the gases are premixed or allowed
to diffuse into the reaction zone is also important, as premixed gases produce a
more uniform flame.
The charge carriers created in a flame are mostly atomic and molecular cations and
free electrons and these are produced in a variety o f ionisation processes in the
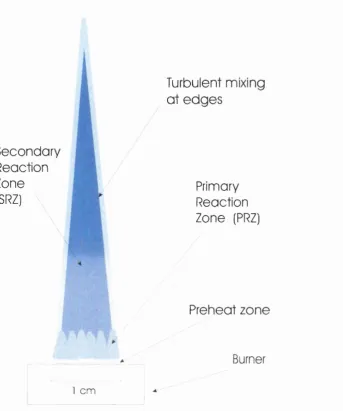
Primary Reaction Zone (PRZ) o f the flame. The PRZ is the bright luminous region
at the base o f the flame, shown schematically in figure 1.1. The PRZ is typically 0.1
mm thick at atmospheric pressures extending up to 4 mm from the burner^. The
PRZ’s merge into the Secondary Reaction Zone (SRZ), an area o f secondary
luminosity, figure 1.1, which is approximately isothermal with laminar flow. The
edges o f the SRZ are in contact with the relatively static and lower temperature
atmosphere, which surrounds the flame, and thus there is some turbulent mixing at
the edges o f the flame. The concentration o f ions in atmospheric flames is generally
small, with a maximum o f 10^^ ions cm'^ in hydrocarbon flames, and it is thought
that these ions do not play a role in the chemistry o f combustion*®. Two flame
systems have been used in this work CH4/O2/N2 and H2/O2/N2, the ionisation
Turbulent nnixing
a t e d g e s
S e c o n d a r y
R eaction
Zone
Primary
(SRZ)
R eaction
Zone (PRZ)
P reh eat z o n e
Burner
1 c m
Figure 1.1 Schematic of a typical atmospheric flame produced from a Meker burner showing the Primary Reaction Zone and the Secondary Reaction Zone.
1.1.2 Ionisation in hydrocarbon flames
In a typical hydrocarbon/oxygen flame the maximum concentration of ions
approaches lO'^ ions cm‘^, out o f a total of 10‘^ total species cm'^, (which is about
gas region (SRZ) and decays downstream. The ions, which are predominantly
CHO^ and HgO^, in hydrocarbon flames, are created in the PRZ o f the flame and
are carried into the SRZ where they persist and can be measured. The principal
techniques for determining the electron and ion concentrations in flames are:
Microwave absorption^ \ Mass S p e c t r o m e t r y ^ a n d Langmuir probes
In a hydrocarbon (CH4) flame the main ionisation reaction is thought to be a two-
body chemi-ionisation reaction (1),
(1) CH + O -> CHO^ + e'
The rate constant for this reaction was m e a s u r e d a t 2200 K and found to be
directly proportional to the product o f the CH and O concentrations, and is, ki = 1.7
X 10'^^ cm^ molecule'^ s '\
The primary CHO^ ion can then initiate a whole series o f proton transfer reactions,
examples o f which are given in reactions (2)-(3), with flame intermediates o f higher
proton affinity to create different ions.
(2) CHO^ + H2O -> CO + HsO^
(3) HsO^ + M ^ M^ + H2O + H
(4) M^ + e' + A M + A
The ratio [H3 0^]/[CH0 ^] is o f the order 10"^ - 10^. As these ions are been generated
at a constant rate and are decaying at a constant rate in a three-body recombination
reaction (4), the concentration o f ions at any point inside the SRZ o f the flame is
a
a
The profile o f total concentration o f natural ions in a flame rises steadily through
the PRZ o f a flame where it peaks; there is then a steady decay in the SRZ
Some atoms and molecules form stable negative ions in the PRZ, o f which O' and
O2 ' exam ples/^ Usually the electron attachment energies are small, (1.41 and 0.42
kJ mol'^ respectively in the above cases) so any negative ions react to form the
neutral species and a free electron. In the SRZ o f atmospheric flames however
electrons are the main negatively charged species.
1.1.3 Ionisation in Hydrogen flames
The only charge carriers o f any significance found in pure (without any additives)
H2 + O2 + N2 f l a m e s a r e and its hydrates (up to the tetrahydrate) and e',
with concentrations up to 10^ ions cm'^. The following mechanisms o f chemi-
ionisation are suggested for fuel lean fiames^^,^\ reactions (6) and (7),
(6) H + OH = H2O*
(7) H + H2O* -> HsO^ + e'
where * represents an excited electronic or vibrational state. For fuel rich flames^^,
the following reactions are suggested, reactions (8) and (9),
(8) H + H = H2*
(9) H2* + OH ^ HsO^ + e
(10) H + H + 0 H - > H 3 0 ^ + e
Nitrogen containing ions have also being assigned to some o f the peaks o f a mass
spectra obtained from a flame o f H2 + O2 + N2. The peaks at mass 17, 18 and 30
amu are NHg^, N H / and NO^ respectively and are responsible for between 0.01 %
and 0.1 % o f total ionisation, depending on the flame conditions. Experiments^^ in
which argon was substituted for nitrogen as dilutent showed a decrease o f the order
10^ fold for these nitrogen-containing ions.
1.1.4 Ionisation o f metals added to flames
The mechanisms responsible for the ionisation o f metals in premixed flames o f
hydrogen (or o f a hydrocarbon) with oxygen and nitrogen varies from metal to
metal^"^,^^: some experience thermal ionisation others either proton or charge
transfer. Ionisation can also be caused by ‘hot electrons’ and by reactions with
excited state species. The various ionisation mechanisms are discussed below and
some examples given.
1.1.4.1 Thermal ionisation of metals added to flames
Thermal ionisation is more significant for metals with lower ionisation potentials.
The reaction involved is the outcome o f electronic excitation of, for example, an
atom o f a metal. A, in reaction (11).
(11) A + M = A* + M -» + e + M
Where M is any molecule providing energy for the ionisation and A* is an excited
state species. When an atom or molecule is introduced into a high (kinetic) energy
progressively higher excited states and eventually the electron is separated from its
mother (ion). The kinetics o f thermal ionisation have been studied extensively for
the alkali metals^^ and a general expression for the rate constant has been derived
for the overall reaction (12),
(12) A + M ^ A ^ + e ' + M
as ki2 = (9.9 ± 2.7) x 10'^ exp(-E,/RT) molecule'^ cm^ s '\ where Ei is the
ionisation energy o f the metal, R is the gas constant and T is the measured flame
temperature^^. Although this expression for k n is strictly only applicable to the
alkali metals, it is expected to hold for other metals but with a different
preexponential factor. Ions are lost by the reverse o f reaction (12) which is a three
body recombination involving a neutral species an ion and an electron. The rate
constant for this reaction has the value k„i2 = 4.1 ± 1.1 x 10’^"^ T'* cm^ molecule'^ s'^
and is not dependant on flame composition or on which alkali metal is
considered^*,^^.
1.1.4.2 Ionisation of metals in flames by proton transfer
Another important mechanism for the production o f metallic ions is proton transfer.
This usually involves the natural and relatively abundant ion HgO^, (or CHO^ in
hydrocarbon flames) transferring a proton to some species with a greater proton
affinity than H2O. For metals, such species may be free atoms or molecules o f an
oxide or a hydroxide, thus generating ions in the reactions (13)-(15).
(13) A + -> A^ + H2O + H
(14) AO + HsO^ ^ AOH^ + H2O
Reaction (13) here is a proton transfer reaction followed by rapid dissociation o f
AH^ into and H. The products o f reactions (13) - (15) are usually linked by
equilibria such as reactions (16) and (17).
(16) A H2O + M — A^ + H2O + M
(17) A O IT + H = A^ + H2O
Which couple the concentrations o f hydrated ions and the parent ion, and also o f
AOH^ and A^. These proton transfer reactions were studied by measuring the rate
o f change o f concentration o f HgO^, which is depleted in reactions (13) - (15) and
the reverse o f reaction (10)
The reversible reaction (10) governs the concentration o f in the burnt gases o f
simple flames o f H2 + O2 + N2.
The overall rate constant ka for proton transfer was measured in flames o f H2 + N2 +
O2 by Hayhurst and Telford^^ and was found to have the value ka = 10'^ ions cm'^
s '\ This value is a mean o f all the proton transfer reactions (13)-(15).
The ratio o f the rates o f thermal ionisation to proton transfer ionisation is
ki2[A] [M]/ka[A] and substitution o f typical values o f rate constants and concentrations in the burnt gas o f a flame (SRZ) indicates that thermal ionisation is
faster than proton transfer ionisation. This is because the concentration o f HgO^ is
relatively low downstream in the SRZ o f a flame, however close to the PRZ where
the concentration o f is at its largest, the proton transfer reaction can dominate.
An example o f how these processes affect a particular species is given next.
When the transition metal copper, for example, is added to a flame, the reactions
responsible for the production o f some o f the copper ion species according to Butler
(18) CuOH + ->■ Cu^^ HzO + H^O (19) Cu + H3O+ -» Cu+ HzO + H
The rate constant for reaction (18) between an ion and a molecule with a large
dipole moment is ca. 3.5 x 10'^ ions cm'^ s'^ at 2000 K and shows a negative
temperature coefficient, with kig varying as ~ The rate constant for the ion
atom reaction (19) is smaller ca. 4 x 10'^^ ions cm'^ s '\ at 2000 K and shows a
positive temperature coefficient i.e. at higher temperatures the activation energy for
the reaction is lowered. The ionisation o f copper has been investigated in both fuel
rich and fuel lean flames and has led to the conclusion that the same ionisation
mechanism operates in both fuel rich and fuel lean flames. Ionisation is faster in
fuel lean flames however due to the greater abundance o f CuHO, which is due to
the greater abundance o f OH as explained in section 1.1.3. This example goes to
highlight some o f the complications encountered when describing ionisation
mechanisms in flames.
1.1.4.3 Ionisation of metals in flames by hot electrons
The third mechanism for ionisation in flames involves ‘hot electrons’ and is thought
to be responsible for ionisation in the PRZ o f flames containing hydrocarbons. The
reaction is (20),
(20) A + e'* ^ + 2e"
Where e'* represents a hot electron. There is evidence^^ that free electrons can be
hotter than the flame gases by 200 - 300 K in the reaction zone o f a hydrocarbon
flame. Ionisation by this method has not been studied thoroughly but is generally
1.1.4.4 Ionisation of metals in flames by excited state species
The final ionisation mechanism involves collisions between a metal atom and an
electronically excited atom or molecule^^, e.g. H2O*, which is generated in the
production o f reactions (6) and (7).
(6) H + OH = H2O*
(7) H2O* + H = + e
Collisions o f H2O* with a flame species may either stabilise H2O or cause
dissociation to H + OH. However collisions with metals may result in the formation
o f ions through:
(21) H2O* + A ^ A \H 2 0 + e'
In fuel rich flames like the one used in this project the contribution from reaction
(21) is always much less than for thermal ionisation, reaction (12). This is because
the temperature in the SRZ o f a fuel rich flame is higher than the temperature in the
SRZ o f a fuel lean one. Also, the flame radicals H and OH exceed their
concentrations for final equilibrium to a greater extent in the reaction zone o f a lean
flame than in the reaction zone o f a fuel rich flame, this results in a reduced
1.1.5 Different metallic ion species created in a flame
As stated earlier the mechanism for the ionisation o f metals in flames varies from
metal to metal. The ionic species created and their percentage amount o f total
metallic ions also varies from metal to metal. The metallic ions that are created
include mainly M^, with lesser amounts o f the molecular ions M(OH)H^ ,
MH^ etc. Generally the larger and more complex the molecular ion the less o f it is
created. For example when the transition metals nickel, copper, iron and cobalt are
introduced into a flame with a burnt gas temperature o f 2200 K the percentages o f
total metallic ions observed 1.25 mm above the burner are shown in table 1.
Table 1. Percentages o f metallic ions observed in a hydrocarbon flame seeded with equimolar concentrations (0.25 M) o f the metal chlorides measured by Mass
Spectroscopy.^"^
Species Ni Cu Fe Co
77.2% 68.0 % 83.2% 77.2%
M^.HzO
M(OH)H^
17.0% 23.0% 9.6% 13.7%
M^.2H20
M (0 H )H \H 2 0
2.0% 6 . 3 % 1.4% 1.5%
Other M species 3.8% 2 . 7 % 5.8% 7.6%
1.1.6 The absence of di- or tri- cations in atmospheric flames
No di- or tri- cations are formed at these flame temperatures, as the Second
1.1.7 The total concentration of ions in a flame
When an ionisable metal species is aspirated into a flame the total concentration o f
positive ions increases by an amount dependant on the concentration o f the added
solution. For the cases o f potassium, which is ionised thermally and copper, which
is ionised by proton transfer, both show similar trends. When a metal, M, is
introduced into a flame the concentration o f is depleted by proton transfer to
M and MOH as was shown in reactions (13) - (15). This in turn results in reaction
(10) adjusting its equilibrium position to produce more ions. The outcome is
an increase in the total level o f ionisation^^, see section 1.4.3 for a complete
calculation o f the concentration o f ions in a flame.
1.2 Electrochemical cells
Electrochemical cells can vary widely in design and function but in general an
electrochemical cell will consists o f two or three electrodes - electron conductors, -
in electrical contact with an electrolyte - an ionic conductor, which may be a liquid,
a solid or in this case a gas. An electrode and its electrolyte comprise a half-cell,
two half cells in series make an electrochemical cell. An electrochemical cell that
produces electricity as a result o f the spontaneous reaction occurring inside it is
called a galvanic cell and an electrochemical cell in which a non-spontaneous
reaction is driven by an external source o f current is called an electrolytic cell.
1.2.1 The origins o f electrode potentials
When an electrode is inserted into an electrolyte containing ions, it acts as a sink or
source o f electrons depending on the concentration and identity o f the ions in the
electrolyte, as in reaction (22)
After the transfer o f an infatesimal amount o f charge, the electrode’s inner or
Galvani potential will adopt a potential difference with respect to the solution’s
Galvani potential. When the forward and backward reactions at the electrode
surface have reached equilibrium, with no net current flowing, the measured
potential difference is the equilibrium potential difference, and we can say, equation
(23),
--Electrolyte _ — Electrode M i — M i
where and are the electrochemical potential’s o f each species, i,
in the electrolyte and electrode respectively for one electrode. Here the electrolyte
can be a solid, liquid or gas.
In an aqueous electrolyte the electrode potential is related to the free energy o f
ionisation, AGjonisation and the free energy o f solvation, AGsoivation o f the ionic speices
dissolved in the aqueous solution surrounding the electrode surface, equation (24)
0 4 )
Electrode potentials in a plasma have also been described^^ and the conclusion is
that the plasma behaves as an electrolyte and shows a characteristic potential drop
at the metal plasma interface that is distinctive for every metal. This plasma
electrode potential is related to the free energy o f ionisation o f the ionic species
present in the gaseous environment surrounding the electrode surface. In an ideal
plasma there would be no contribution to the electrode potential from the hydration
o f ions, equation (25)
1.2.2 Electrolytic cells
In an electrolytic cell a reaction can be made to happen at the electrode surface by
applying a potential to, or polarising the electrode. An example o f this is the
Fe^^/Fe^^ half-cell, where the composition o f the solution can be controlled
electrically, by shifting the equilibrium in reaction (26).
(26) Fe^^ + e‘ = Fe^^
This is achieved by, for example, applying a suitable negative potential to an
electrode immersed in a solution containing Fe^^ and Fe^^. When the energy level
(Fermi) o f the electrons in the electrode exceed the energy levels o f the highest
unoccupied atomic orbitals in the Fe^^ ion they will transfer to the Fe^^ in solution,
this will reduce Fe^^ to Fe^^ thus increasing the concentrations o f Fe^^ and lowering
the concentration o f Fe^^. The application o f a positive potential to the same
electrode will have the opposite effect.
1.2.3 Equilibrium electrochemistry
An electrochemical cell that has not reached chemical equilibrium can do electrical
work as the reaction inside it drives electrons through an external circuit. The work
that a given transfer o f electrons can accomplish depends on the potential difference
between the electrodes. The potential difference is called the cell potential and is
measured in volts. A cell in which the reaction is at equilibrium can do no work,
and the cell potential is zero. Therefore to make thermodynamic measurements on a
cell by measuring the work it can do, we must ensure that it is operating reversibly,
(not the case in cells with transference because the motion o f the ions is not
reversible). To do this we measure the cell potential when it is balanced by an
opposing source o f potential, the resulting potential difference is called the zero-
current cell potential, E. The standard Gibbs free energy o f the cell can then be
(27) AG^ = - nFE®
where n is the number o f electrons and F is the Faraday constant and E® the
standard cell potential. Equilibrium electrochemical measurements also enable other
thermodynamic parameters to be obtained, such as entropies, enthalpies and
equilibrium constants.
1.2.4 Voltaic cells
In a voltaic cell the potential difference that develops between the two electrodes
can be measured. This is achieved by applying a voltage, which is equal and
opposite to the voltage generated in the cell until such a point where no current is
flowing. At this point if small changes in the applied voltage produce current flows
in one direction or another, then we know the cell is working reversibly and the
opposing voltage is equal to the maximum, which the cell can develop. Using one
half o f a cell as a reference half-cell, and the other half-cell as a variable half-cell,
potential differences measure between different half-cells can then be compared
versus the reference half-cell.
If is the solution (electrolyte) electrical potential and (|)m the metal electrode
electrical potential, then the potential drop across the electrode/solution interface
A(j)m/s is given by equation (28),
(28) A ( j) in /s “ m " ^ s
This quantity (A(|)m/s) has a fixed and precise value for any particular system. The
absolute value o f this quantity cannot be measured directly, however it can be
compared to another (reference) half-cell, as in equation (29).
1.2.5 The Nernst equation
Measured cell potentials, E are related to standard cell potentials, E®, and to the
activity coefficients o f the reagents in the cell reaction through the Nernst equation,
equation (31). The activity, ai, is a term introduced to allow for the nonideality o f a
solution and is equal to the product o f the concentration, c and the mean ionic
activity coefficient, y± , o f the ions, i, as in equation (30).
(30) a , = c r ^ = - ^ r ±
RT
(31) — In
nF
products
V tan J
Where ^products and ^reactants are the activities o f the products and reactants
respectively and Mj® is the standard state.
1.2.6 Activities of gas phase ions
In electrolyte solutions the ion - ion interactions are strong and extend over a long
range so electrolyte solutions can be regarded as ideal only at very low
concentrations (below 10'^ mol L'^) and any concentration above this level needs to
be adjusted with the aid o f an activity coefficient to get the effective concentration.
The activity coefficients, y, o f the ions in our gas phase system will approach unity
because o f the low concentration o f these ions present (10‘^ - 10'^ mol fraction).
Ions in solution tend to loose their unit activity when the concentration o f the
solution approaches 10'^ mol L '\ This is equivalent to the ions being separated by a
distance o f 2.55 x 10'^ m. For the equivalent electrostatic interaction between gas
phase ions the separation would need to be o f the order 2.25 x 10'^ m, calculated
using equation (32). This separation is equivalent to an ionic concentration o f 8.76 x
maximum ion concentration in atmospheric flames is approximately 1 0^^ ions cm'^,
therefore the conclusion is that the ions in a flame are far enough apart so as not to
affect each others activity.
(32)
In equation (32), f is the electrostatic force between the point charges (ions), qi and
q2 are the two charges concerned, r the inter charge separation and e and eo are the
relative and vacuum permittivity respectively. c/Eq is known as the dielectric
constant and it represents the effect o f the medium in decreasing the force between
the charges.
1.2.7 Junction potentials
When there is a junction between phases in the experimental set up, that has not
been eliminated with the use o f a salt bridge, another term needs to be added to the
Nernst equation (31) to account for the reduction in the measured potential due to
the diffusion o f charge carriers across the electrolyte/electrolyte interface, this gives
equation (33),
,0 R T
(33) — In
nF
products
T ^ ^ r e a c t z a t s J
+ diffusion
where AOdiffi,sion is the junction or diffusion potential.
For all the other junctions in an electrochemical cell there will also be junction
potentials, (see figure 1.2) e.g. between the electrodes and connector clips. Keeping
all the junctions in the experimental set up the same from experiment to experiment
means we can neglect these contributions to the potential difference measurements.
electrolyte/electrolyte potential drop that make up the cell potential, equation (34),
which is equivalent to equation (33).
A O ,cl i p(L )/el ectrode(L)
TU
A
AO, electrolyte(L)/electrolyte(R)
1
AO, electrode(L)/electrolyte(L)
L
it
-C ELL
AO, electrolyte(R)/electrode(R) AO, electrode(R)/clip(R)
Figure 1.2. Shows the potential drop at all the junctions in a typical electrochemical cell.
(34) EcELL — (AOm/,ï)^^ — (AOm/.y) + A ^ d iffu s io n
The origin o f the diffusion potential may be understood by considering two HCl
solutions o f different concentrations Ci and C] put into contact. Clearly there will be
a large concentration gradient, ô[HCl]/ôx, at the interface between the two
solutions. Such a concentration gradient will lead to diffusion o f both and Cl",
from high concentration to low concentration so as to tend to equalise the two
The rate o f diffusion is measured by the flux o f the diffusing species. That is the
number o f moles passing through unit area in unit time. Thus at the interface we can
write for the flux o f protons (35),
and for the flux o f the chloride ions (36),
(36)
where Dh+ and Dci- are the diffusion coefficients o f and C f respectively. Figure 1.3 shows a schematic diagram o f how the concentrations o f ions and electrons
might vary across a gas/gas interface with different concentrations on either side.
Initially shortly after the interface is formed, equation (37) is true,
0{Cr]
(37)
ÔX Sx
But we know that Dh+ is much larger than D cr because the protons are smaller and lighter and therefore more mobile than the chloride ions. It follows that initially the
protons will diffuse at a faster rate than the chloride ions. As a result o f this, a
charge separation and hence a potential difference will be established across the
interface between the two solutions. The solution with the lower concentration will
become positively charged due to the gain in protons and the phase with higher
concentration will become negatively charged due to excess anions. This will have
migration will also contribute to the rate o f mass transport) and the proton transport
will be retarded. A steady state will eventually be reached, and at this steady state a
potential difference will exist at the boundary o f the two solutions, this is known as
a liquid junction or diffusion potential. The magnitude o f the diffusion potential can
be estimated using the Henderson equation^^,(38).
(38) diffusion
— U
R T
F
Inwhere u+ and u. are the mobility’s o f the two charged species, (H^ and C f in this
example) respectively. Thus the magnitude o f the diffusion potential is dependant
on the difference in the mobility’s o f the two charge carriers. Diffusion potentials
also depend on the ratio aR / aL; if the two concentrations are equal the diffusion
potential is predicted to disappear as would be anticipated.
The above model will also be applicable to the gas phase where there is a difference
in mobility’s between the two charge carriers and is discussed further in chapter 4.
A schematic diagram o f the charge separation between the two gases is shown in
figure 1.3. Here the charge carriers are molecular or atomic cations and free
Interface
C 0
1
0O
c
o
O
C o n cen tra tio n of C ations
C o n cen tra tio n of Electrons
High
Concentration
Low
Concentration
Distance
Figure 1.3 A schematic diagram of the differences in the rate of diffusion of cations and electrons across a gas/gas interface, from high to low concentrations.
1.3 Similarities between ions in the gaseous and liquid phases
In the liquid phase ions can exist dissolved in a solution. Similarly in the gaseous
phase ions can exist, where the gas is a flame. In a liquid electrolyte the ions are
stabilised by electrostatic forces and polarisation, whereas in a flame the ions are
generated thermally and are relatively unstable. Coulomb forces acting between
charged particles ensure a gas phase (flame) cation is, on average, surrounded by
more than one electron^^,^*^ this surrounding electron cloud provides an effective
shielding of the positive ion charge. This situation is analogous to the liquid phase
where an ion atmosphere surrounds an ion with charges opposite to that of the
1.3.1 Similarities between the solid/liquid and solid/gas interface’s
Electrodes can be inserted into both media (liquid and gas) for the purpose o f taking
electrochemical measurements. In both cases (solid-gas, solid-liquid) the potential
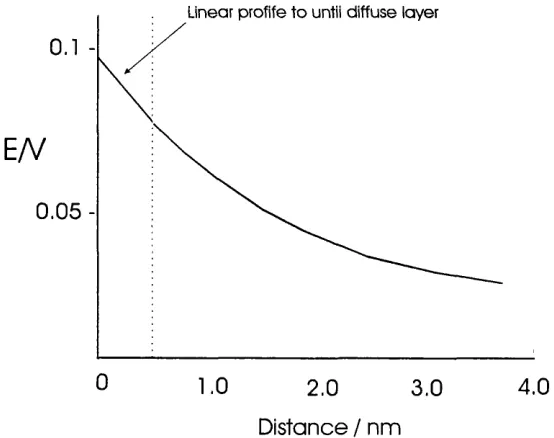
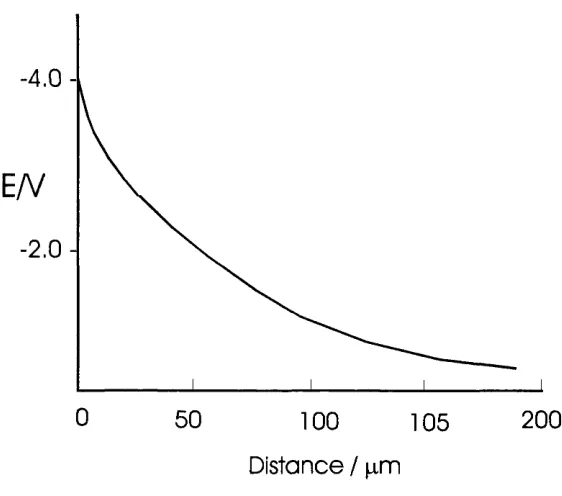
drop at the interface is similar, for polarised electrodes, figures 1.4 and 1.5 show
schematic diagrams o f the potential drop across the two interfaces. Both profiles
show an exponential decay o f potential away from the electrode surface, the only
major difference being the length scale o f the diffuse layer in the solution and the
sheath layer in the gas phase.
Linear profife to untii diffuse ioyer
0.1
E/V
0 .0 5
-0 1.0
2.0
3.0 4.0D istance / nm
Figure 1.4 Schematic diagram o f the potential profile through the solution side at a metal/solution interface, according to the Gouy-Chapman-Stem model. For a 10
M 1:1 electrolyte in water at 25 and a potential difference o f 100 mV.
The Debye layer is approximately 200 pm thick when the concentration o f ions is
approximately 10^^ ions cm"^, whereas the diffuse layer in the Gouy-Chapman-Stem
model is approximately 5-6 nm when the concentration is 10'^ M (10^^ ions cm'^).
carriers in the vicinity o f that electrode. The lower concentration means that the
electric field emanating from the electrode needs to protrude further into the bulk
electrolyte to counter the charge.
-4.0
-
2.0
0
5 0 100 105200
Distance / pm
Figure 1.5 Schematic diagram o f the potential profile through the plasma side o f a metal/plasma interface. For a flame with an ion concentration o f 10^® ions cm"^.
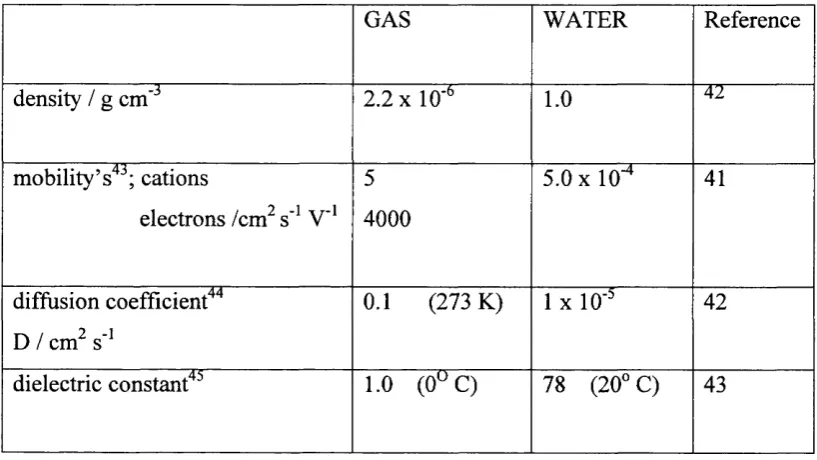
1.3.2 Differences between a flame plasma and a liquid electrolyte
The obvious major differences (see table 2) between the two media are the
temperatures, the densities and the mobility’s o f the constituents. Also the solvent
effects are absent from the gas phase too. In solution an ions free energy may be
calculated from the sum o f its free energy o f ionisation, AGjonisation and its free
energy o f hydration AGhydrayion, whereas a gas phase ion has no contribution to its
total free energy from the hydration o f the ion. Overall a flame like a solution is
electrically neutral, but statistically near any ion there is an excess o f counter
central ion, be it in the gas phase or solution phase, is lowered as a result o f its
columbic interactions with its oppositely charged atmosphere"^ ^
Table 2. Comparison o f some o f the physical properties o f a standard cell (aqueous) and a gas phase cell (gas at 1800 K).
GAS WATER Reference
density / g cm'"^ 2 . 2 X 10'^ 1 .0 42
mobility’s"^^; cations
electrons /cm^ s'^ V* 5
4000
5.0 X 10"* 41
diffusion coefficient"^"*
D / cm^ s'^
0 .1 (273 K) 1 X 10'" 42
dielectric constant"*^ 1 .0 (O'" C) 78 (20° C) 43
1.3.3 Advantages of electrochemistry in the gas phase
Gas phase electrochemistry offers many benefits to the electrochemist. As well as
the rapid mass transport (up to 50 m s '' ) observed in this environment, there is also
approximately a five orders o f magnitude increase in diffusion coefficients
compared to the liquid phase. Gas phase electrochemistry also allows us to look
through a potential window not available in solution electrochemistry, because o f
1.4 Conductivity in a flame
Electric probes can be used to determine the concentration of positive ions and
electrons in a flame and were used as far back as 1906'^^. The most widely used is
the probe developed by Langmuir"^^ in 1924, now called the Langmuir probe, which
is very simple in design but complex in theory. A schematic of a Langmuir probe is
shown in figure 1.6. For flame investigation, metal wire probes of simple geometric
shape, cylindrical or spherical, are mainly used. Metal wire probes are generally
used because of their high melting points and ready availability. Depending on the
flame type and necessary spatial resolution, a length o f cylindrical probe may vary
from more than one centimetre to several millimetres and in diameter from about a
millimetre to several hundredths of a millimetre.
F la m e P latinum
working e l e c tr o d e
P re - h e a t z o n e
Burner
c o u n te r e l e c tr o d e
Pow er su p p ly
Figure 1.6 Schematic of the Langmuir probe set-up to make conductivity
measurements in a flame.
The absolute values of the electric current through the probe as well as the
thermoconductivity are dependent on the surface area of the probe. The probe
reactions in the flame. For the experiments in this work platinum wire 1.0 mm
diameter, which showed no visible fouling when inserted into the flame was used
unless otherwise stated.
1.4.1 The volt-ampere characteristic
By varying the potential difference between the probe and the base electrode, it is
possible to obtain a diagram of the current-to-probe dependence on its voltage, as
shown in figure 1.7, from which flame characteristics o f interest such as the
concentration of charged species, can then be determined. This is the basis for the
Flame Ionisation Detector (FID). The experimental part of this experiment is very
2e-6
2e-6
2e-6
^ 1e-6
5e-7
0
-5e-7
Vp
K
-6
-4
-2
0
E/V
Figure 1.7 The volt-ampere characteristic obtained in a H2/O2/N2 (1.6:0.6:1.0, L min'*) flame with no additives, obtained using a 1.0 mm platinum wire probe placed
5.0 mm above the burner plate with ca. 2mm of electrode penetrating the flame and
using the burner as counter electrode. Indicated on the plot are the plasma potential,
simple, and it is not too difficult to obtain the Volt-Ampere Characteristic (VAC)
curve. But the calculation o f charged species concentrations presents some
problems, because the theoretical model must describe the movement o f charged
species in the electric field in the vicinity o f the probe, as well as in the undisturbed
ambient plasma, in order to connect the charged species concentration with the
current-to-probe at a certain probe voltage.
The shape o f the VAC can be explained in the following way. When the probe has a
high positive potential, it attracts electrons and repels positive ions. A space with an
excess o f negative charge forms around the probe; the volume o f the space (sheath)
surrounding the probe is dependant on the applied potential and the concentration o f
charge carriers in the flame. In this case (positive potential) only electron current
flows to the probe. By reducing the positive potential o f the probe, the sheath
volume will be reduced, respectively. When the probe potential equals the potential
o f the surrounding plasma, the plasma potential, Vp in figure 1.7, the sheath will
disappear. Now the probe does not influence the movement o f the charged species
and they come into contact with the surface o f the probe as a result o f convection
only. As the velocities o f electrons are much higher than those o f positive ions, the
current to the probe at V p is mainly due to electrons. When the probe potential is
biased negatively, electrons are repelled from it, and positive ions are attracted. The
point where the electron and ion currents become equal is termed the floating
potential V f . The value o f this floating potential is sensitive to the combustion
conditions (see chapter 3).
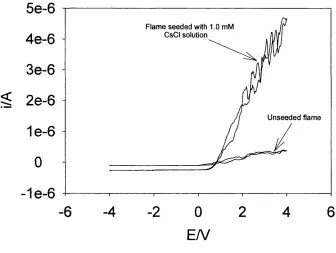
1.4.2 The effect on the VAC of introducing metal ions into a flame
On the introduction o f metal vapours to the flame, we generally see an increase in
the ion current and an increase in the electron current as can be seen in figure 1.8,
where a VAC obtained in a natural flame in compared to a VAC obtained in a flame
Energies (IE) o f the metal ceasium (IE 376 kJ m o f \ compared to the natural flame
species'^^, e.g. H and O2 w ho’s IE’s are ca. 1300 kJ mol"^. As expected a species
with a lower IE will ionise to a greater extent than a species with a higher IE for a
given amount o f energy. As the flame retains its electroneutrality, the number o f
ions (nj) produced must equal the number o f electrons (n e) produced, (Uj) = (Ue), or
more correctly the number o f positive charges must equal the number o f negative
charges. The ionisation mechanism is dependant on which metals are used but in
general involve, electron impact, collisional, chemi- and charge transfer reactions"^^.
Figure 1.8 shows a VAC obtained in a natural unseeded flame and a VAC obtained
in a flame seeded with a 1.0 mM CsCl solution. The increase in both the cation and
electron currents are visible in the VAC o f the seeded flame. The extra cations are
Cs^ and other cesium containing ions and the extra electrons are the other product
o f the ionisation process, Cs -> Cs^ + e‘
5e-6
Flame seeded with 1.0 mM CsCl solution
4e6
-3e-6
^ 2e-6
Unseeded flame
1e-6
-1e-6
6
4
2
0
2
4
6
E N
Figure 1.8 The increase in ion and electron currents on the introduction o f a 1.0 mM solution o f CsCl into a H2/O2/N2 (1.6:0.6:1.0, L min'^) flame, obtained using a
1.0 mm platinum wire probe placed 5.0 mm above the burner plate, with ca. 2 mm
The increase in currents generated at a particular voltage is directly proportional to
the concentration o f metal salt aspirated in to the flame gases. This can be seen in
figure 3.7 chapter 3, where the concentration o f KCl aspirated into the flame gases
is plotted against the currents generated in the flame with a probe biased at - 3V,
here the relationship is linear, with the straight line on the plot being a least squares
fit. Outside the range o f concentrations 1.0 mM - 1.0 pM the relationship deviates
from linearity. At higher concentrations, above the milimolar range there is too
much metal salt going into the flame and the proportion o f it that is ionised falls as a
consequence. At lower concentrations the purity o f water, the cleanliness o f the
glassware and the dilution technique used to dilute the solutions, all introduced a
margin o f error.
1.4.3 Calculation o f the concentration of ions in a flame
To calculate absolute values o f positive ion or electron concentrations in flames,
using a Langmuir type probe it is necessary to determine the conditions o f
movement o f charged species through the (sheath) layer boundary and inside the
layer surrounding the probe. This, “mode o f operation” o f the probe depends on the
ratio o f the free path length (A.^) o f the ions, the width o f the sheath o f volume
charge (Xd) and the probe diameter (d). For example in a collisionless (Xfp/Xo » 1),
thin (Xo/d « 1) sheath o f volume charge, at electron saturation current, all
electrons coming through the layer boundary enter the probe and the current is
giving by equation (39).
However in the experimental set-up used in this report where the probe diameter
was 1.0 mm and the experiments performed at atmospheric pressure. The mode o f
operation was, d > Xd > Xfp, i.e. the charged species collide inside the layer o f volume charge and the layer is thin compared to the probe size. This experimental
set-up is said to be operating in the mode o f the collisional thin sheath. In such
An estimation o f the ion concentration can still be made if we consider the mean
free path in a flame at atmospheric pressure is very small ca 1 0*^ cm and convection
is fast, 28 m s'^ in this work, (see the flame properties in the experimental section),
so the transport o f ions into the capture area will be dominated by the convective
flow.
Using equation (39) the current to a cylindrical probe will be given by
(39) I = j e A
Where j is the flux o f ions into the capture area, e is the elementary charge and A
the capture area, j can be calculated from, (40),
(40) j = Ui f
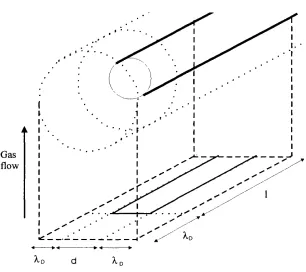
where Uj is the number density o f ions and f is the gas flow rate. The capture area, A
is the area where any ions passing through this area are captured by the electrode
(see figure 1.9) and is calculated by, (41),
(41) A = (d +2 ^d)(1 + ^d)
The sheath thickness, A.d is given by the equation^^,(42),
(42) >.D=(kT/4 7me^)“'* « 69.1(T/n)"'’
where T is expressed in degrees Kelvin and n is the ion concentration.
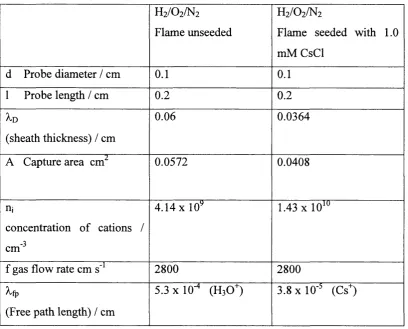
The values o f some o f the parameters involved with this experimental set-up have
been calculated using the data from figure 1.8. These include the sheath thickness
(^n), the free path length (Xfp) and the concentration o f cations for a natural
results are presented in the table 2. The mean free paths (Xfp) in table 3 were
calculated^^ from equation (43).
(43) Xjp = R T
42N^op
where Na is Avogadro constant, a the collisional cross sections and p the pressure.
ik
Gas flow
;
X X
Table 3. An estimation o f the values o f some o f the parameters associated with the experimental set up used in this work. Calculated from the data in figure 1. 8.
H2/O2/N2
Flame unseeded
H2/O2/N2
Flame seeded with 1.0
mM CsCl
d Probe diameter / cm 0 . 1 0 . 1
1 Probe length / cm 0 . 2 0 . 2
A.D
(sheath thickness) / cm
0.06 0.0364
A Capture area cm^ 0.0572 0.0408
nj
concentration o f cations /
-3
cm
4 . 1 4 X
10
^1.43
X 10*"f gas flow rate cm s"^ 2800 2800
^fp
(Free path length) / cm
5.3 xlO"* (H3O+) 3.8 X 10 ' (Cs^)
The interesting thing to note in the data presented in table.3 is the reduction in the
sheath thickness, l o and thus the reduction in the capture area as the concentration
o f ions increases. This can be understood by considering the electric field radiating
from the electrode. This electric field is neutralised by a surrounding sheath o f
oppositely charged species from the electrolyte. The electric field does not need to
penetrate as far into the electrolyte when the concentration o f charge carriers in the
electrolyte is higher and so the sheath thickness does not need to be as long. Also in
the data presented in table 3 for this experimental set up, it can be seen that the
sheath thickness (the charged area surrounding the electrode) is greater than the free
do not necessarily come into contact with the electrode surface but may in fact
collide inside the sheath resulting in the neutralisation o f the ion or indeed the
creation o f new ionic species. The data in table 3 is only representative for a cation
sheath at negative potentials, the sheath thickness at positive potentials will be
different.
1.5 Deposition of metal species from the gas phase
There are several methods o f depositing metal species from the gas phase. Some o f
the methods have similarities with processes encountered in this project and will be
discussed below.
1.5.1 The combustion torch
In the combustion torch method coatings are sprayed from rod or wire stock or from
powder material. The material is fed into a flame that melts it. The molten stock
then is stripped from the end o f the wire and atomised by a high-velocity stream o f
compressed air or other gases, coating the materials onto the work piece. Depending
on the substrate, bonding occurs because o f mechanical interlock with a roughened
surface and/or because o f Van der Waals forces (i.e., mutual attraction and cohesion
between two surfaces).
1.5.2 Plasma spray deposition
Plasma spraying involves the introduction o f a flow o f gas (usually argon-based)
between a water-cooled copper anode and a tungsten cathode. A direct current arc
passes through the gases and ionises it to form a plasma. The plasma heats the
powder coating to a molten state. Compressed gas propels the material to the work
1.5.3 Physical vapour deposition
This section will be split into two parts, Ion plating and Ion implantation.
1.5.3.1 Ion Plating/Plasma-Based
Plasma-based plating is the most common form o f ion plating. In plasma-based
plating, the substrate is placed in close proximity to a plasma. Ions are then
accelerated from the plasma by a negative bias onto the substrate. The accelerated
ions in the plasma deposit the coating on the surface substrate with a spectrum o f
energies.
1.5.3.2 Ion Implantation
Ion implantation does not produce a discrete coating; rather, the process alters the
elemental chemical composition o f the surface o f the substrate by forming an alloy
with energetic ions. A beam o f charged ions o f the desired element is formed by
feeding a gas into the ion source where electrons, emitted from a hot filament,
ionise the gas and form a plasma. An electrically biased extraction electrode focuses
the ions into a beam. If the energy is high enough, ions alloy with the substrate
instead o f onto the surface, changing the surface composition.
The processes outlined here in section 1.5 can be used to describe the processes we
see occurring when an electrode is inserted into a flame seeded with metal species.
This will be discussed further in the results section, chapter 3.
1.6 Summary of introduction
The existence o f ions in the gaseous phase has been well documented. A gaseous
concentration o f ions is low ca. 10 cm' . These gaseous ions are similar to liquid
phase ions and can be compared to them. The similarities include;
• Both ions (liquid and gas) exist in dynamic media
• The Debye-Hückle atmospheres that surrounds the ions consist o f
oppositely charged species
• The potential drop through the atmospheres is similar.
A flame was chosen for this project because o f the low set up cost and a flame can
be considered as a wall-less reactor into which electrodes could be inserted. The
other alternative, strong plasma needs containment and has higher capital costs.
Using two flames in intimate contact with each other and standard electrochemical
instruments, potentiostat and voltmeter, electrodes can be inserted into the flames
and measurements taken, both potentiometric and amperometric.
An enormous amount o f work has been done in this field and applications found for
the technologies discovered. These include flame spraying, plasma deposition^^ and
conductivity measurements (Flame Ionisation Detector). This project aims to fill
some o f the gaps in knowledge, experimental and theoretically, between plasma